. 2024 Jul 3;41(7):msae115.
doi: 10.1093/molbev/msae115.

Analysis of Evolutionary Conservation, Expression Level, and Genetic Association at a Genome-wide Scale Reveals Heterogeneity Across Polygenic Phenotypes

Affiliations

Analysis of Evolutionary Conservation, Expression Level, and Genetic Association at a Genome-wide Scale Reveals Heterogeneity Across Polygenic Phenotypes

Ann-Sophie Giel et al. Mol Biol Evol. .

Abstract

Understanding the expression level and evolutionary rate of associated genes with human polygenic diseases provides crucial insights into their disease-contributing roles. In this work, we leveraged genome-wide association studies (GWASs) to investigate the relationship between the genetic association and both the evolutionary rate (dN/dS) and expression level of human genes associated with the two polygenic diseases of schizophrenia and coronary artery disease. Our findings highlight a distinct variation in these relationships between the two diseases. Genes associated with both diseases exhibit a significantly greater variance in evolutionary rate compared to those implicated in monogenic diseases. Expanding our analyses to 4,756 complex traits in the GWAS atlas database, we unraveled distinct trait categories with a unique interplay among the evolutionary rate, expression level, and genetic association of human genes. In most polygenic traits, highly expressed genes were more associated with the polygenic phenotypes compared to lowly expressed genes. About 69% of polygenic traits displayed a negative correlation between genetic association and evolutionary rate, while approximately 30% of these traits showed a positive correlation between genetic association and evolutionary rate. Our results demonstrate the presence of a spectrum among complex traits, shaped by natural selection. Notably, at opposite ends of this spectrum, we find metabolic traits being more likely influenced by purifying selection, and immunological traits that are more likely shaped by positive selection. We further established the polygenic evolution portal (evopolygen.de) as a resource for investigating relationships and generating hypotheses in the field of human polygenic trait evolution.

Keywords: GWAS; complex traits; coronary artery disease; evolution; schizophrenia.


Figures

Fig. 1.
Fig. 1.
The evolutionary rate and expression level of highly and lowly associated genes with schizophrenia and coronary artery disease. a, b) The cumulative distribution functions (CDF) of the evolutionary rate (dN/dS) of 1000 genes with the highest association (in red), and 1000 genes with the lowest association (in blue) for schizophrenia (panel a), and coronary artery disease (panel b). The P-values in both panels are calculated from a two-sample Kolmogorov-Smirnov test. c, d) Tissue-specific average expression level (in units of transcripts per million mapped reads; number of RNA transcript copies per million mapped reads) of 1000 genes with the highest and lowest associations for schizophrenia (panel c), and coronary artery disease (panel d). The horizontal dashed lines in panels c and d correspond to the Bonferroni-corrected P-value, i.e. -log10(0.05/54) = 3.03.
Fig. 2.
Fig. 2.
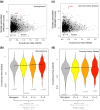
The expression and evolutionary rate quantiles of genes associated with schizophrenia and coronary artery disease. a, b) MAGMA z-scores of human genes versus their expression level (logarithm of the number of RNA transcript copies per million mapped reads) for schizophrenia (panel a), and coronary artery disease (panel b). c, d) MAGMA z-scores of human genes versus their evolutionary rate (logarithm of dN/dS) for schizophrenia (panel c), and coronary artery disease (panel d). The color scheme represents genes with MAGMA z-scores greater than different thresholds for their association with each disease, ranging from −2 (shown in gray) to 5 (shown in red). The vertical dashed lines in all panels represent deciles of the average expression level (panels a and b), and the evolutionary rate (panels c and d) of 14568 human genes.
Fig. 3.
Fig. 3.
Evolutionary rates of genes implicated in monogenic and polygenic diseases. a) The MAGMA z-score versus the evolutionary rate of human genes for association with schizophrenia. b) The evolutionary rates of genes implicated to monogenic diseases (n = 847), and the genes associated with schizophrenia. c) The MAGMA z-score versus the evolutionary rate of human genes for association with coronary artery disease. d) The evolutionary rates of genes implicated to monogenic diseases (n = 847), and the genes associated with the coronary artery disease. The circles with black line in panels a and c correspond to the genes implicated in different monogenic diseases, compiled in the DG-CST database (Boccia et al. 2005). The arrows in panels a and c correspond to the range of the evolutionary rate from the lowest 10th percentile to the highest 10th percentile for genes implicated in monogenic diseases, as well as genes exhibiting MAGMA z-scores > 6 associated with either schizophrenia (panel a) or coronary artery disease (panel c). This range is ∼0.07 to 0.63 for genes associated with the coronary artery disease and ∼0.06 to 0.63 for genes associated with schizophrenia. The corresponding range for the evolutionary rate of monogenic diseases is ∼0.06 to 0.47.
Fig. 4.
Fig. 4.
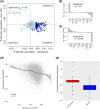
The relationship between genetic association and evolutionary rate and expression level varies in different categories of complex traits. a) The correlation between the negative logarithm of MAGMA P-value and evolutionary rate (Rrate) versus the correlation between the negative logarithm of MAGMA P-value and expression level (Rexpression) for 4576 complex traits. The gray, light blue, and dark blue colors correspond to genes whose correlations (either Rrate, or Rexpression) are nonsignificant, significant with a P-value < 0.05, and significant with a Bonferroni-corrected P-value (Padj) of 0.05, respectively. b, c) The difference in observed and expected fraction of different domains of polygenic traits in the quadrants B (panel b), and A (panel c). The P-values in these panels were calculated using a χ2 test. d) Evolutionary rate (dN/dS) versus the expression level of 15248 human genes in units of transcripts per million mapped reads with the loess line shown in dotted black. e) The average residual of genes associated with immunological traits (in red) and metabolic traits (in blue) from a loess regression between the evolutionary conservation and the expression level (data in panel d). In panel e, and for a reliable estimation of average values, we only considered traits with more than 50 associated genes (MAGMA P-values < 2.84 × 10⁻⁶).
Fig. 5.
Fig. 5.
The relationship between genetic association and expression level does not significantly change by the substantial tissue specificity of genes associated with complex traits. a) The number of tissues with a significant enrichment of highly associated genes to each trait. b) The enrichment of different domains of complex traits within traits showing enrichment across all tissues (∼14% of all traits; 665 out of 4756 traits). c) The Spearman's correlation coefficient between the negative base-10 logarithm of MAGMA P-values of genes associated with complex traits and their expression level in the least enriched tissue (y axis) plotted against the same correlation in the most enriched tissue (x axis).
Fig. 6.
Fig. 6.
Genes associated with immunological traits have a high fraction of positive direction of selection. a) The ranked fraction of associated genes (MAGMA P-value < 2.8 × 10⁻⁵) with a positive direction of selection (Equation 1) in different polygenic traits having variants with a derived allele frequency > 60%. b) The difference in the observed and expected fraction of different domains of polygenic traits within 100 traits with the highest fraction of positive degree of selection. c) The ranked fraction of associated genes (MAGMA P-value < 2.8 × 10⁻⁵) with a positive direction of selection (Equation 1) in different polygenic traits having variants with a derived allele frequency > 30%. d) The difference in observed and expected fraction of different domains of polygenic traits within 100 traits with the highest fraction of positive degree of selection. The enrichments in panels b and d were significant with P-values < 0.005 using a χ2 test of enrichment.

Similar articles

References

    1. Albert FW, Kruglyak L. The role of regulatory variation in complex traits and disease. Nat Rev Genet. 2015:16(4):197–212. 10.1038/nrg3891. - DOI - PubMed
    1. Arbiza L, Dopazo J, Dopazo H. Positive selection, relaxation, and acceleration in the evolution of the human and chimp genome. PLoS Comput Biol. 2006:2(4):e38. 10.1371/journal.pcbi.0020038. - DOI - PMC - PubMed
    1. Barghi N, Hermisson J, Schlötterer C. Polygenic adaptation: a unifying framework to understand positive selection. Nat Rev Genet. 2020:21(12):769–781. 10.1038/s41576-020-0250-z. - DOI - PubMed
    1. Barreiro LB, Quintana-Murci L. From evolutionary genetics to human immunology: how selection shapes host defence genes. Nat Rev Genet. 2010:11(1):17–30. 10.1038/nrg2698. - DOI - PubMed
    1. Barrio-Hernandez I, Schwartzentruber J, Shrivastava A, Del-Toro N, Gonzalez A, Zhang Q, Mountjoy E, Suveges D, Ochoa D, Ghoussaini M, et al. Network expansion of genetic associations defines a pleiotropy map of human cell biology. Nat Genet. 2023:55(3):389–398. 10.1038/s41588-023-01327-9. - DOI - PMC - PubMed