. 2024 Nov 15;210(10):1230-1242.
doi: 10.1164/rccm.202401-0145OC.

Profiling Bacteria in the Lungs of Patients with Severe Influenza Versus COVID-19 with or without Aspergillosis

Affiliations

Profiling Bacteria in the Lungs of Patients with Severe Influenza Versus COVID-19 with or without Aspergillosis

Simon Feys et al. Am J Respir Crit Care Med. .

Abstract

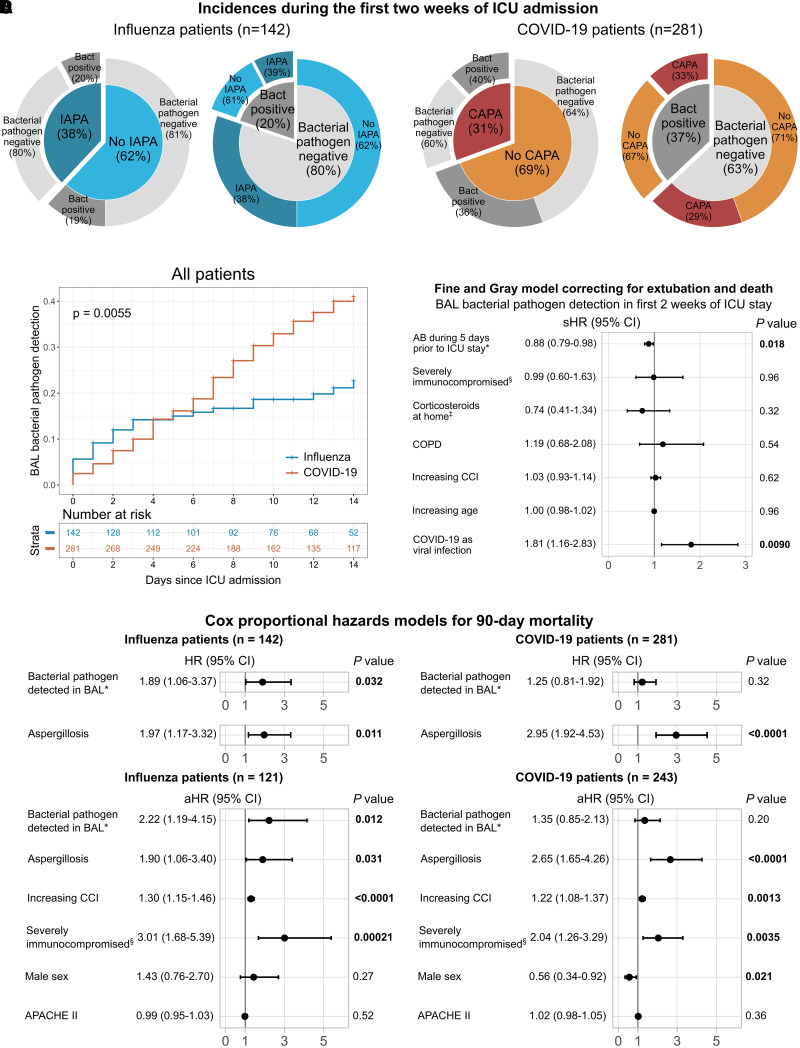
Rationale: The influence of the lung bacterial microbiome, including potential pathogens, in patients with influenza-associated pulmonary aspergillosis (IAPA) or coronavirus disease (COVID-19)-associated pulmonary aspergillosis (CAPA) has yet to be explored. Objectives: To explore the composition of the lung bacterial microbiome and its association with viral and fungal infection, immunity, and outcome in severe influenza versus COVID-19 with or without aspergillosis. Methods: We performed a retrospective study in mechanically ventilated patients with influenza and COVID-19 with or without invasive aspergillosis in whom BAL for bacterial culture (with or without PCR) was obtained within 2 weeks after ICU admission. In addition, 16S rRNA gene sequencing data and viral and bacterial load of BAL samples from a subset of these patients, and of patients requiring noninvasive ventilation, were analyzed. We integrated 16S rRNA gene sequencing data with existing immune parameter datasets. Measurements and Main Results: Potential bacterial pathogens were detected in 20% (28/142) of patients with influenza and 37% (104/281) of patients with COVID-19, whereas aspergillosis was detected in 38% (54/142) of patients with influenza and 31% (86/281) of patients with COVID-19. A significant association between bacterial pathogens in BAL fluid and 90-day mortality was found only in patients with influenza, particularly patients with IAPA. Patients with COVID-19, but not patients with influenza, showed increased proinflammatory pulmonary cytokine responses to bacterial pathogens. Conclusions: Aspergillosis is more frequently detected in the lungs of patients with severe influenza than bacterial pathogens. Detection of bacterial pathogens associates with worse outcome in patients with influenza, particularly in those with IAPA, but not in patients with COVID-19. The immunological dynamics of tripartite viral-fungal-bacterial interactions deserve further investigation.

Keywords: COVID-19; aspergillosis; immunology; influenza; microbiome.


Figures

Figure 1.
Figure 1.
Incidence and associations with outcome of a positive culture or PCR for a bacterial pathogen in BAL fluid, or invasive aspergillosis, during the first 2 weeks of ICU admission in patients mechanically ventilated for influenza or coronavirus disease (COVID-19). (A) Incidence of invasive aspergillosis and bacterial pathogen identification in BAL fluid in the first 2 weeks since ICU admission, subdivided in the influenza and COVID-19 cohorts. (B) Cumulative incidence curves of patients with influenza and patients with COVID-19 showing incidence of a positive bacterial pathogen in BAL culture or PCR during the first 2 weeks of their ICU stay. Censoring was performed at extubation, death, or after 14 days after ICU admission. Gray’s test P value is shown. Risk table shows the number of patients at risk at the start of the day since ICU admission. (C) Forest plot showing the results of the Fine and Gray model for 14-day incidence of a positive bacterial pathogen BAL culture or PCR, correcting for competing risks (extubation or death) and relevant clinical factors. Fine and Gray model incorporating antibiotic and corticosteroids use during ICU stay can be found in Figure E2. *Number of days on antibiotics during the 5 days preceding ICU stay. §Severely immunocompromised, as defined by the European Organization for Research and Treatment of Cancer and Mycosis Study Group Education and Research Consortium (EORTC/MSGERC) host factors for invasive mold disease (34). Low-dose (below EORTC/MSGERC cutoff) corticosteroids as home medication. (D) Cox proportional hazard models for 90-day mortality in patients with influenza or COVID-19. Two univariable models (with bacterial pathogen identification in BAL fluid during the first 2 weeks of ICU admission, or aspergillosis throughout the ICU stay) and a similar model with additional relevant clinical variables are shown for the influenza cohort and the COVID-19 cohort. The number of patients included in the large multivariable models is lower because of missing data for APACHE II scores on ICU admission. In all models, bacterial pathogen identification and aspergillosis are modeled as time-dependent variables. *Detected in BAL fluid during the first 2 weeks of ICU stay through culture or PCR. §Severely immunocompromised, as defined by the EORTC/MSGERC host factors for invasive mold disease (34). Cox proportional hazards models for 30-day mortality are illustrated in Figure E3. AB = antibiotics; APACHE II = Acute Physiology and Chronic Health Evaluation II; Bact = bacterial; CAPA = COVID-19–associated pulmonary aspergillosis; CCI = Charlson Comorbidity Index; CI = confidence interval; COPD = chronic obstructive pulmonary disease; HR = hazard ratio; IAPA = influenza-associated pulmonary aspergillosis; sHR = subdistribution hazard ratio.
Figure 2.
Figure 2.
BAL 16S rRNA gene sequencing analyses. (A) Study design and number of included patients in the BAL bacterial microbiome study. Figure created with aid of Biorender.com. (B) Multidimensional scaling plot showing bacterial β diversity (according to Aitchison distance metrics) of BAL fluid, with patients stratified for viral–fungal infection type. (C) α diversity metrics calculated in BAL fluid, with patients stratified for viral–fungal infection type. P values calculated by Mann-Whitney U test are shown. (D) Relative abundance of the most abundant classified genera in all patients. See Figure E6 for the plot including the most abundant unclassified genera. (E) Relative abundance of genera per patient, stratified for viral–fungal infection type. Each bar on the x-axis represents a single patient. (F) Boxplots showing relative abundances of the nine most prevalent identified genera, with patients stratified for viral–fungal infection type. P values calculated by Student’s t test are shown. See Figure E6 for the plot with P values calculated by Mann-Whitney U test. (G) Dot plot depicting significantly enriched or depleted species at P < 0.05 in the four relevant viral–fungal infection type comparisons. Size of the dots is determined by number of positive tests (Mann-Whitney U test, linear models or selection of balances). See Figure E8 for details on the specific tests that were positive for each significantly enriched or depleted species and for details regarding significant results after correction for multiple testing. CAPA = coronavirus disease (COVID-19)–associated pulmonary aspergillosis; IAPA = influenza-associated pulmonary aspergillosis.
Figure 3.
Figure 3.
Integration with existing BAL immune parameters. (A) Correlogram showing correlations between Shannon and Simpson diversity indices and previously published concentrations of cytokines, chemokines, and growth factors on the same BAL sample (12). Only proteins for whom a significant correlation was found are shown. Color legend shows the range of Spearman’s rho. *P value < 0.05, **P value < 0.01, and ***P value < 0.001. (B) Boxplots showing levels of IL-1β and TNF in BAL fluid, stratified for negative or positive culture or PCR results for a bacterial pathogen in the same sample. P values obtained by Mann-Whitney U test are shown. (C) Volcano plots showing differentially expressed genes (DEGs) in patients with influenza and in patients with coronavirus disease (COVID-19) with versus without a positive BAL culture or PCR for a bacterial pathogen on the same sample. For the volcano plot in patients with COVID-19, the cutoff at 0.05 Benjamini-Hochberg FDR is shown. Significant DEGs of interest are annotated. CAPA = COVID-19–associated pulmonary aspergillosis; COVID-19 = coronavirus disease; FDR = false discovery rate; IAPA = influenza-associated pulmonary aspergillosis.
Figure 4.
Figure 4.
Associations between BAL Aspergillus culture results and bacterial α diversity indices, viral load, and bacterial load. (A) Boxplots showing Shannon and Simpson diversity indices in BAL fluid stratified for positive or negative Aspergillus culture results in the same sample in patients with influenza-associated pulmonary aspergillosis (IAPA) and patients with coronavirus disease (COVID-19)–associated pulmonary aspergillosis (CAPA). P values obtained by Mann-Whitney U test are shown. (B) Study design and number of included patients in the BAL viral and bacterial load study. Figure created with aid of Biorender.com. (C) Boxplots showing the association between BAL bacterial culture, PCR or oral flora (through direct microscopy or culture) results, and 16S rRNA gene cycling threshold (Ct) value on the same BAL sample. Lower Ct value indicates higher bacterial load. P values obtained by Mann-Whitney U test are shown. (D) Boxplots showing the association between BAL viral load (represented as normalized viral log10 copies/ml) for influenza A, influenza B, and severe acute respiratory syndrome coronavirus 2 (SARS-CoV-2) and underlying disease. P values obtained by a generalized linear model correcting for time between ICU admission and BAL sampling are shown. (E) Boxplots showing the association between BAL bacterial load and underlying disease. Lower Ct value indicates higher bacterial load. P values obtained by Mann-Whitney U test are shown. (F) Boxplots showing the association between BAL viral load (represented as normalized viral log10 copies/ml) for influenza A, influenza B, and SARS-CoV-2 and underlying BAL Aspergillus culture positivity in patients with IAPA and CAPA. P values obtained by a generalized linear model correcting for time between ICU admission and BAL sampling are shown, except (*) for influenza B, where a P value obtained by Mann-Whitney U test is shown. (G) Boxplots showing the association between bacterial load and underlying BAL Aspergillus culture positivity in patients with IAPA and CAPA. Lower Ct value indicates higher bacterial load. P values obtained by Mann-Whitney U test are shown.

Comment in

References

    1. Paget J, Spreeuwenberg P, Charu V, Taylor RJ, Iuliano AD, Bresee J, et al. Global Seasonal Influenza-associated Mortality Collaborator Network and GLaMOR Collaborating Teams Global mortality associated with seasonal influenza epidemics: new burden estimates and predictors from the GLaMOR Project. J Glob Health . 2019;9:020421. - PMC - PubMed
    1. Hu B, Guo H, Zhou P, Shi Z-L. Characteristics of SARS-CoV-2 and COVID-19. Nat Rev Microbiol . 2021;19:141–154. - PMC - PubMed
    1. Schauwvlieghe AFAD, Rijnders BJA, Philips N, Verwijs R, Vanderbeke L, Van Tienen C, et al. Dutch-Belgian Mycosis study group Invasive aspergillosis in patients admitted to the intensive care unit with severe influenza: a retrospective cohort study. Lancet Respir Med . 2018;6:782–792. - PubMed
    1. Prattes J, Koehler P, Hoenigl M, Wauters J, Giacobbe DR, Lagrou K, et al. ECMM-CAPA Study Group COVID-19 associated pulmonary aspergillosis: regional variation in incidence and diagnostic challenges. Intensive Care Med . 2021;47:1339–1340. - PMC - PubMed
    1. Janssen NAF, Nyga R, Vanderbeke L, Jacobs C, Ergün M, Buil JB, et al. Multinational observational cohort study of COVID-19-associated pulmonary aspergillosis. Emerg Infect Dis . 2021;27:2892–2898. - PMC - PubMed

MeSH terms

Substances