. 2024 Jun 24;64(12):4709-4726.
doi: 10.1021/acs.jcim.4c00059. Epub 2024 Jun 12.

Conformational Dynamics of the Nucleosomal Histone H2B Tails Revealed by Molecular Dynamics Simulations

Affiliations

Conformational Dynamics of the Nucleosomal Histone H2B Tails Revealed by Molecular Dynamics Simulations

Rutika Patel et al. J Chem Inf Model. .

Abstract

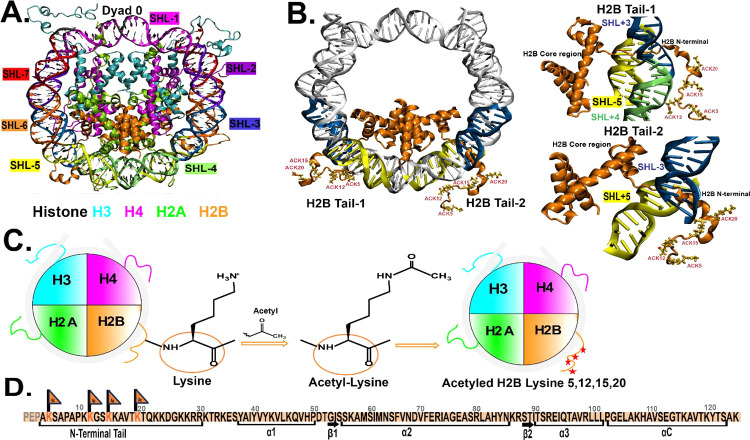
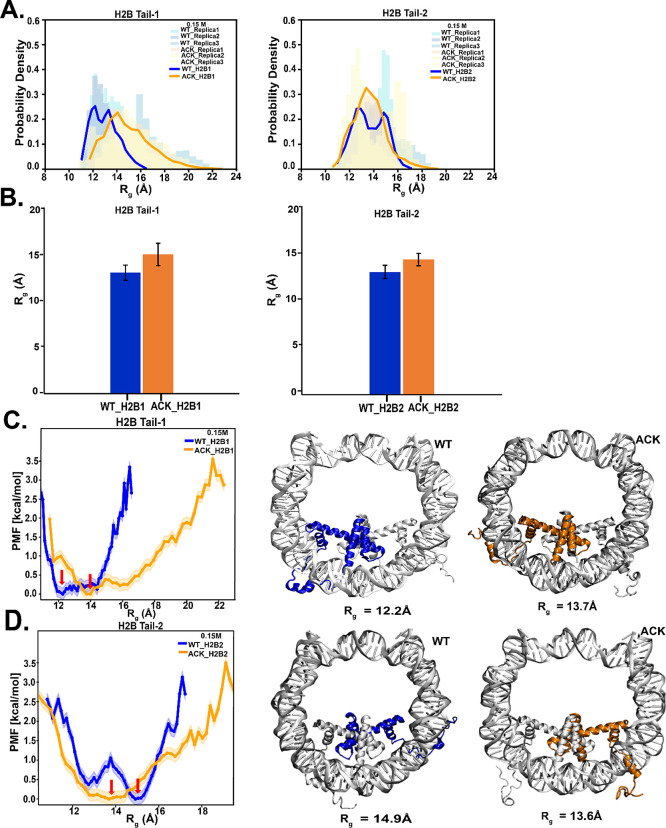
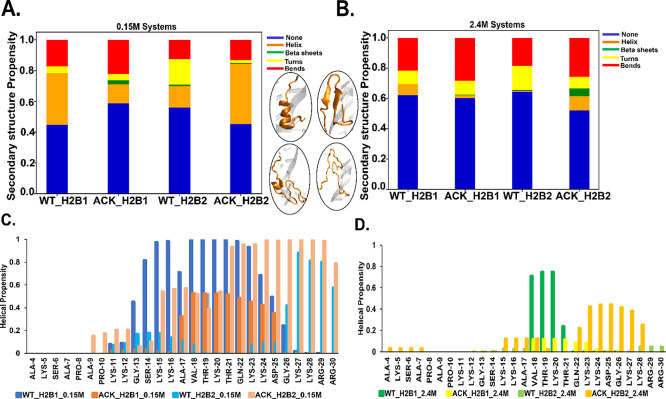
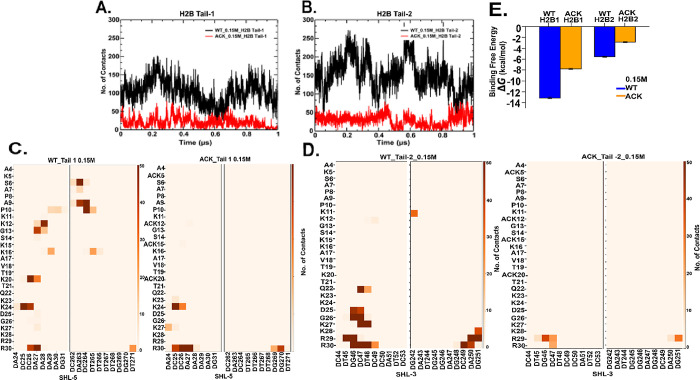
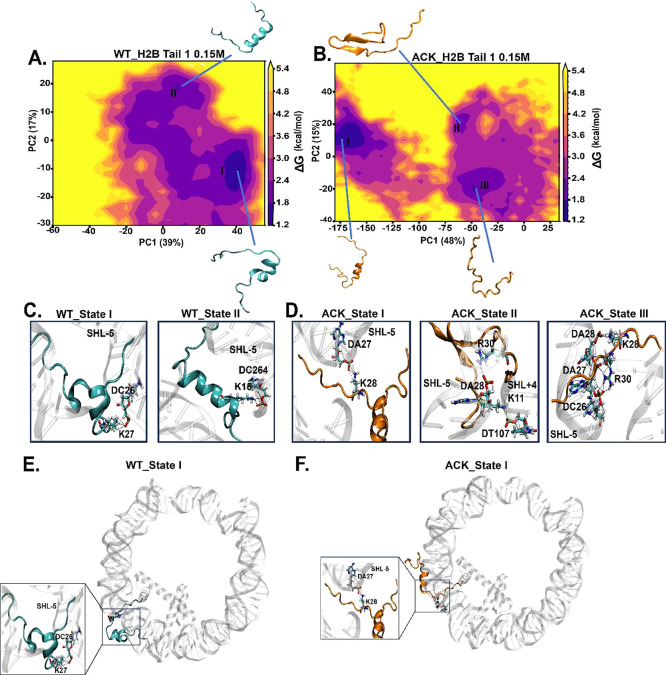
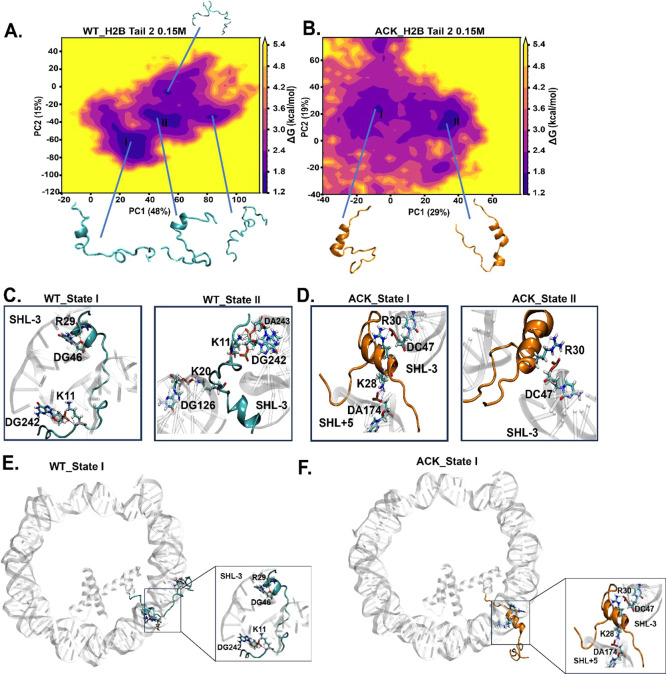
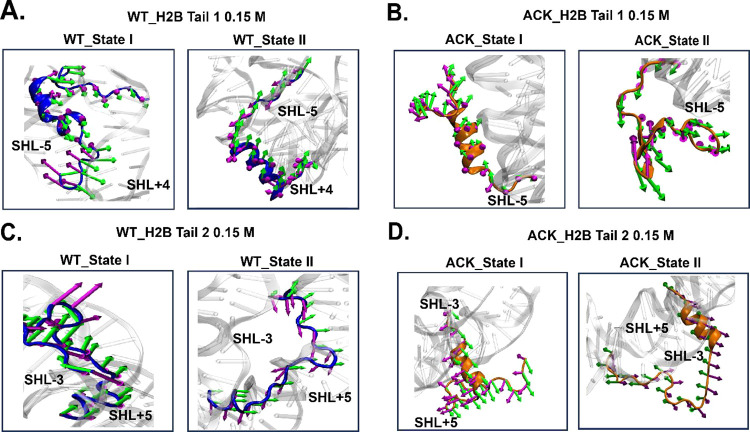
Epigenetic modifications of histone N-terminal tails play a critical role in regulating the chromatin structure and biological processes such as transcription and DNA repair. One of the key post-translational modifications (PTMs) is the acetylation of lysine residues on histone tails. Epigenetic modifications are ubiquitous in the development of diseases, such as cancer and neurological disorders. Histone H2B tails are critical regulators of nucleosome dynamics, biological processes, and certain diseases. Here, we report all-atomistic molecular dynamics (MD) simulations of the nucleosome to demonstrate that acetylation of the histone tails changes their conformational space and interaction with DNA. We perform simulations of H2B tails, critical regulators of gene regulation, in both the lysine-acetylated (ACK) and unacetylated wild type (WT) states. To explore the effects of salt concentration, we use two different NaCl concentrations to perform simulations at microsecond time scales. Salt can modulate the effects of electrostatic interactions between the DNA phosphate backbone and histone tails. Upon acetylation, H2B tails shift their secondary structure helical propensity. The number of contacts between the DNA and the H2B tail decreases. We characterize the conformational dynamics of the H2B tails by principal component analysis (PCA). The ACK tails become more compact at increased salt concentrations, but conformations from the WT tails display the most contacts with DNA at both salt concentrations. Mainly, H2B acetylation may increase the DNA accessibility for regulatory proteins to bind, which can aid in gene regulation and NCP stability.


Conflict of interest statement

The authors declare no competing financial interest.

Figures

Figure 1
Figure 1
Overview of nucleosome core particle (NCP) structure and acetylation. (A) Crystal structure of NCP (PDB ID: 1KX5) consists of 147 DNA base pairs wrapped around two copies of the histone proteins H3 (cyan), H4 (magenta), H2A (green), and H2B (orange). The super helix locations (SHLs) of DNA are indicated with different colors; each color corresponds to each SHL region labeled on the outside. (B) NCP shows H2B tail-1 (left) and H2B tail-2 (right) protruding between two DNA gyres around SHL ± 5 (yellow) and SHL ± 3 (blue) regions. DNA gyres are shown in gray, and the H2B core and tail regions are shown in orange. The acetylated lysine (ACK) residues 5, 12, 15, and 20 are shown and labeled. The two figures on the right show the best representation of the H2B tail-1 and 2 with core regions (orange) and DNA SHL ± 5 (yellow) and SHL ± 3 (blue) regions. (C) General scheme of the acetylation process shows the disc structure of the NCP of the 1KX5 system with histones H3 (cyan), H4 (magenta), H2A (green), H2B (orange), and nucleosomal DNA (gray). The schematic diagram shows H2B tail lysine acetylation. The positive charge of the lysine is replaced by the acetyl (−CH3CO) group, making acetyl-lysine (ACK), and the four red stars at the end on the H2B tail (orange) show four lysine residues of the tail that are neutralized through acetylation. (D) Sequence of H2B with an N-terminal tail includes the residue numbers and sites for acetylated lysine (orange flags). The first three residues PEP of the H2B tail in 1KX5 PDB structure are absent; therefore, the N-terminal tail is considered from residue 4 to 30 amino acid residues.
Figure 2
Figure 2
Radius of gyration (Rg) of the H2B N-terminal tail upon acetylation. (A) Radius of gyration (Rg) of H2B N-terminal tails at 0.15 M NaCl concentration are calculated based on Cα of the tail residues over 1 μs simulation. The H2B Tail-1 (H2B1) probability density distribution of the ACK tail (orange) is extended compared to WT (blue). The H2B Tail-2 (H2B2) probability density distribution shows a slightly extended tail upon acetylation (orange) compared to WT (blue). The histogram shows the distribution for three replicas, and the solid line represents the average of Rg for replicas. (B) Average Rg of three replicas for H2B tails for WT and ACK systems at 0.15 M salt concentrations is obtained by dividing the data into nonoverlapping blocks nonoverlapping blocks using 11 blocks approximately 91 ns per block for 1 μs simulation. (C and D) Potential of mean force (PMF) as a function of the radius of gyration (Rg) for both H2B Tail-1 and Tail-2 for WT (blue) and ACK (orange) is calculated based on PMF = −KbT log(P/Pmax). The configurations of H2B tails for both the WT (blue) and ACK (orange) systems are shown with their corresponding Rg values.
Figure 3
Figure 3
Secondary structure propensity of the H2B N-terminal tails. (A and B) Secondary structure formation of WT and ACK H2B N-terminal tails at 0.15 and 2.4 M NaCl concentrations are represented by different colors: none (blue), helix (orange), β sheets (green), turns (yellow), and bends (red). At 0.15 M NaCl concentration, H2B tail-1 (H2B1) for WT (WT_H2B1) shows more helices. ACK (ACK_H2B1) shows the formation of β-sheets. For H2B tail 2, the helical structures increase in ACK_H2B2 tail, which indicates the compactness of the tail compared to WT_H2B2. At 2.4 M NaCl concentration, the WT_H2B1 tail shows slightly more helices than ACK_H2B1. ACK _H2B2 shows increases in helices compared to WT_H2B2. The four inserts of acetylated H2B tails are shown as an example of distinct secondary structure formation. (C and D) Residue-wise helical propensity of the H2B tail residues of WT and ACK systems at 0.15 and 2.4 M NaCl concentration show the formation of helices (alpha, π, 310 helices) during 1 μs simulation. The beginning residues 4–10 are mostly flexible and disordered, while the ending residues from 11 to 30 show some helical structure in WT_0.15 M. The end of the tail residues 11–30 mostly stays between two DNA gyres around SHL ± 5 and SHL ± 3 regions. The 2.4 M NaCl concentration tails show fewer helical structures, which also include the end of the tail residues.
Figure 4
Figure 4
DNA-histone H2B N-terminal tails contacts analysis. (A and B) Number of contacts between H2B N-terminal tail and DNA as a function of time for 0.15 M NaCl concentration over 1 μs simulation with 4.5 Å cutoff distance shows decrease in ACK (red) tails upon acetylating four lysine residues of tails compared to WT (black). (C and D) Contact maps show total number of contacts of WT and ACK tails between specific tail residues and DNA base pair of SHL-5 and SHL-3 for H2B tail-1 and 2 respectively. Overall, contact maps also show a decrease in the number of contacts upon acetylation. (E) Binding free energy calculated for WT (blue) and acetylated (orange) systems for both H2B tails tail-1 (H2B1) and tail-2 (H2B2) with DNA SHL ± 5 regions indicating more binding free energy for the WT system (blue) compared to ACK (orange).
Figure 5
Figure 5
Identification of H2B N-terminal tail-1 conformations upon acetylation using principal component analysis (PCA). (A and B) PCA analysis is performed to study the conformations of the H2B N-terminal tail-1 of WT and ACK for 1 μs simulation. The energy landscape is constructed using the first two principal components (PC) for WT and ACK H2B tail-1 with their percentage variances. (C and D) H2B tail conformations obtained from the PCA free energy surface show tail-DNA interactions between DNA base pairs and positively charged residues of the H2B N-terminal tail. The WT H2B tail-1 states I and II exhibit hydrogen bonds between K27 with the phosphate backbone of DC26 and K15 with DC264 of the SHL-5 region. The ACK H2B tail-1 states I, II, and III exhibit hydrogen bonds among K28, K11, and K28 and DA27, DT107, and DA28, respectively. Also, ACK states II and III exhibit hydrogen bonds between R30 and DA28 and DA27 of the SHL-5 region, respectively. (E) and (F) H2B tail conformational state I of WT and ACK tail’s location with respect to DNA (see Figure S19 for other states).
Figure 6
Figure 6
Identification of H2B N-terminal tail-2 dynamics upon acetylation using principal component analysis (PCA). (A and B) PCA analysis is performed to study the conformations of the H2B N-terminal tail-2 of WT and ACK for 1 μs simulation. The energy landscape is constructed using the first two principal components (PC) for the WT and ACK H2B tail-2. It generates more concentrated major minima, to which major tail conformation states belong to. (C and D) H2B tail conformations obtained from the PCA free energy surface show tail–DNA interactions between DNA base pairs and positively charged residues of the H2B N-terminal tail. The WT H2B tail-2 states I and II exhibit hydrogen bonds between K11 and the phosphate backbone of DG242 and between K20 and DG126, respectively. The WT H2B tail-2 state I exhibits a hydrogen bond between R29 and DG46. The ACK H2B tail-2 states I and II exhibit hydrogen bonds between K28 with DA147 and R30 with DC47, respectively. (E and F) H2B tail conformation state I of WT and ACK tail’s location with respect to DNA (see Figure S19 for other states).
Figure 7
Figure 7
Porcupine plots of H2B tails. Porcupine plots are drawn to visualize the direction of PC1 and PC2 obtained from the PCA. The dominant motions of Cα atoms of tail residues in (A) WT H2B tail-1 (blue), (B) ACK H2B tail-1 (orange), (C) WT H2B tail-2 (blue), and (D) ACK H2B tail-2 (orange) are indicated with arrows for each conformation in green (PC1) and magenta (PC2) color. The arrows depict the direction of motion for each conformation. The magnitude of motion is indicated by the length of arrows.

Similar articles

Cited by

References

    1. Kornberg R. D. Chromatin Structure: A Repeating Unit of Histones and DNA. Science 1974, 184, 868–871. 10.1126/science.184.4139.868. - DOI - PubMed
    2. From NLM.

    1. McGinty R. K.; Tan S. Nucleosome Structure and Function. Chem. Rev. 2015, 115, 2255–2273. 10.1021/cr500373h. - DOI - PMC - PubMed
    1. Segal E.; Fondufe-Mittendorf Y.; Chen L.; Thåström A.; Field Y.; Moore I. K.; Wang J. P.; Widom J. A Genomic Code for Nucleosome Positioning. Nature 2006, 442, 772–778. 10.1038/nature04979. - DOI - PMC - PubMed
    2. From NLM.

    1. Luger K.; Mäder A. W.; Richmond R. K.; Sargent D. F.; Richmond T. J. Crystal Structure of the Nucleosome Core Particle at 2.8 a Resolution. Nature 1997, 389, 251–260. 10.1038/38444. - DOI - PubMed
    2. From NLM.

    1. Cutter A. R.; Hayes J. J. A Brief Review of Nucleosome Structure. FEBS Lett. 2015, 589, 2914–2922. 10.1016/j.febslet.2015.05.016. - DOI - PMC - PubMed
    2. From NLM.