. 2024 Jul:105:105191.
doi: 10.1016/j.ebiom.2024.105191. Epub 2024 Jun 11.

Sex-specific biphasic alpha-synuclein response and alterations of interneurons in a COVID-19 hamster model

Affiliations

Sex-specific biphasic alpha-synuclein response and alterations of interneurons in a COVID-19 hamster model

Cara Sophie Schreiber et al. EBioMedicine. 2024 Jul.

Abstract

Background: Coronavirus disease 2019 (COVID-19) frequently leads to neurological complications after recovery from acute infection, with higher prevalence in women. However, mechanisms by which SARS-CoV-2 disrupts brain function remain unclear and treatment strategies are lacking. We previously demonstrated neuroinflammation in the olfactory bulb of intranasally infected hamsters, followed by alpha-synuclein and tau accumulation in cortex, thus mirroring pathogenesis of neurodegenerative diseases such as Parkinson's or Alzheimer's disease.

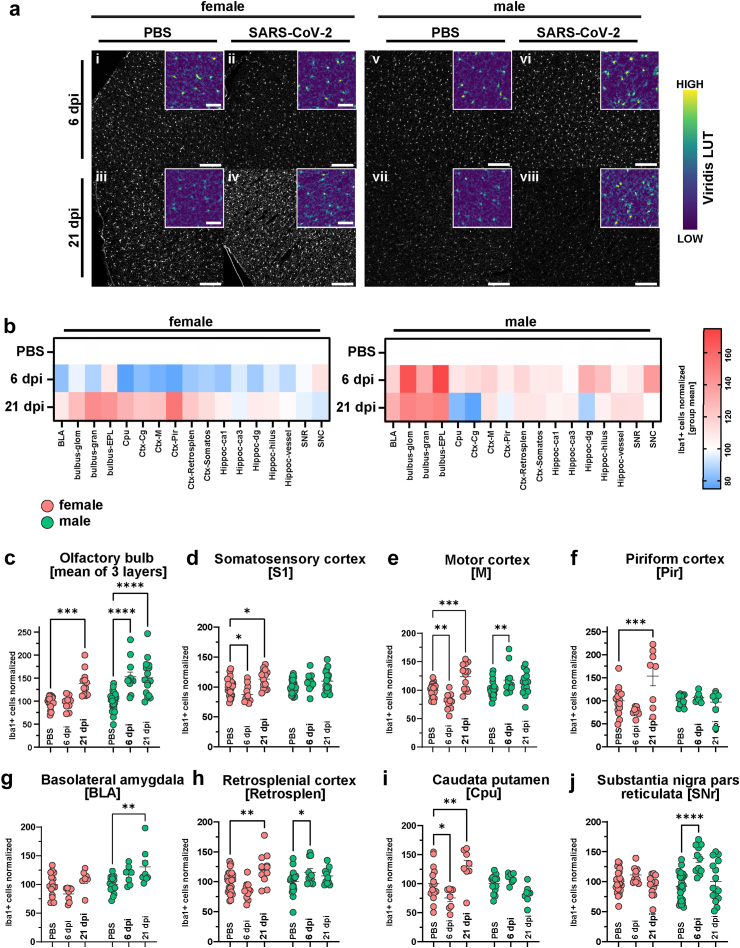
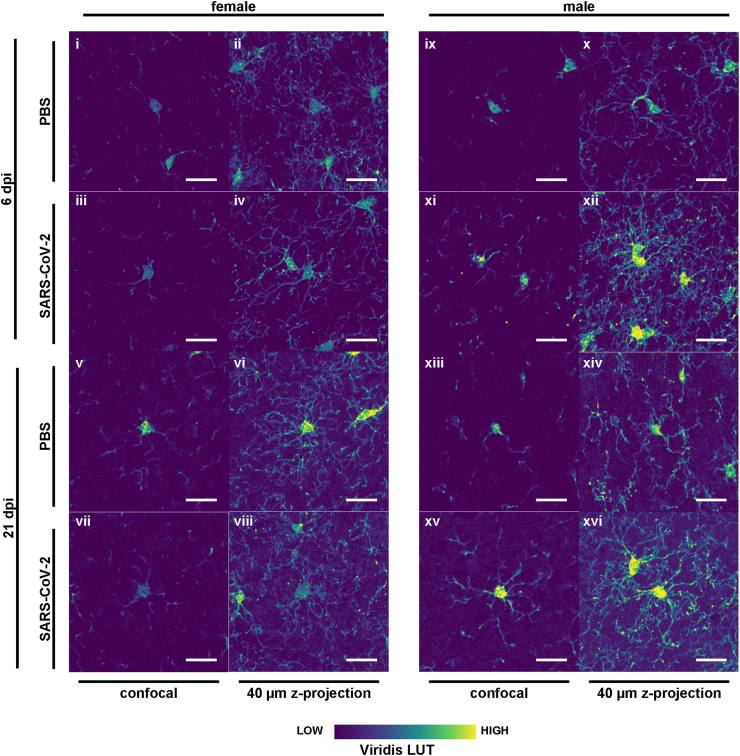
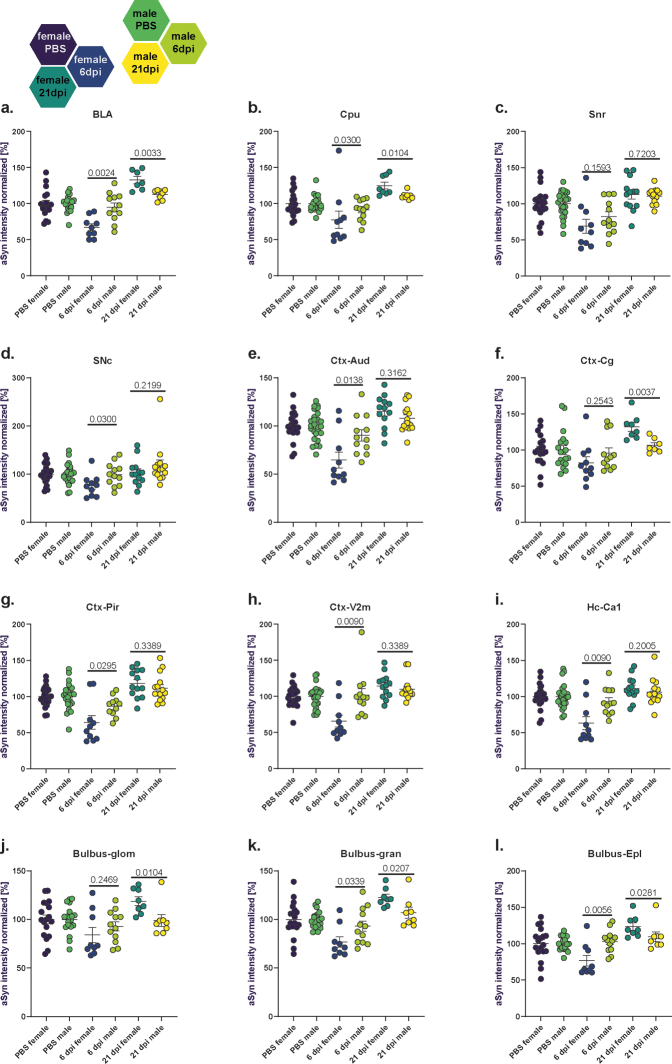
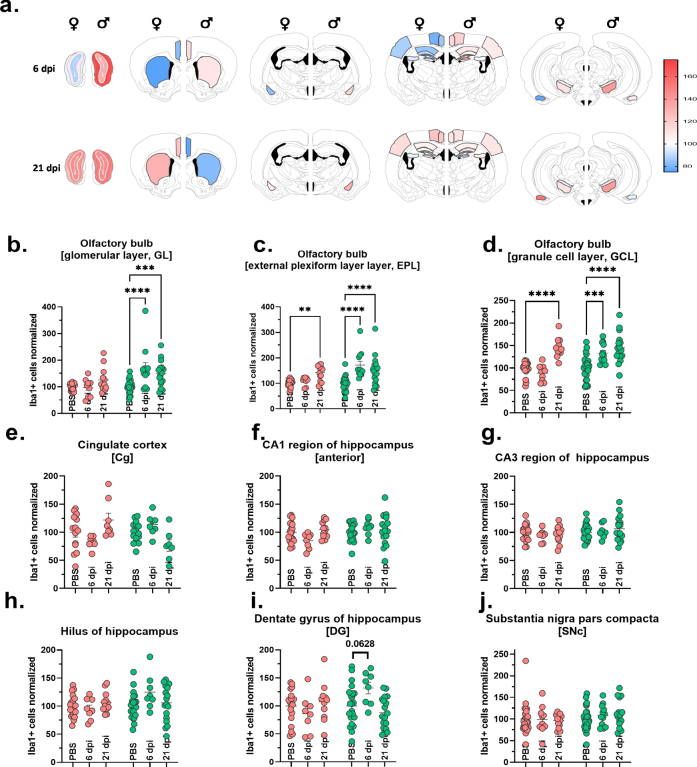
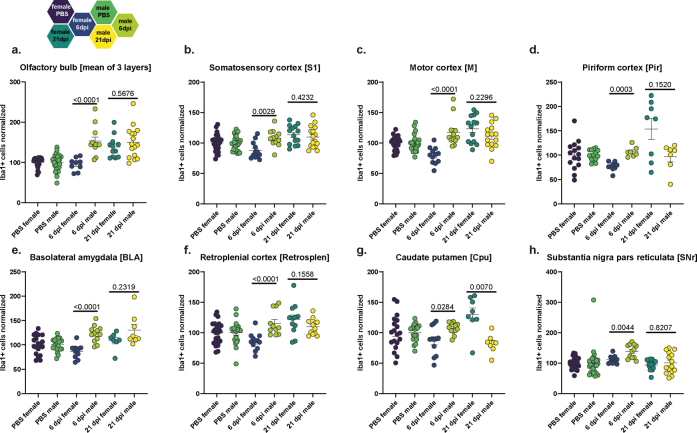
Methods: To uncover the sex-specific spatiotemporal profiles of neuroinflammation and neuronal dysfunction following intranasal SARS-CoV-2 infection, we quantified microglia cell density, alpha-synuclein immunoreactivity and inhibitory interneurons in cortical regions, limbic system and basal ganglia at acute and late post-recovery time points.

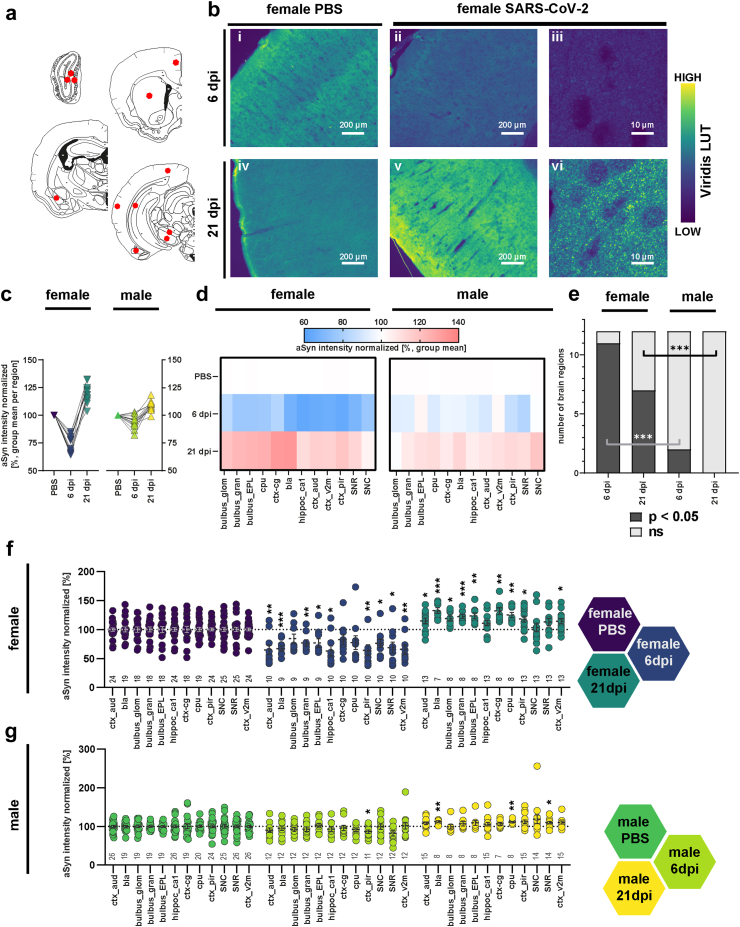
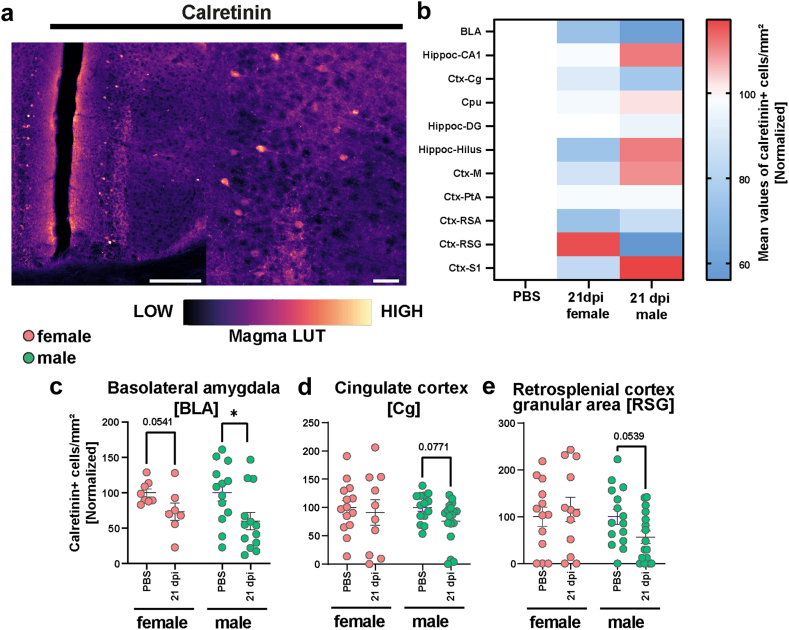
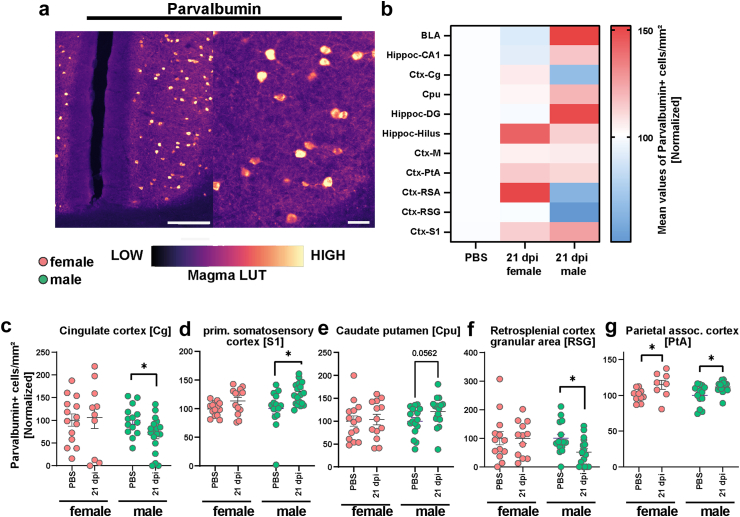
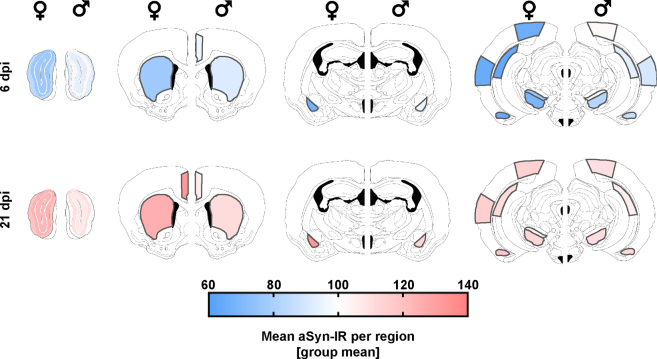
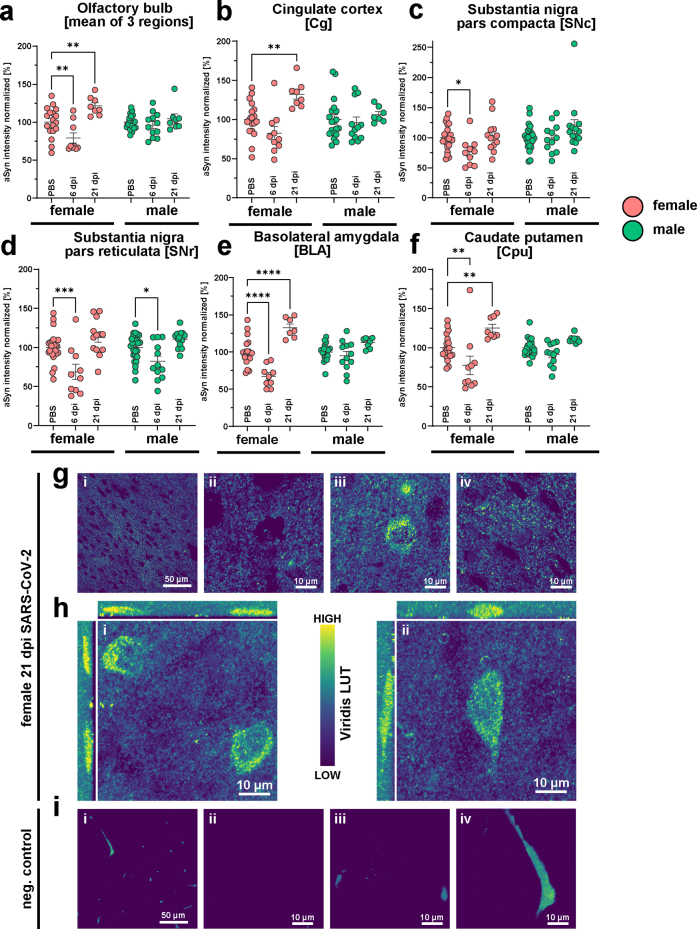
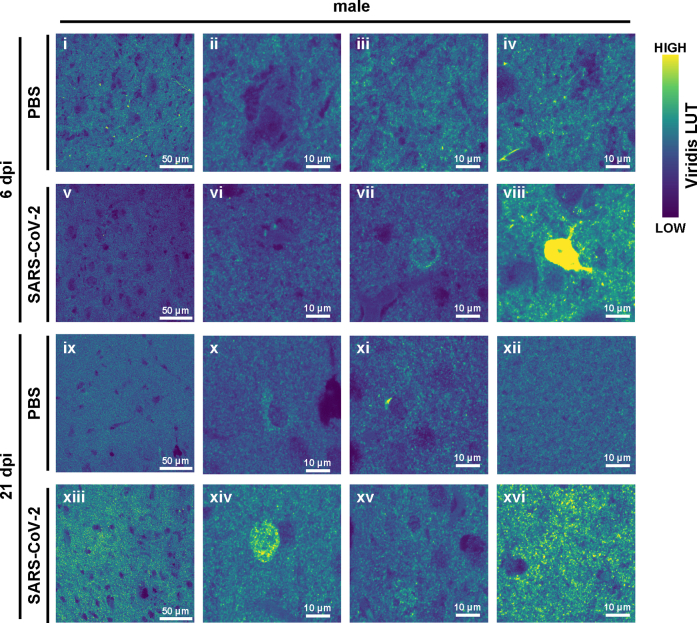
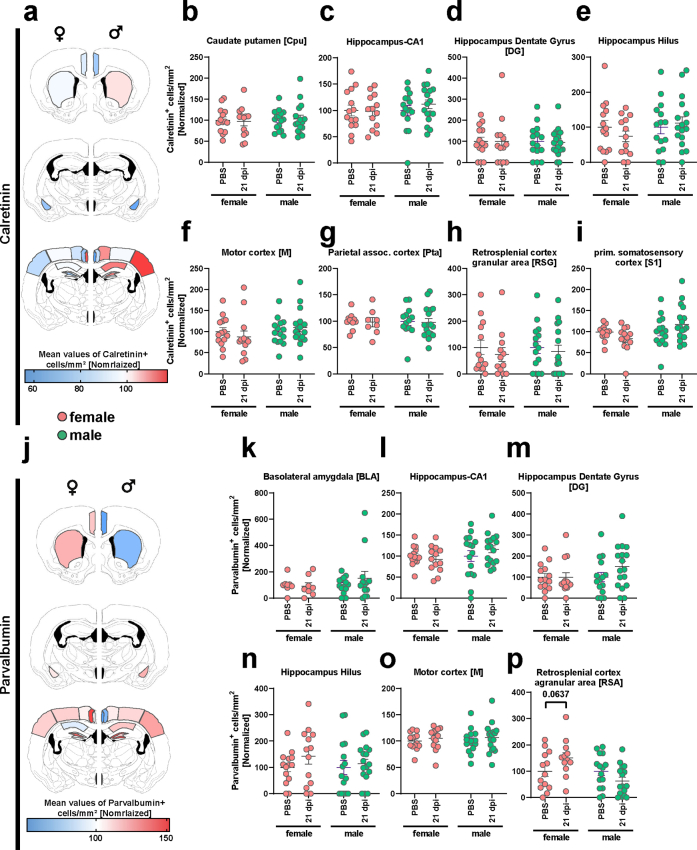
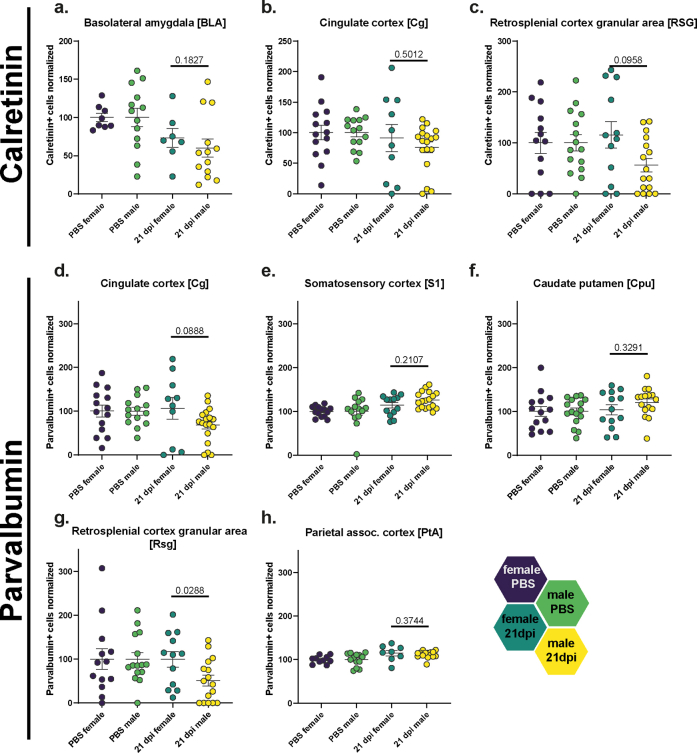
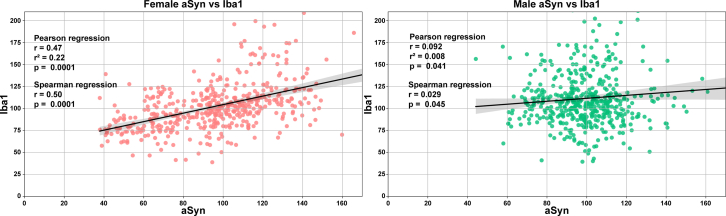
Findings: Unexpectedly, microglia cell density and alpha-synuclein immunoreactivity decreased at 6 days post-infection, then rebounded to overt accumulation at 21 days post-infection. This biphasic response was most pronounced in amygdala and striatum, regions affected early in Parkinson's disease. Several brain regions showed altered densities of parvalbumin and calretinin interneurons which are involved in cognition and motor control. Of note, females appeared more affected.

Interpretation: Our results demonstrate that SARS-CoV-2 profoundly disrupts brain homeostasis without neuroinvasion, via neuroinflammatory and protein regulation mechanisms that persist beyond viral clearance. The regional patterns and sex differences are in line with neurological deficits observed after SARS-CoV-2 infection.

Funding: Federal Ministry of Health, Germany (BMG; ZMV I 1-2520COR501 to G.G.), Federal Ministry of Education and Research, Germany (BMBF; 03COV06B to G.G.), Ministry of Science and Culture of Lower Saxony in Germany (14-76403-184, to G.G. and F.R.).

Keywords: Neurodegenerative disease; Neuroinflammation; Neurological symptoms; Post COVID-19 condition.


Conflict of interest statement

Declaration of interests The authors declare that they have no conflict of interest.

Figures

Fig. 1
Fig. 1
Biphasic response of alpha-synuclein immunoreactivity following SARS-CoV-2 infection. (a). Schematic representation of the coronal hamster brain sections that were stained, red dots highlighting the regions of interest examined (Olfactory bulb glomerular, granular and external plexiform layers (bulbus_glom, gran, EPL), caudate putamen (cpu), cingulate cortex (ctx_cg), basolateral amygdala (bla), ca1 region of hippocampus (hippoc-ca1), and aud, v2m and pir regions of cortex, substantia nigra partes reticulata and compacta (SNR, SNC)). Modification of coronal brain illustrations of Wood et al., 2001. b. Representative histological stainings of aSyn recorded at a 10× magnification (i-ii, iv-v) and confocal laser scanning macroscopy at 160× (iii, vi) in the cortex from female animals with PBS or SARS-CoV-2 infection at 6 and 21 dpi. Scale bar in widefield images = 200 μm, in confocal images = 10 μm. The viridis lookup table was used for the histological images to increase the visibility of expression changes. (c) Group mean of the normalized aSyn-IR per region in sex/infection groups demonstrating the general biphasic tendency of the aSyn response to infection. (d) Heatmaps of group mean normalized aSyn-IR per brain region in female and male animals in the three groups PBS, 6 dpi and 21 dpi. (e) Distribution of brain regions where PBS and SARS-CoV-2 groups differ significantly. Statistics: fishers exact test between male and female groups at 6 and 21 dpi. (f–g) Quantification of mean aSyn-IR in relevant regions for female (f) and male (g) hamsters. Data normalized to female and male PBS control group. Circles depict individual animals. The mean ± SEM is additionally shown. Mark the different scales on the y-axes. Mixed-effect analysis of aSyn-IR across brain regions in female (f) and male (g) hamsters evaluating effects of region and infection followed by a Dunnett's multiple comparisons test to evaluate infection effects within brain regions. Further information on Mixed-effect statistics can be found in Supplementary data file 1. Differences are depicted as ∗p < 0.05, ∗∗p < 0.01, ∗∗∗p < 0.001. Sample sizes are shown at the bottom of the groups in the graphs. No experimental outliers were excluded, group differences originate from apriori quality control.
Fig. 2
Fig. 2
Sex-specific microglial response following SARS-CoV-2 infection. (a) Representative histological stainings of Iba1+ myeloid cells at a 10× widefield magnification from cinglulate cortex of female (i-iv) and male (v-viii) animals with PBS or SARS-CoV-2 infection at 6 and 21 dpi. Right images are zoomed in versions of the left images. Scale bar = 200 μm for overview images and 50 μm for inset close-up images. The viridis lookup table was used for the histological images in the inset to increase the visibility of intensity differences. The overview images are depicted using a gray LUT to increase visibility of cell morphology. (b) Heatmaps of group mean normalized Iba1+ cell densities per brain region in female and male animals in the three groups (PBS, 6 dpi and 21 dpi). (c–j) Quantification of mean Iba1+ cell densities (normalized to female and male PBS mean) in relevant regions. Bars represent mean ± SEM, circles depict individual animals. Red: female, green: male. Mark the different scales on the y-axes. Statistics: Two-way ANOVA analysis of Iba1+ cells across sex and brain regions followed by Šídák's multiple comparisons test (PBS vs 6 dpi and PBS vs 21 dpi for each sex). Further information on 2way ANOVA statistics and sample sizes can be found in Supplementary data file 1. (p < 0.05, ∗p < 0.01, ∗∗∗p < 0.001, ∗∗∗∗p < 0.0001. No outliers excluded.
Fig. 3
Fig. 3
Heterogenous morphology of Iba1+ myeloid cells from female and male hamsters with SARS-CoV-2 infection. Confocal laser scanning microscopy was used to capture highly detailed Iba1+ cells for direct comparison between groups. One field is shown for females (i-viii) and males (ix-xvi) at both timepoints (6 and 21 dpi) following PBS or SARS-CoV-2 infection. Left images are confocal slices and right images are z-projections through a 40 μm brain slice. The viridis lookup table was used for the histological images to increase the visibility of instensity differences. Scale bars = 20 μm.
Fig. 4
Fig. 4
Derailing of calretinin immunoreactivity following SARS-CoV-2 infection. (a) Representative staining of Calretinin+ cells in the hamster cortex. Scale bar left 200 μm, right 50 μm. The magma lookup table was used for the histological images to increase the visibility of instensity differences. (b) Heatmaps of mean normalized Calretinin+ cell densities per brain region in PBS (=100%) and female and male animals at 21 dpi (region abbreviations: BLA: basolateral amygdala, CA1: hippocampus CA1 region, Cg: cingulate cortex, Cpu: caudate putamen, DG: hippocampus dentate gyrus, Hilus: hippocampus hilus region, M: motor cortex, PtA: parietal association cortex, RSA and RSG: retrosplenial cortex agranular and granular areas, S1: primary somatosensory cortex). (c–e) Calretinin+ cell density in the (c) BLA, (d) Cg and (e) RSG of female and male hamsters at 21 dpi. Data normalized to PBS control group. Bars represent mean ± SEM, circles depict individual animals. Mark the different scales on the y-axes. Statistics: Mann–Whitney U test was used to compare SARS-CoV-2 21 dpi vs PBS. Decimal numbers above columns are p values of trends. Significance levels above the bars: ∗p < 0.05. Sample sizes (from left to right): BLA: 8, 7, 13, 13; Cg: 14, 10, 14, 18; RSG: 13, 12, 15, 16. No outliers were excluded.
Fig. 5
Fig. 5
Derailing of parvalbumin immunoreactivity following SARS-CoV-2 infection. (a) Representative staining of Parvalbumin+ cells in the hamster cortex. Scale bar left 200 μm, right 50 μm. The magma lookup table was used for the histological images to increase the visibility of instensity differences. (b) Heatmaps of mean normalized Parvalbumin+ cell densities per brain region in PBS (=100%) and female and male animals at 21 dpi (region abbreviations: BLA: basolateral amygdala, CA1: hippocampus CA1 region, Cg: cingulate cortex, Cpu: caudate putamen, DG: hippocampus dentate gyrus, Hilus: hippocampus hilus region, M: motor cortex, PtA: parietal association cortex, RSA and RSG: retrosplenial cortex agranular and granular areas, S1: primary somatosensory cortex). (c–g) Parvalbumin+ cell density in the (c) Cg, (d) S1, (e) Cpu, (f) RSG and (g) PtA of female and male hamsters at 21 dpi. Data normalized to PBS control group. Bars represent mean ± SEM, circles depict individual animals. Mark the different scales on the y-axes. Statistics: Mann–Whitney U test was used to compare SARS-CoV-2 21 dpi vs PBS. Decimal numbers above columns are p values of trends. Significance levels above the bars: ∗p < 0.05. Sample sizes: Cg: 14, 10, 14, 18; S1: 14, 13, 14, 18; Cpu: 14, 13, 16, 16; RSG: 13, 12, 15, 16; PtA: 10, 8, 13, 17. No outliers were excluded.
Fig. S1
Fig. S1
Fig. S2
Fig. S2
Fig. S3
Fig. S3
Fig. S4
Fig. S4
Fig. S5
Fig. S5
Fig. S6
Fig. S6
Fig. S7
Fig. S7
Fig. S8
Fig. S8
Fig. S9
Fig. S9

Similar articles

Cited by

References

    1. Khatoon F., Prasad K., Kumar V. Neurological manifestations of COVID-19: available evidences and a new paradigm. J Neurovirol. 2020;26(5):619–630. - PMC - PubMed
    1. Xu E., Xie Y., Al-Aly Z. Long-term neurologic outcomes of COVID-19. Nat Med. 2022;28(11):2406–2415. - PMC - PubMed
    1. Abdullahi A., Candan S.A., Abba M.A., et al. Neurological and musculoskeletal features of COVID-19: a systematic review and meta-analysis. Front Neurol. 2020;11:687. - PMC - PubMed
    1. Mao L., Jin H., Wang M., et al. Neurologic manifestations of hospitalized patients with coronavirus disease 2019 in wuhan, China. JAMA Neurol. 2020;77(6):683–690. - PMC - PubMed
    1. Brola W., Wilski M. Neurological consequences of COVID-19. Pharmacol Rep. 2022;74(6):1208–1222. - PMC - PubMed

Substances