

A scalable and robust variance components method reveals insights into the architecture of gene-environment interactions underlying complex traits
- PMID: 38866020
- PMCID: PMC11267529
- DOI: 10.1016/j.ajhg.2024.05.015
A scalable and robust variance components method reveals insights into the architecture of gene-environment interactions underlying complex traits
Abstract
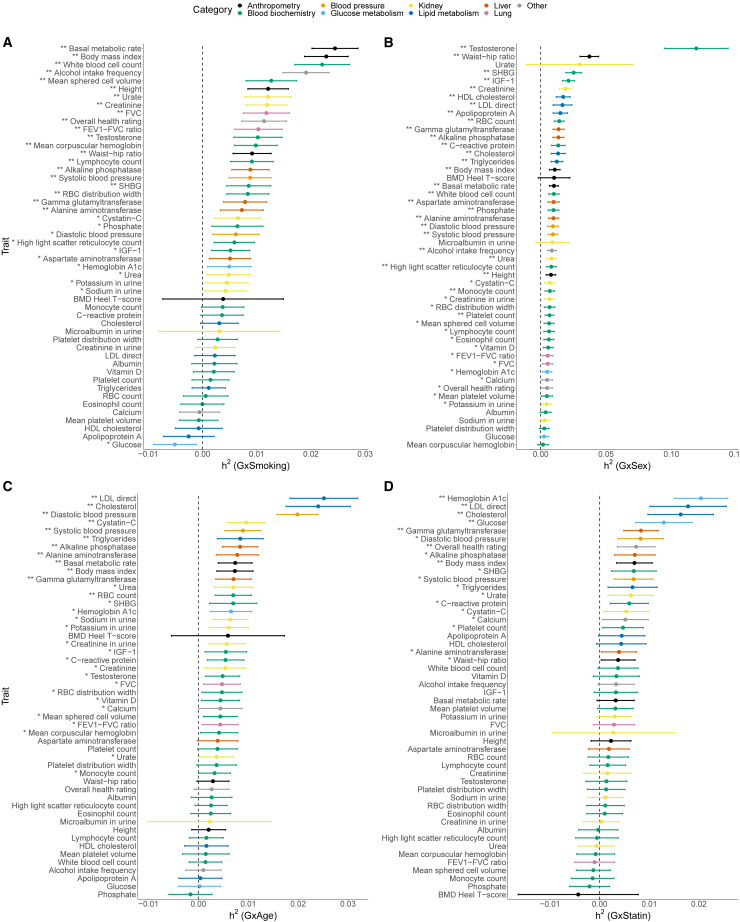
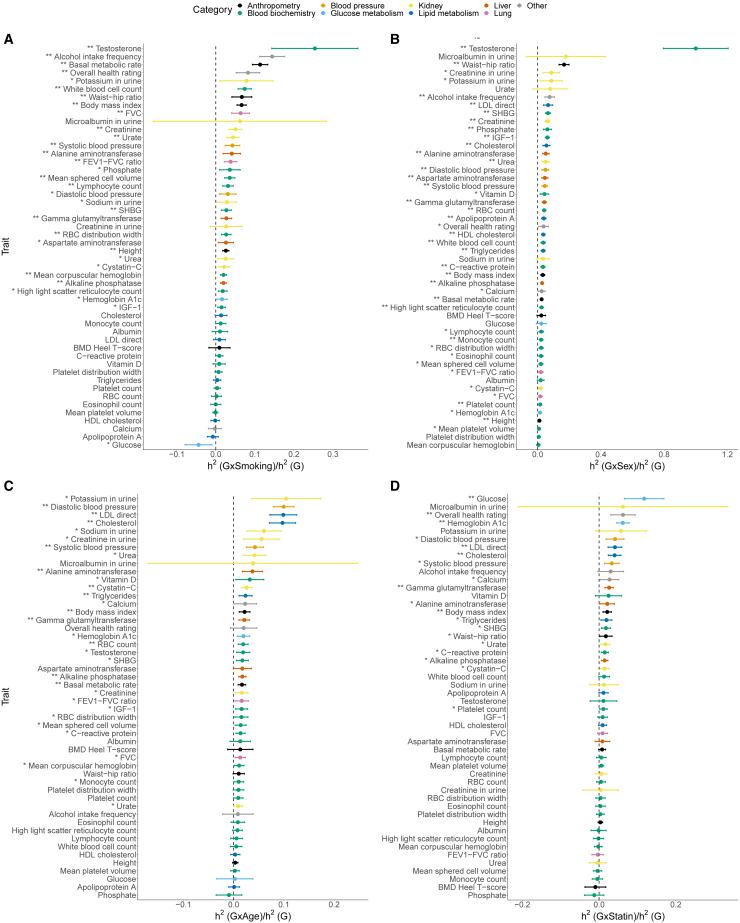
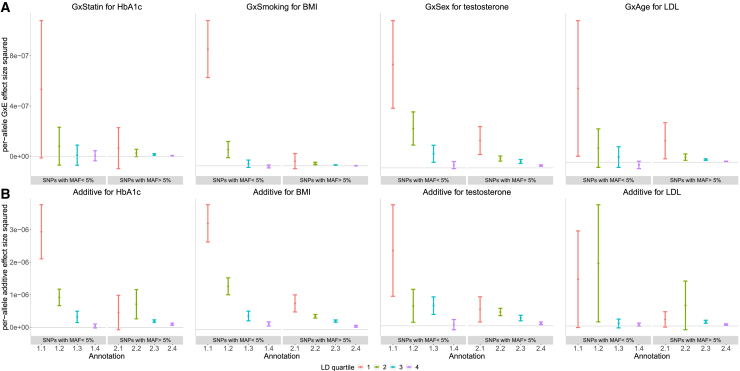
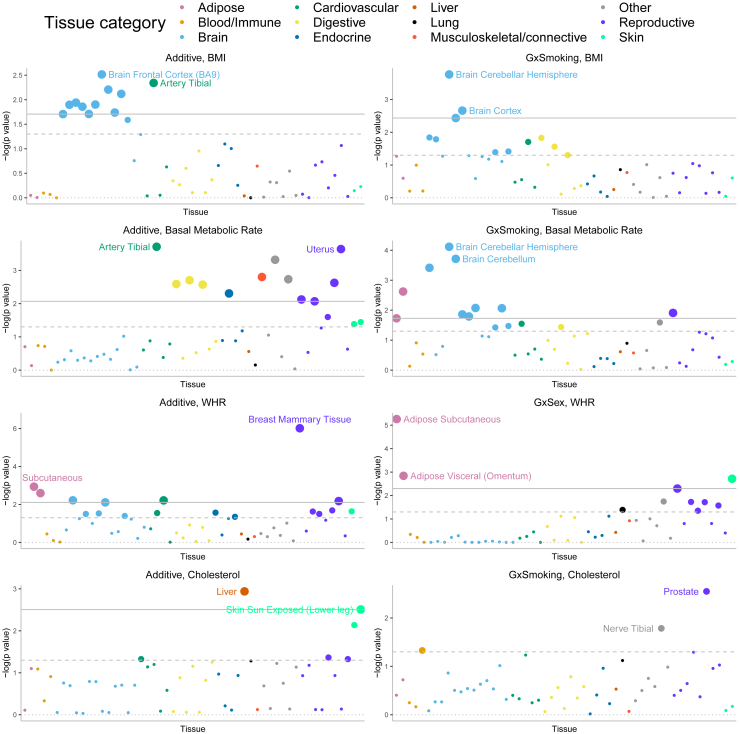
Understanding the contribution of gene-environment interactions (GxE) to complex trait variation can provide insights into disease mechanisms, explain sources of heritability, and improve genetic risk prediction. While large biobanks with genetic and deep phenotypic data hold promise for obtaining novel insights into GxE, our understanding of GxE architecture in complex traits remains limited. We introduce a method to estimate the proportion of trait variance explained by GxE (GxE heritability) and additive genetic effects (additive heritability) across the genome and within specific genomic annotations. We show that our method is accurate in simulations and computationally efficient for biobank-scale datasets. We applied our method to common array SNPs (MAF ≥1%), fifty quantitative traits, and four environmental variables (smoking, sex, age, and statin usage) in unrelated white British individuals in the UK Biobank. We found 68 trait-E pairs with significant genome-wide GxE heritability (p<0.05/200) with a ratio of GxE to additive heritability of ≈6.8% on average. Analyzing ≈8 million imputed SNPs (MAF ≥0.1%), we documented an approximate 28% increase in genome-wide GxE heritability compared to array SNPs. We partitioned GxE heritability across minor allele frequency (MAF) and local linkage disequilibrium (LD) values, revealing that, like additive allelic effects, GxE allelic effects tend to increase with decreasing MAF and LD. Analyzing GxE heritability near genes highly expressed in specific tissues, we find significant brain-specific enrichment for body mass index (BMI) and basal metabolic rate in the context of smoking and adipose-specific enrichment for waist-hip ratio (WHR) in the context of sex.
Keywords: UK Biobank; complex traits; gene-context interaction; gene-drug interaction; gene-environment interaction; genetic architecture of gene-environment interactions; noise heterogeneity; patitioning GxE heritability; scalable variance component analysis.
Copyright © 2024 The Authors. Published by Elsevier Inc. All rights reserved.
Conflict of interest statement
Declaration of interests The authors declare no competing interests.
Figures
Update of
-
A scalable and robust variance components method reveals insights into the architecture of gene-environment interactions underlying complex traits.bioRxiv [Preprint]. 2023 Dec 13:2023.12.12.571316. doi: 10.1101/2023.12.12.571316. bioRxiv. 2023. Update in: Am J Hum Genet. 2024 Jul 11;111(7):1462-1480. doi: 10.1016/j.ajhg.2024.05.015. PMID: 38168200 Free PMC article. Updated. Preprint.
Similar articles
-
Distinct explanations underlie gene-environment interactions in the UK Biobank.Am J Hum Genet. 2025 Mar 6;112(3):644-658. doi: 10.1016/j.ajhg.2025.01.014. Epub 2025 Feb 17. Am J Hum Genet. 2025. PMID: 39965571
-
A scalable and robust variance components method reveals insights into the architecture of gene-environment interactions underlying complex traits.bioRxiv [Preprint]. 2023 Dec 13:2023.12.12.571316. doi: 10.1101/2023.12.12.571316. bioRxiv. 2023. Update in: Am J Hum Genet. 2024 Jul 11;111(7):1462-1480. doi: 10.1016/j.ajhg.2024.05.015. PMID: 38168200 Free PMC article. Updated. Preprint.
-
Quantifying the contribution of dominance deviation effects to complex trait variation in biobank-scale data.Am J Hum Genet. 2021 May 6;108(5):799-808. doi: 10.1016/j.ajhg.2021.03.018. Epub 2021 Apr 2. Am J Hum Genet. 2021. PMID: 33811807 Free PMC article.
-
Open problems in human trait genetics.Genome Biol. 2022 Jun 20;23(1):131. doi: 10.1186/s13059-022-02697-9. Genome Biol. 2022. PMID: 35725481 Free PMC article. Review.
-
Estimation and partition of heritability in human populations using whole-genome analysis methods.Annu Rev Genet. 2013;47:75-95. doi: 10.1146/annurev-genet-111212-133258. Epub 2013 Aug 22. Annu Rev Genet. 2013. PMID: 23988118 Free PMC article. Review.
Cited by
-
fastGxE: Powering genome-wide detection of genotype-environment interactions in biobank studies.Res Sq [Preprint]. 2025 Mar 20:rs.3.rs-5952773. doi: 10.21203/rs.3.rs-5952773/v1. Res Sq. 2025. PMID: 40166017 Free PMC article. Preprint.
-
Distinct explanations underlie gene-environment interactions in the UK Biobank.Am J Hum Genet. 2025 Mar 6;112(3):644-658. doi: 10.1016/j.ajhg.2025.01.014. Epub 2025 Feb 17. Am J Hum Genet. 2025. PMID: 39965571
-
Gene-environment interactions contribute to blood pressure variation across global populations.medRxiv [Preprint]. 2025 Jul 3:2025.07.02.25330727. doi: 10.1101/2025.07.02.25330727. medRxiv. 2025. PMID: 40630594 Free PMC article. Preprint.
-
Characterizing the genetic architecture of drug response using gene-context interaction methods.Cell Genom. 2024 Dec 11;4(12):100722. doi: 10.1016/j.xgen.2024.100722. Epub 2024 Dec 4. Cell Genom. 2024. PMID: 39637863 Free PMC article.
-
Polygenic scores capture genetic modification of the adiposity-cardiometabolic risk factor relationship.medRxiv [Preprint]. 2025 Apr 10:2025.04.09.25324066. doi: 10.1101/2025.04.09.25324066. medRxiv. 2025. PMID: 40297446 Free PMC article. Preprint.
References
-
- Robinson M.R., English G., Moser G., Lloyd-Jones L.R., Triplett M.A., Zhu Z., Nolte I.M., van Vliet-Ostaptchouk J.V., Snieder H., et al. LifeLines Cohort Study Genotype–covariate interaction effects and the heritability of adult body mass index. Nat. Genet. 2017;49:1174–1181. - PubMed
MeSH terms
Grants and funding
LinkOut - more resources
Full Text Sources
Research Materials
