. 2024 Aug;632(8024):350-356.
doi: 10.1038/s41586-024-07661-0. Epub 2024 Jun 12.

Interactions between immune cell types facilitate the evolution of immune traits

Affiliations

Interactions between immune cell types facilitate the evolution of immune traits

Tania Dubovik et al. Nature. 2024 Aug.

Abstract

An essential prerequisite for evolution by natural selection is variation among individuals in traits that affect fitness1. The ability of a system to produce selectable variation, known as evolvability2, thus markedly affects the rate of evolution. Although the immune system is among the fastest-evolving components in mammals3, the sources of variation in immune traits remain largely unknown4,5. Here we show that an important determinant of the immune system's evolvability is its organization into interacting modules represented by different immune cell types. By profiling immune cell variation in bone marrow of 54 genetically diverse mouse strains from the Collaborative Cross6, we found that variation in immune cell frequencies is polygenic and that many associated genes are involved in homeostatic balance through cell-intrinsic functions of proliferation, migration and cell death. However, we also found genes associated with the frequency of a particular cell type that are expressed in a different cell type, exerting their effect in what we term cyto-trans. The vertebrate evolutionary record shows that genes associated in cyto-trans have faced weaker negative selection, thus increasing the robustness and hence evolvability2,7,8 of the immune system. This phenomenon is similarly observable in human blood. Our findings suggest that interactions between different components of the immune system provide a phenotypic space in which mutations can produce variation with little detriment, underscoring the role of modularity in the evolution of complex systems9.


Conflict of interest statement

S.S.O. holds equity and is a consultant of CytoReason and holds an unpaid position with the Human Immunome Project. T.D., E.S. and Y.A., are employees and hold equity in CytoReason. R.N holds equity in CytoReason.

Figures

Fig. 1
Fig. 1. Immune cell profiles are highly variable across CC mouse strains.
a, Schematic of the experimental approach. The genome of CC recombinant strains was reconstructed at each locus based on single-nucleotide polymorphism (SNP) chip data and the genomes of the eight founder strains; immune cell frequencies were quantified by mass cytometry; the association of variants with immune cell type frequency was then quantified. b, Swarm-plot of frequencies of selected immune cell types from both CC founder strains and CC recombinant inbred strains used for the association study. Cell frequency is shown as a fraction of total live bone marrow cells. Founder strains are ordered according to median frequency for each cell subset; see Extended Data Fig. 1a for plots of all immune cell types assayed. c, Strip-plot of pairwise distances in principal component analysis (PCA) space between immune profiles within the respective categories. PCA was computed using the immune profiles for all measured animals that had all target cell types detected (n = 42); the Euclidean distance in the space defined by the first two PC (Extended Data Fig. 1b) is shown for all pairs within the respective categories. Boxplots denote median, first and third quartiles. P values for two-sided t-test are shown. SNP chip created with Adobe Stock (https://stock.adobe.com).
Fig. 2
Fig. 2. Regulation of the frequency of immune cell types in bone marrow is polygenic and related to quantitative homeostatic balance.
a, Manhattan plot for associated loci. Coloured dots denote cell type with which genes were found associated based on significance threshold set according to FDR for each population separately; grey dots denote genes with an association below this threshold. Associated loci that did not pass validation by the second cohort are not shown. b, Circular heatmap of associations between genes and immune cell types. Black denotes association, grey denotes no association determined. Genes are clustered according to their association profile across cell types. Cell types are indicated on each ring (CD4+, CD4+ T cells; CD8+, CD8+ T cells; GN, granulocytes; MO, monocytes); for NK cells no associations were determined. c, Functional enrichment of genes associated with the assayed immune traits as determined by ingenuity pathway analysis (IPA). Related functional terms were manually grouped and, for each group, the term with the lowest adjusted P value is shown; for details on grouping of terms see Extended Data Fig. 3b. One-sided Fisher’s exact test with Benjamini–Hochberg correction was applied. d, Number of genes associated with selected homeostatic functions.
Fig. 3
Fig. 3. Genes associated with frequency of specific immune cell types are frequently not expressed in the associated cell type.
a, Schematic of the definition of a genetic association acting in cyto-cis or cyto-trans. A gene associated in cyto-cis is expressed in the cell type of the phenotype with which it is associated; conversely, a cyto-trans gene is not expressed in the associated cell type but rather in a different cell type. b, Example of data used to classify associations as cyto-cis or cyto-trans. Gene expression was determined by ImmGen consortium, and LOD scores for association with immune cell frequencies are shown for the selected gene, Arhgef37. Black dashed vertical line indicates gene expression threshold used for binarization of gene expression, and asterisks denote significant associations as determined by a permutation test (Methods). Coloured dashed rectangles highlight associations in cyto-cis and cyto-trans. c, Bar plot showing the number of genes associated in cyto-cis or cyto-trans for each respective cell type. Cell types are ordered by increasing proportion of cyto-trans associations. d, Split Circos plot depicting expression of genes associated with immune cell frequencies in cyto-trans. The colour of connecting lines is determined by the cell type with which the gene is associated; the colour of the rim on the left-hand side corresponds to the cell type in which the gene is expressed. For associated genes expressed in multiple cell types, multiple lines are shown. a.u., arbitrary units.
Fig. 4
Fig. 4. Genes with cyto-trans associations facilitate the evolution of immune traits.
a, Empirical cumulative distribution functions for amino acid conservation scores of genes grouped by whether they were found to be associated with immune cell frequencies in only cyto-cis or also in cyto-trans. P value for one-sided Kolmogorov–Smirnov test between these two groups is shown. Cumulative distributions of evolutionary conservation for immune genes considered in this study (Methods) and for non-immune genes in the mouse genome are shown for comparison in grey. b, As in a, except that genes are categorized according to whether they are associated with more than one immune cell type. c, As in a, except that only genes associated with frequencies of multiple immune cell types are considered. d, Empirical cumulative distribution functions for amino acid conservation scores of genes found to be associated with immune cell (neutrophil, monocyte, lymphocyte, basophil, eosinophil) frequencies in human blood,. Genes are grouped by whether they were found to be associated with immune cell frequencies only in cyto-cis or also in cyto-trans (Methods). P value for one-sided Kolmogorov–Smirnov test is shown.
Extended Data Fig. 1
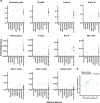
Extended Data Fig. 1. Immune cell frequencies of CC parent and recombinant strains used in the exploratory part of the association study.
a. Swarm plots of bone marrow immune cell frequencies, profiled using mass cytometry. Parent strains are ordered according to the median value for each of the immune cell subsets. b. Principal component analysis using immune cell frequencies of all mice measured in the first cohort, for which all target cell types could be detected. The first two principal components are shown.
Extended Data Fig. 2
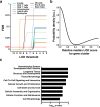
Extended Data Fig. 2. Genetic associations of immune cell frequencies.
a. False discovery rate (FDR) as a function of threshold for association as inferred from permutation analysis (Methods) for each cell type. Red dashed line indicates the FDR of 5% used to determine the cell type-specific LOD score threshold used to find associated genes in the exploratory cohort. b. Distribution of relative median LOD scores for gene clusters during signal propagation. Genes found significantly associated to at least immune cell type were clustered based on their pattern of association across all the assayed cell types. For each cluster, median LOD score for each cell type was calculated and then divided by the maximum value of this quantity across all cell types. The distribution of the resulting values is plotted, with two clear peaks – all gene cluster-cell type pairs with median LOD score above 0.4 were considered associated. c. Bar-plot of functionally enriched categories. Functional groups that were found enriched using Ingenuity Pathway Analysis; terms with p < 0.05 are shown. x-axis indicates -log10 of p-value from one-sided Fisher’s exact test.
Extended Data Fig. 3
Extended Data Fig. 3. Analysis of cyto-trans associations.
a. Circular heatmap of associations between genes and immune cell types, classified according to expression in the respective cell type. Genes are clustered according to their association profile across cell types. Cell types are indicated on each ring (CD4+ – CD4+ T cells, CD8+ – CD8+ T cells, GN – Granulocytes, MO – monocytes). b. Bar-plot of functionally enriched categories in cyto-trans genes relative to all associated genes. Functional groups that were found enriched using Ingenuity Pathway Analysis (see Methods for details), terms with p < 0.05 are shown. x-axis indicates -log10 of p-value from one-sided Fisher’s exact test. c. Empirical cumulative distribution functions for amino acid conservation scores of genes found associated with a single immune cell type in this study, grouped by whether they were found associated in cyto-cis or in cyto-trans. P-value for one-sided Kolmogorov-Smirnov test between these two groups is stated.
Extended Data Fig. 4
Extended Data Fig. 4. Evolutionary conservation of genes associated with immune cell frequencies in the human blood.
a. As in Fig. 4d. Empirical cumulative distribution functions for amino acid conservation scores of genes found associated with immune cell frequencies in the human blood by previous studies. Genes are grouped by whether they were found associated with immune cell frequencies only in cyto-cis or also in cyto-trans (Methods). b. As in (a), except genes are categorised according to whether or not they are associated to more than one immune cell type or not. c. As in (a), except only genes associated with frequencies of a single immune cell type are considered d. As in (a), except only genes associated with frequencies of multiple immune cell types are considered. P-values for one-sided Kolmogorov-Smirnov test are stated.

Similar articles

Cited by

References

    1. Darwin, C. On the Origins of Species by Means of Natural Selection (Murray, 1859).
    1. Payne, J. L. & Wagner, A. The causes of evolvability and their evolution. Nat. Rev. Genet.20, 24–38 (2019). - PubMed
    1. Shultz, A. J. & Sackton, T. B. Immune genes are hotspots of shared positive selection across birds and mammals. eLife8, e41815 (2019). - PMC - PubMed
    1. Liston, A., Humblet-Baron, S., Duffy, D. & Goris, A. Human immune diversity: from evolution to modernity. Nat. Immunol.22, 1479–1489 (2021). - PubMed
    1. Brodin, P. & Davis, M. M. Human immune system variation. Nat. Rev. Immunol.17, 21–29 (2017). - PMC - PubMed

LinkOut - more resources