. 2024 Jul 3;11(7):ENEURO.0330-23.2024.
doi: 10.1523/ENEURO.0330-23.2024. Print 2024 Jul.

The Lack of Synapsin Alters Presynaptic Plasticity at Hippocampal Mossy Fibers in Male Mice

Affiliations

The Lack of Synapsin Alters Presynaptic Plasticity at Hippocampal Mossy Fibers in Male Mice

Felicitas Bruentgens et al. eNeuro. .

Erratum in

Abstract

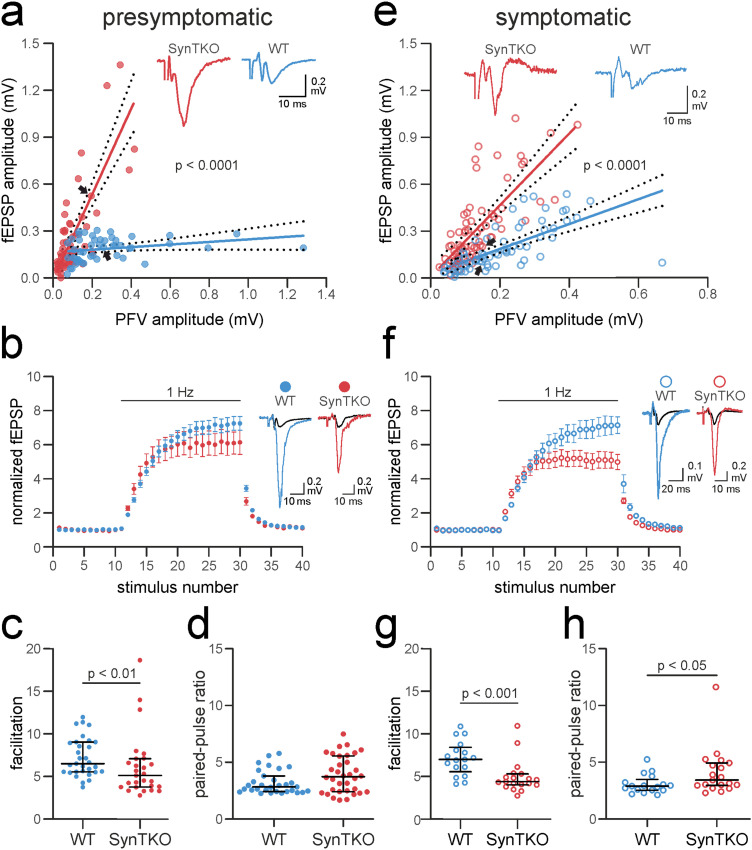
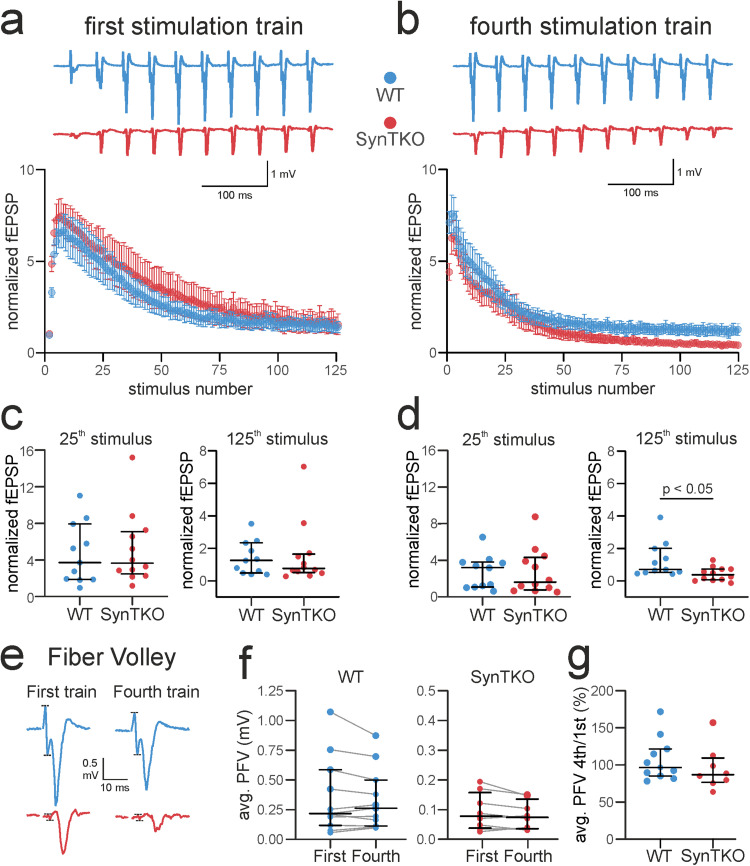
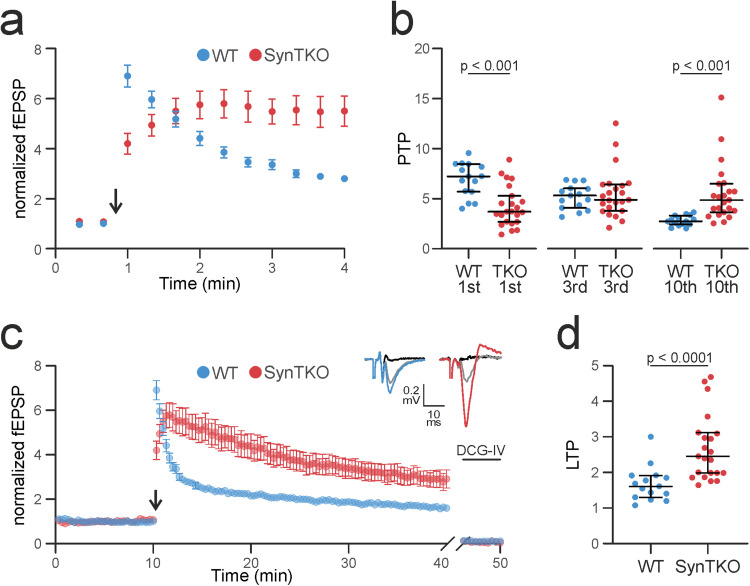
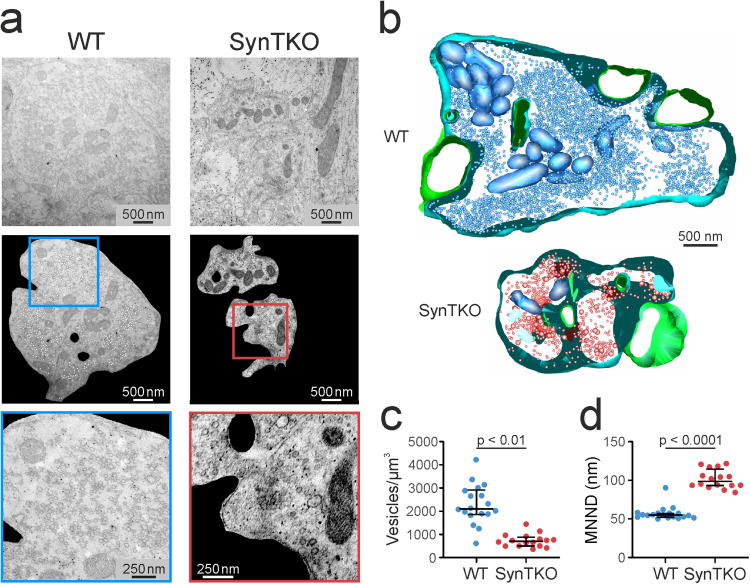
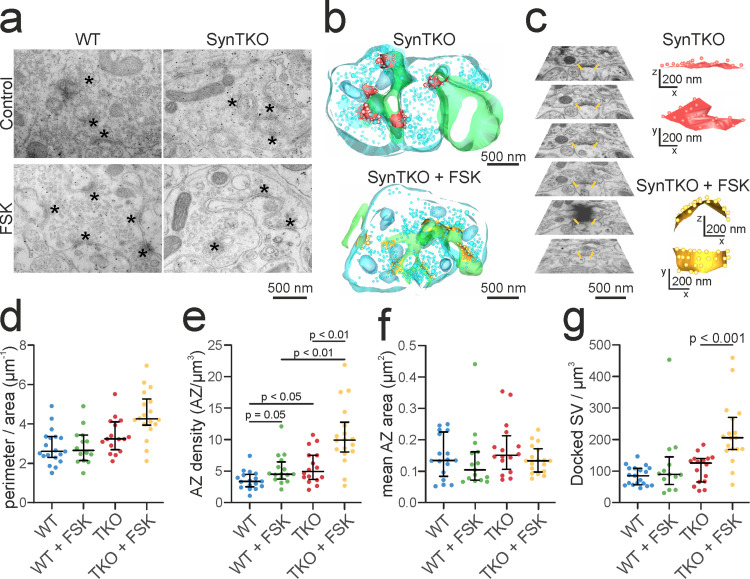
Synapsins are highly abundant presynaptic proteins that play a crucial role in neurotransmission and plasticity via the clustering of synaptic vesicles. The synapsin III isoform is usually downregulated after development, but in hippocampal mossy fiber boutons, it persists in adulthood. Mossy fiber boutons express presynaptic forms of short- and long-term plasticity, which are thought to underlie different forms of learning. Previous research on synapsins at this synapse focused on synapsin isoforms I and II. Thus, a complete picture regarding the role of synapsins in mossy fiber plasticity is still missing. Here, we investigated presynaptic plasticity at hippocampal mossy fiber boutons by combining electrophysiological field recordings and transmission electron microscopy in a mouse model lacking all synapsin isoforms. We found decreased short-term plasticity, i.e., decreased facilitation and post-tetanic potentiation, but increased long-term potentiation in male synapsin triple knock-out (KO) mice. At the ultrastructural level, we observed more dispersed vesicles and a higher density of active zones in mossy fiber boutons from KO animals. Our results indicate that all synapsin isoforms are required for fine regulation of short- and long-term presynaptic plasticity at the mossy fiber synapse.

Keywords: hippocampal mossy fibers; presynaptic plasticity; presynaptic potentiation; synapsin; synaptic transmission; synaptic vesicles.


Conflict of interest statement

The authors declare no competing financial interests.

Figures

Figure 1.
Figure 1.
Increased excitability, but reduced facilitation, at mossy fibers of presymptomatic and symptomatic SynTKO mice. a, Excitability was increased in brain slices from presymptomatic SynTKO mice (red, 37 slices from 13 animals) compared with WT mice (blue, 31 slices from 12 animals). Pooled fEPSP amplitudes (mV) were plotted against pooled PFV amplitudes (mV) and fitted with a simple linear regression. The slopes of the linear regressions were significantly different (p < 0.0001, tested with a two-tailed ANCOVA). The 95% confident bands are shown as dotted lines around the fit. The black arrows indicate the data points corresponding to the example traces shown in the inset. Inset, Example traces from WT (blue) and SynTKO (red) slices with similar PFV amplitudes. Note the difference in the corresponding fEPSP amplitude. b, c, Frequency facilitation is reduced in presymptomatic SynTKO (red) compared with WT (blue) slices. b, Averaged normalized fEPSP amplitudes ± SEM from all WT (blue, 31 slices from 12 animals) and SynTKO (red, 27 slices from 9 animals) recordings plotted against the number of stimuli. Stimuli 1–10 were given with a frequency of 0.05  Hz, Stimuli 11–30 with 1  Hz, and Stimuli 31–41 with a frequency of 0.05  Hz again. Both time and the interaction between genotype and time were significantly different in a mixed-effect model (p < 0.0001; p < 0.001). Post hoc Sidak’s test for multiple comparisons revealed no significant differences. Right, Example fEPSP amplitudes from WT (blue) and SynTKO (red) recordings at the 20th 1  Hz stimulus. Respective baseline fEPSP amplitudes are shown in black. c, fEPSP amplitudes at the 20th stimulus at 1  Hz for individual WT (blue dots; 31 slices from 12 animals) and SynTKO (red dots; 27 slices from 9 animals) recordings. Median values ± interquartile ranges are shown in black. Facilitation was significantly different (p = 0.0089; Mann–Whitney U test). d, PPR for presymptomatic SynTKO and age-matched control animals. Dots represent PPR from individual recordings from WT (blue dots, 31 slices from 12 animals) and SynTKO (red dots, 34 slices from 12 animals) slices, calculated as the ratio of second to first fEPSP amplitude. The interstimulus interval was 50  ms. Median values ± interquartile ranges are depicted in black. Ranks were compared in a Mann–Whitney U test and were not significantly different (p = 0.133). e, Excitability was increased in recordings from symptomatic SynTKO mice (red; 18 slices from 5 animals) compared with WT mice (blue; 17 slices from 4 animals). Pooled fEPSP amplitudes (mV) were plotted against pooled PFV amplitudes (mV) and fitted with a simple linear regression. The slopes of the linear regressions were significantly different (p < 0.0001, tested with a two-tailed ANCOVA). The 95% confidence bands are shown as dotted lines around the fit. Inset, Example traces from WT (blue) and SynTKO (red) animals with similar PFV amplitudes. Note the difference in the corresponding fEPSP amplitude. f, g, Frequency facilitation was reduced in symptomatic SynTKO (red) compared with WT (blue) animals. f, Averaged normalized fEPSP amplitudes ± SEM from all WT (blue; 17 slices from 4 animals) and SynTKO (red; 19 slices from 5 animals) recordings plotted against the number of stimuli. Stimuli 1–10 were given with a frequency of 0.05  Hz, Stimuli 11–30 with 1  Hz, and Stimuli 31–41 with a frequency of 0.05  Hz again. Both time and the interaction between genotype and time were significantly different in a mixed-effect model (p < 0.0001). Post hoc Sidak’s test for multiple comparisons revealed significant differences (p < 0.05) for two time points. Right, Example fEPSP amplitudes from WT (blue) and SynTKO (red) animals at the 20th 1  Hz stimulus. Respective baseline fEPSP amplitudes are shown in gray. g, fEPSP amplitudes at the 20th stimulus at 1  Hz for individual WT (blue dots, 17 slices from 4 animals) and SynTKO (red dots, 19 slices from 5 animals) recordings. Median values ± interquartile ranges are shown in black. Facilitation was significantly different (p = 0.0009; tested with Mann–Whitney U test). h, PPR for symptomatic SynTKO and age-matched control animals. Top, Example traces for a paired-pulse from WT (dark blue) and SynTKO (dark red) recordings, respectively. Bottom, Dots represent PPR from individual recordings from WT (dark blue dots, 17 slices from 4 animals) and SynTKO (dark red dots, 19 slices from 5 animals) slices, calculated as the ratio of second to first fEPSP amplitude. The interstimulus interval was 50  ms. Median values ± interquartile ranges are depicted in black. Ranks were compared in a Mann–Whitney U test and were significantly different (p = 0.0325).
Figure 2.
Figure 2.
Faster depression during high-frequency stimulation in SynTKO mice. High-frequency stimulation comprised four trains of 125 pulses at 25  Hz with an interval of 20  s between the first stimuli of consecutive trains. a, Top, Example traces show fEPSP amplitudes of mossy fibers from WT (blue) and SynTKO (red) slices in response to the first 10 stimuli of the first high-frequency stimulation train. Bottom, Normalized averaged fEPSP amplitudes plotted against the number of stimuli of the first high-frequency stimulation train for WT (blue, 11 slices from 5 animals) and SynTKO (red, 12 slices from 6 animals) recordings. A mixed-effect model revealed no significant difference between genotypes (p = 0.59), but significant differences (p < 0.0001) for the factor time (stimulus). A post hoc Sidak’s test for multiple comparisons revealed no significant differences for single time points. b, Top, Example traces show fEPSP amplitudes of WT (blue) and SynTKO (red) animals in response to the first 10 stimuli of the fourth high-frequency stimulation train. Bottom, Normalized averaged fEPSP amplitudes plotted against number of stimuli of the first high-frequency stimulation train for WT (blue, 11 slices from 5 animals) and SynTKO (red, 12 slices from 6 animals) animals. The factor time (stimulus) was significantly different in a mixed-effect model (p < 0.0001), while the genotype and the interaction of both were not (p = 0.22 and p > 0.99). A post hoc Sidak’s test for multiple comparisons revealed no significant differences for single time points. c, Normalized fEPSP amplitudes at the 25th and 125th stimulus of the first stimulation train for individual WT (blue dots, 11 slices from 5 animals) and SynTKO (red dots, 12 slices from 6 animals) recordings. Median values ± interquartile ranges are shown in black. Ranks were not significantly different for either 25th (p = 0.695; Mann–Whitney U test) or 125th stimulus (p = 0.74, Mann–Whitney U test). d, Normalized fEPSP amplitudes at the 25th and 125th stimulus of the fourth stimulation train for individual WT (blue dots, 11 slices from 5 animals) and SynTKO (red dots, 12 slices from 6 animals) recordings. Median values ± interquartile ranges are shown in black. Ranks were significantly different at the 125th stimulus (p = 0.032; Mann–Whitney U test), but not at the 25th stimulus (p = 0.88; Mann–Whitney U test). e, The loss of fibers during high-frequency stimulation is not substantial and similar for SynTKO and WT mice. Exemplary traces from high-frequency stimulation trains for WT (blue) and SynTKO (red) animals. The 10th PFV and fEPSP from the first and fourth stimulation train are depicted, respectively. Dotted lines indicate the peaks of the PFV. Note that although the PFV is smaller for SynTKO (due to technical reasons in response to the high excitability), the size is relatively consistent throughout the trains. f, Averaged PFV (mV) taken from 10–15 pulses from the first and fourth stimulation train, respectively, for recordings from WT (blue, 11 slices from 5 animals) and SynTKO (red, 12 slices from 6 animals) slices. Average values from the same recording are connected. Median values and interquartile ranges are depicted in black. Ranks between first and fourth stimulation train were not significantly different for neither WT (p = 0.36) nor SynTKO (p = 0.08) recordings, compared in a Wilcoxon test. g, The relative loss of fibers was similar for WT and SynTKO recordings. Averaged ratios between fourth and first train PFV sizes are depicted for both WT (blue, 11 slices from 5 animals) and SynTKO (red, 12 slices from 6 animals) animals. Median values and interquartile ranges are depicted in black. Ranks were not significantly different (p = 0.24) in a Mann–Whitney U test.
Figure 3.
Figure 3.
SynTKO mossy fibers display reduced post-tetanic potentiation but increased long-term potentiation. a, Post-tetanic potentiation is decreased in SynTKO mossy fibers. Normalized averaged fEPSP amplitudes plotted against time (min) from WT (blue, 15 slices from 6 animals) and SynTKO (red, 23 slices from 9 animals) recordings. This plot is a partial zoom-in from the plot shown in c (9–13  min). Mean values ± SEM are shown. The arrow indicates the time point of high-frequency stimulation (4 times 125 pulses at 25  Hz). Stimulation before and after was at 0.05  Hz. Statistics for dataset as reported in c. b, Scatterplots for individual fEPSP amplitudes for WT (blue) and SynTKO (red) recordings for the 1st, 3rd, and 10th stimulus after high-frequency stimulation, respectively. Median values ± interquartile ranges are shown in black. The significance was tested with a Kruskal–Wallis test and a post hoc Dunn’s correction for multiple comparisons. The Kruskal–Wallis test revealed significant differences between ranks with p < 0.0001. Multiple comparisons revealed significant differences for the 1st (p = 0.0003) and 10th (p = 0.0002) time point. c, LTP is increased in SynTKO animals after 30  min. Top, Example traces of fEPSP amplitudes 30  min after high-frequency stimulation for mossy fibers from WT (blue, left) and TKO (red, right) mice compared with baseline fEPSP amplitude (gray) and response to 1  µM DCG-IV (black). Bottom, Normalized averaged fEPSP amplitudes plotted over time (min) from WT (blue, 15 slices from 6 animals) and SynTKO (red, 23 slices from 9 animals) recordings. Mean values ± SEM are shown. The arrow indicates the high-frequency stimulation (4 times 125 pulses at 25  Hz). Stimulation frequency before (baseline) and after (LTP recording) was 0.05  Hz. At the end of the recording, 1  µM DCG-IV was washed in to ensure mossy fiber specificity. The last 10 fEPSP amplitudes during DCG-IV wash-in are shown at the end of the recording. A mixed-effect model revealed significant differences for the genotype (p = 0.005), time (p < 0.0001), and the interaction of both (p < 0.0001). A post hoc Sidak’s test for multiple comparisons revealed significant differences for the first sweep after high-frequency stimulation (p = 0.0125) and Sweeps 38 (p < 0.05) and Sweeps 40–54 (p < 0.05; ∼14–18  min), as well as for Sweeps 61, 67, and 94 (p < 0.05; ∼20, 22, and 32  min). d, Dots indicate averaged fEPSP amplitudes from individual WT (blue) and SynTKO (red) recordings. Amplitudes were averaged over the last 10  min of the LTP recording; from 20 to 30  min after high-frequency stimulation. Median values ± interquartile ranges are shown in black. Ranks were significantly different with p < 0.0001 (Mann–Whitney U test).
Figure 4.
Figure 4.
Synaptic vesicles are more dispersed in mossy fiber boutons from SynTKO mice. a, In mossy fiber boutons, synaptic vesicles are more dispersed, and their density is reduced. Example images from TEM showing mossy fiber boutons from WT (left) and SynTKO (right) animals. Top, Raw TEM images of mossy fiber boutons in stratum lucidum. Middle, An automated tool (eImbrosci et al., 2022) was used to detect vesicles. Mossy fiber boutons were extracted from the raw image, and the center of detected vesicles is marked with a white dot. Blue and red boxes show the region for the zoom-ins in WT and SynTKO, respectively. Bottom, Zoom-ins, as marked in the middle pictures. High-magnification images of mossy fiber boutons from a WT and a SynTKO animal, respectively. Note the reduced abundance of synaptic vesicles in the SynTKO bouton. b, Partial 3D reconstruction of hippocampal mossy fiber boutons from a WT (top) and a SynTKO animal (bottom) for visualization purposes only. Vesicles are shown in blue and red, respectively, the presynaptic mossy fiber membrane is shown in light blue, and postsynaptic spines are shown in green. c, The number of synaptic vesicles per cubic micrometer is reduced in SynTKO animals. Dots represent the number of vesicles in individual mossy fiber boutons from three WT (blue, 18 boutons) and three SynTKO (red, 16 boutons) animals. Median values and interquartile ranges are shown in black. A generalized linear mixed model revealed significant differences between genotypes with p = 0.0015. d, The MNND is increased between synaptic vesicles in SynTKO compared with those in WT boutons. The scatterplot shows average MNND (nm) for individual mossy fiber boutons from three WT (blue, 18 boutons) and three SynTKO (red, 16 boutons) animals. Genotypes were significantly different in a generalized linear mixed model with p = 0.0015. Median values are shown in black with interquartile ranges.
Figure 5.
Figure 5.
Increased active zone density in mossy fiber boutons of SynTKO mice. a, Example images from TEM showing mossy fiber boutons from WT (left) and SynTKO (right) animals in control (top) and FSK (bottom) condition. Black asterisks indicate the active zones. b, Example partial 3D reconstructions of mossy fiber boutons from untreated (top) and FSK-treated (bottom) SynTKO mice. Active zones with docked vesicles are shown in red (SynTKO) and yellow (SynTKO + FSK), respectively. Synaptic vesicles, mitochondria, and presynaptic membrane are shown in light blue; the postsynaptic membrane is shown in green. c, Single active zones were reconstructed from serial sections of TEM images. Left, An example stack of serial sections for one active zone, indicated by yellow lines at the active zone boundaries. Right, 3D reconstructions of single active zones from untreated (red) and FSK-treated (yellow) SynTKO mice, in side and top view, respectively. The yellow active zone corresponds to the serial images to the left. d, Complexity of boutons [measured as perimeter/area (µm-1)] plotted for individual mossy fiber boutons from untreated WT (blue dots, 17 boutons from 3 animals) and untreated SynTKO slices (red dots, 16 boutons from 3 animals) as well as for FSK-treated WT (green dots, 16 boutons from 3 animals) and FSK-treated SynTKO slices (yellow dots, 18 boutons from 3 animals). Median values are shown in black with interquartile ranges. A hypothesis test between generalized linear mixed models revealed no significant differences (p = 0.3972). e, The number of active zones per cubic micrometer plotted for individual mossy fiber boutons from untreated WT (blue dots, 17 boutons from 3 animals) and untreated SynTKO slices (red dots, 16 boutons from 3 animals) as well as for FSK-treated WT (green dots, 16 boutons from 3 animals) and FSK-treated SynTKO slices (yellow dots, 18 boutons from 3 animals). Median values are shown in black with interquartile ranges. A hypothesis test between nested generalized linear mixed models revealed significant differences (p = 0.04). A post hoc test (marginal contrasts analysis with p value adjustment) revealed significant differences between WT and SynTKO (p = 0.0359), WT and WT + FSK (p = 0.05), SynTKO and SynTKO + FSK (p = 0.005), and WT + FSK and SynTKO + FSK (p = 0.005), but no significant difference between WT + FSK and SynTKO (p = 0.772). f, The mean active zone area (µm2) per bouton for individual mossy fiber boutons from untreated WT (blue dots, 17 boutons from 3 animals) and untreated SynTKO slices (red dots, 16 boutons from 3 animals) as well as for FSK-treated WT (green dots, 16 boutons from 3 animals) and FSK-treated SynTKO slices (yellow dots, 18 boutons from 3 animals). Median values and interquartile ranges are shown in black. A hypothesis test between generalized linear mixed models revealed no significant differences (p = 0.8112). g, The number of docked synaptic vesicles per cubic micrometer plotted for individual mossy fiber boutons from untreated WT (blue dots, 17 boutons from 3 animals) and untreated SynTKO slices (red dots, 16 boutons from 3 animals) as well as for FSK-treated WT (green dots, 16 boutons from 3 animals) and FSK-treated SynTKO slices (yellow dots, 18 boutons from 3 animals). Median values are shown in black with interquartile ranges. A hypothesis test between generalized linear mixed models revealed significant differences for FSK treatment (p = 0.0002). A post hoc test (marginal contrasts analysis with p value adjustment) revealed significant differences between SynTKO and SynTKO + FSK (p = 0.0009).

Similar articles

Cited by

References

    1. Aarts E, Verhage M, Veenvliet JV, Dolan CV, Van Der Sluis S (2014) A solution to dependency: using multilevel analysis to accommodate nested data. Nat Neurosci 17:491–496. 10.1038/nn.3648 - DOI - PubMed
    1. Acsády L, Káli S (2007) Models, structure, function: the transformation of cortical signals in the dentate gyrus. Prog Brain Res 163:577–599. 10.1016/S0079-6123(07)63031-3 - DOI - PubMed
    1. Acsády L, Kamondi A, Sík A, Freund T, Buzsáki G (1998) GABAergic cells are the major postsynaptic targets of mossy fibers in the rat hippocampus. J Neurosci 18:3386–3403. 10.1523/JNEUROSCI.18-09-03386.1998 - DOI - PMC - PubMed
    1. Amaral DG, Ishizuka N, Claiborne B (1990) Chapter neurons, numbers and the hippocampal network. Prog Brain Res 83:1–11. 10.1016/S0079-6123(08)61237-6 - DOI - PubMed
    1. Atias M, Tevet Y, Sun J, Stavsky A, Tal S, Kahn J, Roy S, Gitler D (2019) Synapsins regulate α-synuclein functions. Proc Natl Acad Sci U S A 166:11116–11118. 10.1073/pnas.1903054116 - DOI - PMC - PubMed

LinkOut - more resources