. 2024 Jul 17;11(7):ENEURO.0043-24.2024.
doi: 10.1523/ENEURO.0043-24.2024. Print 2024 Jul.

Neural Filtering of Physiological Tremor Oscillations to Spinal Motor Neurons Mediates Short-Term Acquisition of a Skill Learning Task

Affiliations

Neural Filtering of Physiological Tremor Oscillations to Spinal Motor Neurons Mediates Short-Term Acquisition of a Skill Learning Task

Hélio V Cabral et al. eNeuro. .

Abstract

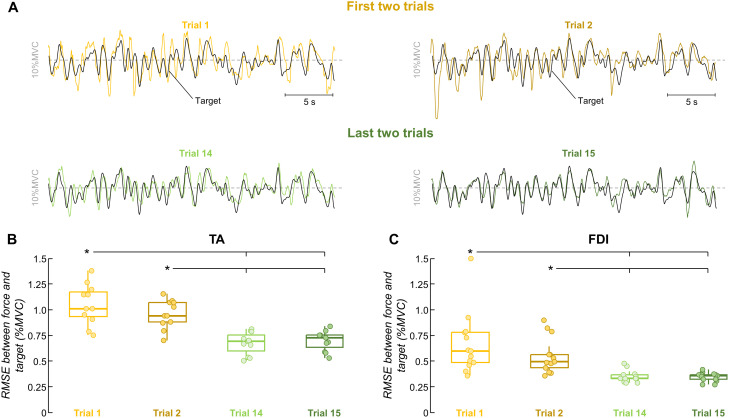
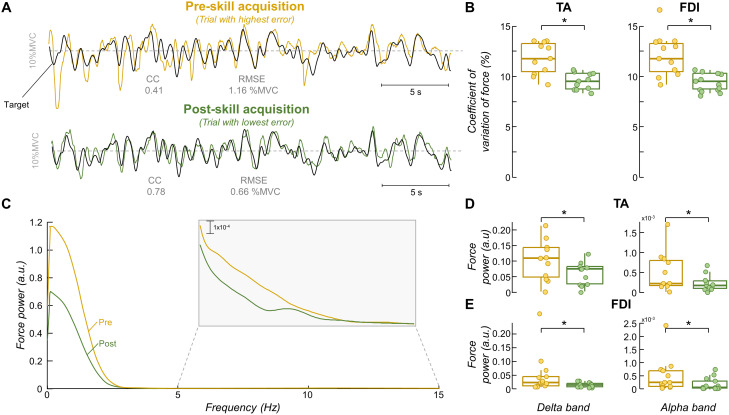
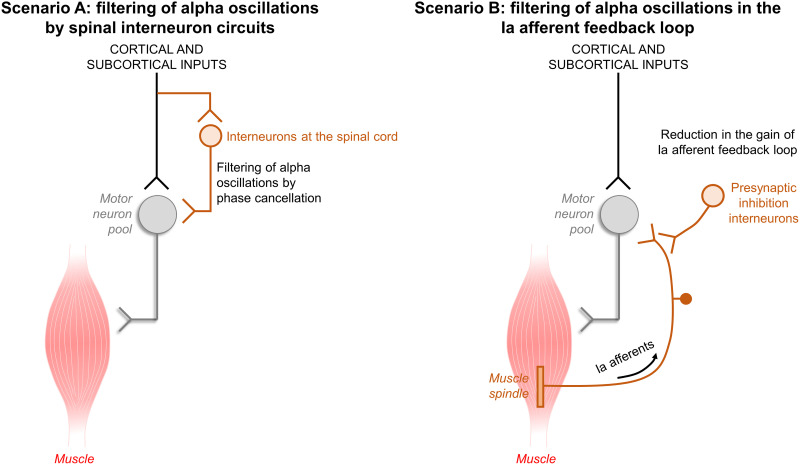
The acquisition of a motor skill involves adaptations of spinal and supraspinal pathways to alpha motoneurons. In this study, we estimated the shared synaptic contributions of these pathways to understand the neural mechanisms underlying the short-term acquisition of a new force-matching task. High-density surface electromyography (HDsEMG) was acquired from the first dorsal interosseous (FDI; 7 males and 6 females) and tibialis anterior (TA; 7 males and 4 females) during 15 trials of an isometric force-matching task. For two selected trials (pre- and post-skill acquisition), we decomposed the HDsEMG into motor unit spike trains, tracked motor units between trials, and calculated the mean discharge rate and the coefficient of variation of interspike interval (COVISI). We also quantified the post/pre ratio of motor units' coherence within delta, alpha, and beta bands. Force-matching improvements were accompanied by increased mean discharge rate and decreased COVISI for both muscles. Moreover, the area under the curve within alpha band decreased by ∼22% (TA) and ∼13% (FDI), with no delta or beta bands changes. These reductions correlated significantly with increased coupling between force/neural drive and target oscillations. These results suggest that short-term force-matching skill acquisition is mediated by attenuation of physiological tremor oscillations in the shared synaptic inputs. Supported by simulations, a plausible mechanism for alpha band reductions may involve spinal interneuron phase-cancelling descending oscillations. Therefore, during skill learning, the central nervous system acts as a matched filter, adjusting synaptic weights of shared inputs to suppress neural components unrelated to the specific task.

Keywords: common synaptic input; force control; motor unit; skill learning.


Conflict of interest statement

The authors declare no competing financial interests.

Figures

Figure 1.
Figure 1.
Experimental setup. A, Position of the participants’ wrist and hand on the custom-made dynamometer to record the abduction isometric force produced by the index finger. B, Position of the participants’ shank and foot on the custom-built dynamometer to measure the dorsiflexion isometric force produced by the ankle. High-density surface electromyography grids were placed over the first dorsal interosseous (FDI) muscle (A) and tibialis anterior (TA) muscle (B). C, Isometric force-matching tasks presented to the participants for the FDI (top) and the TA (bottom) muscles. Tasks involved a plateau region of 30 s containing a randomly generated signal low-pass filtered at 1.5 Hz. The target force level was defined as 5 and 10% of MVC for the FDI and TA, respectively. The same trajectory was used throughout all trials of the force-matching skill task.
Figure 2.
Figure 2.
Method for common synaptic input estimation. A, Motor unit identification and tracking via decomposition from high-density surface electromyography signals, with motor unit separation vectors reapplied between trials. B, Raster plots of matched units between trials. C, Estimation of common synaptic oscillations using coherence analysis. This involved analyzing two equally sized CSTs, derived by summing the discharge times of motor units randomly selected from matched motor units.
Figure 3.
Figure 3.
Performance results. Four (first two and last two) out of the 15 trials were used for each participant to assess improvements in force-matching. A, Representative comparison between the force and target during the skill acquisition task. The yellow lines indicate dorsiflexion isometric forces produced by a participant for the first two trials, and the green lines for the last two trials. The black line indicates the target. B, C, Group results of RMSE between the force and target for the tibialis anterior (TA) muscle (B) and the first dorsal interosseous (FDI) muscle (C). Circles identify individual participants. Horizontal traces, boxes, and whiskers denote the median value, interquartile interval, and distribution range. *p < 0.05.
Figure 4.
Figure 4.
Force steadiness and force power spectrum results. Two trials were selected for each participant to represent the pre- and post-skill acquisition trials. A, Representative comparison between the force and target for these two trials, where the yellow and green lines indicate the pre- and post-skill acquisition trials, respectively. The black line indicates the target. B, Group results of coefficient of variation of force (force steadiness). C, Power spectrum of force signals depicted in A. The gray box shows a zoom in the alpha band (5–15 Hz). D, E, Group results of mean force power the tibialis anterior (TA) muscle (D) and the first dorsal interosseous (FDI) muscle (E). Circles identify individual participants. Horizontal traces, boxes, and whiskers denote median value, interquartile interval, and distribution range. *p < 0.05.
Figure 5.
Figure 5.
Mean discharge rate and discharge variability results. A, B, Mean discharge rate results of matched motor units between pre- and post-skill acquisition trials for the tibialis anterior (TA) muscle (A) and the first dorsal interosseous (FDI) muscle (B). C, D, Coefficient of variation of interspike interval results of matched motor units between pre- and post-skill acquisition trials for the TA (C) and FDI (D) muscles. Each circle identifies a matched motor unit between trials. Each color of the circles corresponds to a specific participant. Horizontal traces, boxes, and whiskers denote median value, interquartile interval, and distribution range. Density curves of the data are represented on the right side of each panel by half-violin plots (yellow for pre-skill acquisition and green for post-skill acquisition). Note that density curves can be used to visually compare differences between pre- and post-skill acquisition trials. *p < 0.05.
Figure 6.
Figure 6.
Motor unit coherence results. A, B, Pooled z-coherence profiles considering all participants for the tibialis anterior (TA) muscle (A) and first dorsal interosseous (FDI) muscle (B; yellow for pre-skill acquisition and green for post-skill acquisition). The horizontal dashed line indicates the confidence level. Vertical dashed lines highlight the three frequency bandwidths analyzed: delta (1–5 Hz), alpha (5–15 Hz), and beta (15–35 Hz) bands. Gray areas denote statistical differences in the area under the curve between pre- and post-skill acquisition trials. C, D, Group results of the area under the curve ratio of coherence for the TA (C) and FDI (D) muscles. Circles identify individual participants. Note that, for visualization purposes, the individual data point of one participant in the delta band of panel D (with a value exceeding 0.6) is not displayed. Horizontal traces, boxes, and whiskers denote median value, interquartile interval, and distribution range. Density curves of the data are represented on the right side of each panel by half-violin plots. *p < 0.05.
Figure 7.
Figure 7.
Coherence between force/neural drive and target results. Pooled z-coherence profiles between force and target (A) and CST and target (B) for the tibialis anterior (TA) muscle (top) and first dorsal interosseous (FDI) muscle (bottom). Yellow and green lines indicate the pre-skill acquisition and post-skill acquisition trials, respectively. Note that the frequency bandwidth analyzed was only the delta band (the frequency bandwidth of the target). Blue boxplots show the group results of the area under the curve ratio of z-coherence. Circles identify individual participants. Horizontal traces, boxes, and whiskers denote median value, interquartile interval, and distribution range. *p < 0.05.
Figure 8.
Figure 8.
Correlation results. Repeated-measures correlations between changes in motor unit coherence within the alpha band and root mean square error between force and target signals (A), as well as between motor unit coherence within alpha band and coherence between force and target (B), and between motor unit coherence within the alpha band and coherence between CST and target (C). For this analysis, data from tibialis anterior and first dorsal interosseous muscles were pooled together.
Figure 9.
Figure 9.
Simulated scenarios to investigate neural mechanisms underlying the experimental results. Two different scenarios were simulated to investigate potential mechanisms that could explain the observed changes between pre- and post-skill acquisition. In Scenario A (left panel), we hypothesized that decreases in alpha band with the acquisition of the force-matching skill could be explained by spinal interneurons phase-cancelling central oscillatory inputs in the alpha frequency range. In Scenario B (right panel), we hypothesized that reductions in alpha band with the force-matching skill acquisition could be explained by increases in presynaptic inhibition of Ia afferent feedback into the motor neuron pool. Details about how we simulated these scenarios are provided in the Materials and Methods section.
Figure 10.
Figure 10.
Simulation results of best fitting scenario. A, Pooled z-coherence profiles considering all realizations. Vertical dashed lines highlight the three frequency bandwidths analyzed: delta (1–5 Hz), alpha (5–15 Hz), and beta (15–35 Hz) bands. B, Group results of the area under the curve ratio of coherence. Circles identify individual simulation realizations. Horizontal traces, boxes, and whiskers denote median value, interquartile interval, and distribution range. C, D, Pooled z-coherence profiles between simulated force and target (C) and between simulated CST and target (D). Note that the frequency bandwidth analyzed was only the delta band (the frequency bandwidth of the target). Blue boxplots show the results of the area under the curve ratio of z-coherence for all simulation realizations. In panels A, C, and D, yellow and green lines indicate the pre-skill acquisition and post-skill acquisition models, respectively. *p < 0.05.

Similar articles

References

    1. Baker SN (2007) Oscillatory interactions between sensorimotor cortex and the periphery. Curr Opin Neurobiol 17:649–655. 10.1016/j.conb.2008.01.007 - DOI - PMC - PubMed
    1. Baker SN, Olivier E, Lemon RN (1997) Coherent oscillations in monkey motor cortex and hand muscle EMG show task-dependent modulation. J Physiol 501:225–241. 10.1111/j.1469-7793.1997.225bo.x - DOI - PMC - PubMed
    1. Baker SN, Pinches EM, Lemon RN (2003) Synchronization in monkey motor cortex during a precision grip task. II. Effect of oscillatory activity on corticospinal output. J Neurophysiol 89:1941–1953. 10.1152/jn.00832.2002 - DOI - PubMed
    1. Baldissera F, Cavallari P, Cerri G (1998) Motoneuronal pre-compensation for the low-pass filter characteristics of muscle. A quantitative appraisal in cat muscle units. J Physiol 511:611–627. 10.1111/j.1469-7793.1998.611bh.x - DOI - PMC - PubMed
    1. Bawa P, Stein RB (1976) Frequency response of human soleus muscle. J Neurophysiol 39:788–793. 10.1152/jn.1976.39.4.788 - DOI - PubMed

LinkOut - more resources