Review
. 2024 Jul 1;23(3):316-340.
doi: 10.2463/mrms.rev.2024-0007. Epub 2024 Jun 12.

Tractometry of Human Visual White Matter Pathways in Health and Disease

Affiliations
Review

Tractometry of Human Visual White Matter Pathways in Health and Disease

Hiromasa Takemura et al. Magn Reson Med Sci. .

Abstract

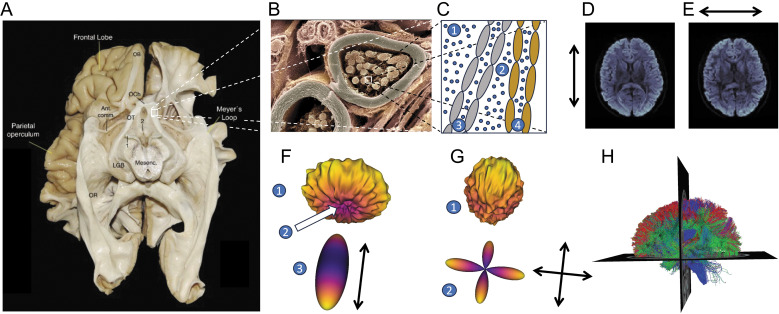
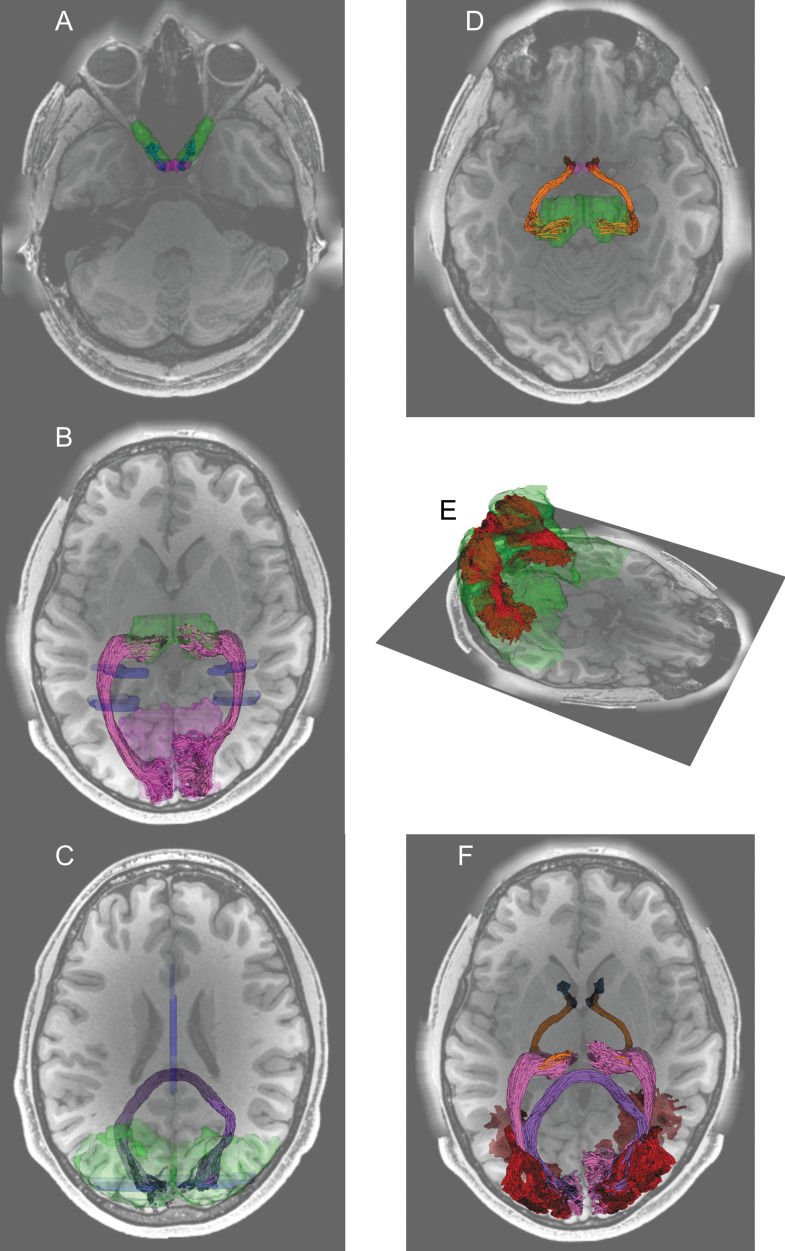
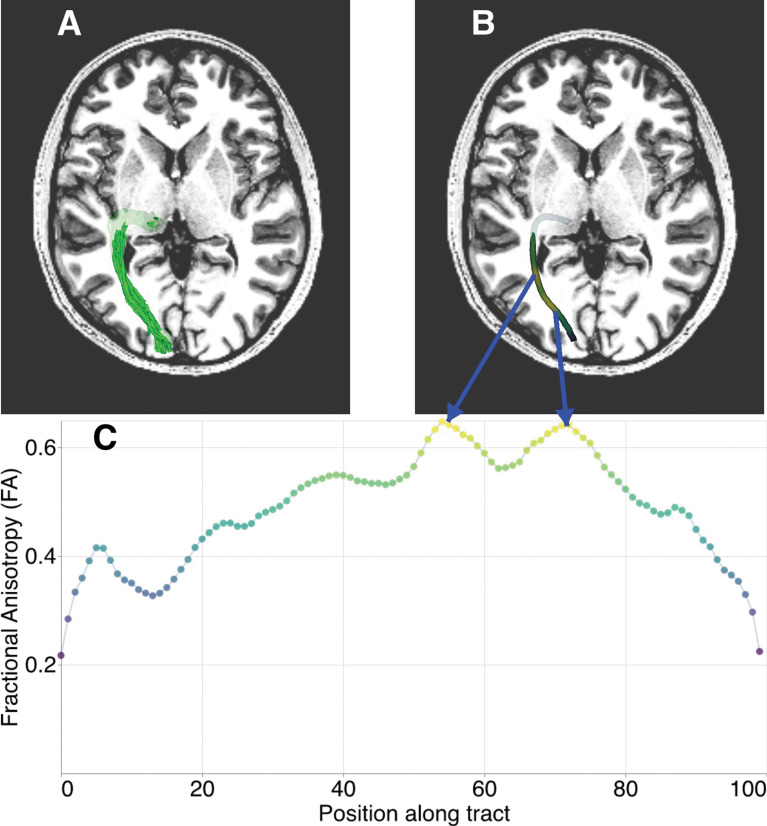
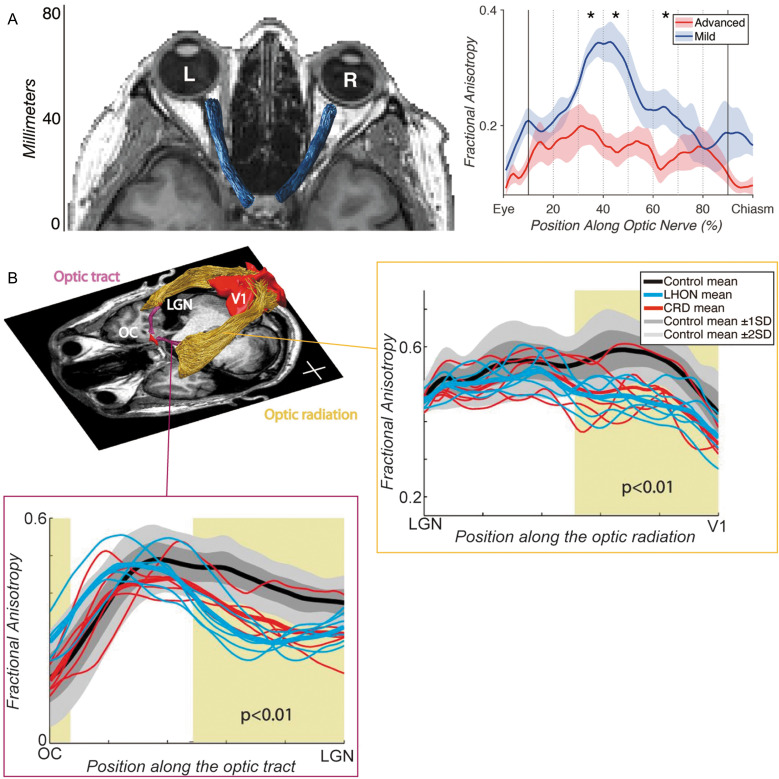
Diffusion-weighted MRI (dMRI) provides a unique non-invasive view of human brain tissue properties. The present review article focuses on tractometry analysis methods that use dMRI to assess the properties of brain tissue within the long-range connections comprising brain networks. We focus specifically on the major white matter tracts that convey visual information. These connections are particularly important because vision provides rich information from the environment that supports a large range of daily life activities. Many of the diseases of the visual system are associated with advanced aging, and tractometry of the visual system is particularly important in the modern aging society. We provide an overview of the tractometry analysis pipeline, which includes a primer on dMRI data acquisition, voxelwise model fitting, tractography, recognition of white matter tracts, and calculation of tract tissue property profiles. We then review dMRI-based methods for analyzing visual white matter tracts: the optic nerve, optic tract, optic radiation, forceps major, and vertical occipital fasciculus. For each tract, we review background anatomical knowledge together with recent findings in tractometry studies on these tracts and their properties in relation to visual function and disease. Overall, we find that measurements of the brain's visual white matter are sensitive to a range of disorders and correlate with perceptual abilities. We highlight new and promising analysis methods, as well as some of the current barriers to progress toward integration of these methods into clinical practice. These barriers, such as variability in measurements between protocols and instruments, are targets for future development.

Keywords: diffusion magnetic resonance imaging; tractography; tractometry; vision; white matter.


Conflict of interest statement

Conflicts of interest

Authors declare that no conflict of interest exists regarding this article.

Figures

Fig. 1
Fig. 1
Measurements of human brain connections with dMRI. A: The visual pathways in the human brain organize into large fascicles, here shown in a post-mortem dissection (Source: López-Elizalde et al. (2021), provided under the Attribution 4.0 International Creative Commons license [CC BY 4.0]). 1: oculomotor nerve, 2: mammillary bodies. B: Zooming in on these fascicles, here in a microscopic image of a nerve fiber, we observe that the fascicles are made up of individual myelinated axons (source: Wellcome Collection. https://wellcomecollection.org/works/ugyj9njv, Dr. David Furness, provided under the Attribution-NonCommercial 4.0 International Creative Commons license [CC BY-NC 4.0]). C: In a schematic diagram of two such axons, the diffusion of different populations of water molecules (small blue circles) is affected by the presence of the tissue in different ways: molecules outside of the bundle (C1) may diffuse freely in all directions, and their diffusion will be governed primarily by temperature and the self-diffusion properties of water. This diffusion is isotropic. Within the bundle, water that is between tightly packed axons (C2) may be affected by the degree of myelination of different axons (e.g., here myelination of two different axons is schematically depicted in gray and brown). Within the axons (C3 and C4), water is affected by the presence of cellular membranes. Moreover, the degree to which water diffusion is anisotropic within a measurement voxel may be affected by the distribution of different axons and their orientations. D: A horizontal slice through a PGSE dMRI measurement demonstrates that the signal is sensitized to diffusion in particular directions. Here, the gradient is approximately aligned with the anterior-posterior axis of the brain and the signal is higher in portions of the corpus callosum that are oriented orthogonal to the gradient direction. E: When the gradient is oriented along the right-left axis of the brain, the signal is higher in portions of the posterior callosum that are oriented orthogonal to this gradient direction. F: Models of the white matter explain the diffusion profile in multiple different directions. Here, the signal is high along multiple directions along the edge of the “donut” shape (F1) and low in some directions around the center of the “donut” (F2). This is consistent with a diffusion tensor model that is oriented along the low signal (F3). G: A signal with multiple peaks and valleys (G1) may be more consistent with a model that has multiple directions of crossing fibers, here represented as the fiber orientation distribution function from the CSD model (G2). H: Models such as the tensor and CSD serve as cues for computational tractography algorithms, which generate estimates of white matter fibers. Here, these estimates are represented as three-dimensional curves called “streamlines,” each colored to indicate their average direction: red for left-right, green for anterior-posterior and blue for inferior-superior. Ant. Comm., anterior commissure; dMRI, diffusion-weighted MRI; CSD, constrained spherical deconvolution; LGB, lateral geniculate body (also lateral geniculate nucleus, LGN); Mesenc, mesencephalon; OB, olfactory bulb; OCh, optic chiasm; OR, optic radiation; OT, optic tract; PGSE, pulsed-gradient spin echo.
Fig. 2
Fig. 2
Visual white matter tracts were identified by tractography in dMRI data from representative participants in the Human Connectome Project Young Adult data. A: The optic nerve (blue) was identified by tractography and mask ROIs (green) generated by automated segmentation of a structural image. The optic nerve and the optic chiasm (purple) were overlaid on an axial section of a T1-weighted image. B. The optic radiation (magenta) was identified using waypoint ROIs (blue) and endpoint ROIs (thalamus, green; primary visual cortex, light purple) transformed from the Montreal Neurological Institute (MNI) template space. C. The forceps major (dark purple) was identified from a waypoint ROI (blue) in the corpus callosum and endpoint ROIs (green) in the occipital cortex of each hemisphere. D. The optic tract (orange) was identified by using the optic chiasm (purple) and the thalamus (green) identified by segmentation on structural images as endpoint ROIs. E. The vertical occipital fasciculus (red) was identified by using dorsal and ventral visual areas (green) identified by using the automated anatomical labeling atlas. F. All identified tracts were overlaid on an axial section of a T1-weighted image.
Fig. 3
Fig. 3
Tractometry of tissue properties along the length of a white matter tract. A: Representation of a white matter tract (here the optic radiation) as streamlines overlaid on an axial section of a T1-weighted image in a randomly selected subject from the Healthy Brain Network, dataset. B: Individual streamlines are used to sample the volume of tissue properties mapped throughout the brain. The core of the bundle of streamlines, represented as a thick tube, is colored based on values aggregated across the streamlines and weighted based on how closely they resemble the central tendency of the collection of streamlines. C: The tract profile is sampled at 100 points along the core of the tract and represented as a one-dimensional vector of values that are used for subsequent analysis and interpretation. The horizontal axis represents position along the tract (left, anterior; right, posterior), whereas the vertical axis represents FA. FA, fractional anisotropy.
Fig. 4
Fig. 4
Tractometry on early visual white matter tracts. A: Tractometry study by Miller et al. (2019) focusing on the ON in patients with unilateral advanced-stage glaucoma. Left panel: The ON (blue) identified by tractography overlaid on the axial image of structural MRI data. Right panel: Tract profiles on dMRI data acquired from patients with unilateral advanced-stage glaucoma patients, comparing fractional anisotropy (vertical axis) along the ON between eyes with advanced (red) and mild (blue) glaucoma. The horizontal axis describes normalized positions along the ON. Images are adapted from Miller et al. (2019) under the Attribution 4.0 International Creative Commons license (CC BY 4.0). B: Tractometry study by Ogawa et al. (2014) focusing on the OT and OR in patients with LHON and CRD. Left top panel: Tractography on the OT (purple) and OR (yellow) in a representative participant overlaid on an axial slice of a T1-weighted image. The positions of the OC and primary visual cortex (V1) are also depicted. Left bottom panel: Tract profiles of the OT, based on dMRI data acquired from patients with LHON (cyan) and CRD (red), and healthy controls. Dark and light gray shadows depict the range of ±1 SD and ±2 SD from the control mean. The horizontal axis describes normalized positions along the OT. Right top panel: Tract profile of the OR. Conventions are identical to those used in the OT tract profile. Reprinted by permission from reference 118. CRD, cone-rod dystrophy; dMRI, diffusion-weighted MRI; LHON, Leber’s hereditary optic neuropathy; OC, optic chiasm; ON, optic nerve; OR, optic radiation; OT, optic tract; SD, standard diviation.
Fig. 5
Fig. 5
Forceps major. A: The lesion topography of alexia patients. The dark gray area (highlighted by arrow) indicates the brain lesion site commonly appeared in alexia patients. This area corresponds to the forceps major. Reprinted by permission from reference 191. B: The forceps major (blue) identified by using tractography in dMRI data overlaid on the axial section of a T1-weighted image. C: Tractometry study on the forceps major. Left panel: Tract profile of the forceps major in good (dark green) and poor readers (gray). The horizontal axis depicts the normalized position along the forceps major, whereas the vertical axis depicts microstructural measurement (ICVF estimated by NODDI). The shaded area indicates ±1 s.e.m. The reading performance was measured by the WJ-BRS. Right panel: the forceps major identified by tractography. Reprinted by permission from reference 202 (under the CC BY-NC-ND license). dMRI, diffusion-weighted MRI; ICVF, intra-cellular volume fraction; NODDI, neurite orientation dispersion and density imaging; WJ-BRS, Woodcock-Johnson Basic Reading Score.
Fig. 6
Fig. 6
Vertical occipital fasciculus. A: The VOF (blue) is identified by tractography, which is overlaid on a T1-weighted image (left image, coronal view; right image, and sagittal view). The VOF is lateral to the OR (green) while posterior to the arcuate fasciculus (red). Reprinted with permission from reference 207. B: The VOF identified by Klingler’s dissection (highlighted by blue), which is displayed together with other anatomical landmarks. Reprinted by permission from reference 211 (under the Attribution 4.0 International Creative Commons license (CC BY 4.0)). C: Tractometry on the VOF on amblyopia patients. Left panel: tractography on the OR (yellow) and VOF (blue) overlaid on a sagittal slice of a T1-weighted image. Right panel: tractometry on the right VOF. The amblyopia group (magenta curve) exhibited higher mean diffusivity (vertical axis, unit: µm2/s) compared with control (dark gray curve). The horizontal axis represents the normalized position along the VOF (left: dorsal, right: ventral). The shadowed area indicates ±1 s.e.m. from the mean in each group. The filled circles showed differences in mean diffusivity (MD) between amblyopia and the control group (the unit is shown on the right side of the plot). The error bar indicates the 95% confidence interval of the differences. Statistically significant differences were marked in red. Reprinted by permission from reference 168. A, anterior; AF, arcuate fasciculus; OR, optical radiation; P, posterior; PON, pre-occipital notch; POS, parieto-occipital sulcus; S, superior; TOS, transverse occipital sulcus; VOF, vertical occipital fasciculus.

Similar articles

Cited by

References

    1. Ramrattan RS, Wolfs RC, Panda-Jonas S, et al. Prevalence and causes of visual field loss in the elderly and associations with impairment in daily functioning: The Rotterdam Study. Arch Ophthalmol 2001; 119:1788–1794. - PubMed
    1. Prins D, Hanekamp S, Cornelissen FW. Structural brain MRI studies in eye diseases: Are they clinically relevant? A review of current findings. Acta Ophthalmol 2016; 94:113–121. - PubMed
    1. Azevedo FAC, Carvalho LRB, Grinberg LT, et al. Equal numbers of neuronal and nonneuronal cells make the human brain an isometrically scaled-up primate brain. J Comp Neurol 2009; 513:532–541. - PubMed
    1. Salami M, Itami C, Tsumoto T, Kimura F. Change of conduction velocity by regional myelination yields constant latency irrespective of distance between thalamus and cortex. Proc Natl Acad Sci USA 2003; 100:6174–6179. - PMC - PubMed
    1. Yakovlev P, Lecours A. The myelogenetic cycles of regional maturation of the brain. In Minkowski A. (ed): Regional development of the brain in early life. Philadelphia, FA Davis Co, 1967, 3-70.

MeSH terms