. 2024 Jun 25;34(5):725-739.
doi: 10.1101/gr.278661.123.

Genome-wide profiles of H3K9me3, H3K27me3 modifications, and DNA methylation during diapause of Asian corn borer (Ostrinia furnacalis)

Affiliations

Genome-wide profiles of H3K9me3, H3K27me3 modifications, and DNA methylation during diapause of Asian corn borer (Ostrinia furnacalis)

Pengfei Lv et al. Genome Res. .

Abstract

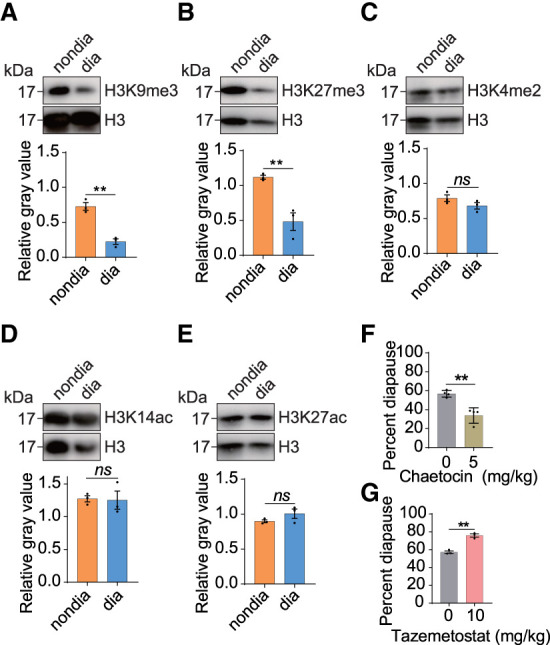
Diapause represents a crucial adaptive strategy used by insects to cope with changing environmental conditions. In North China, the Asian corn borer (Ostrinia furnacalis) enters a winter larval diapause stage. Although there is growing evidence implicating epigenetic mechanisms in diapause regulation, it remains unclear whether dynamic genome-wide profiles of epigenetic modifications exist during this process. By investigating multiple histone modifications, we have discovered the essential roles of H3K9me3 and H3K27me3 during diapause of the Asian corn borer. Building upon previous findings in vertebrates highlighting the connection between DNA methylation and repressive histone methylations, we have examined changes in the genome-wide profile of H3K9me3, H3K27me3, and DNA methylation at the nondiapause, prediapause, and diapause stages. Data analysis reveals significant alterations in these three modifications during diapause. Moreover, we observe a correlation between the H3K9me3 and H3K27me3 modification sites during diapause, whereas DNA modifications show little association with either H3K9me3 or H3K27me3. Integrative analysis of epigenome and expression data unveils the relationship between these epigenetic modifications and gene expression levels at corresponding diapause stages. Furthermore, by studying the function of histone modifications on genes known to be important in diapause, especially those involved in the juvenile pathway, we discover that the juvenile hormone pathway lies downstream from H3K9me3 and H3K27me3 histone modifications. Finally, the analysis of gene loci with modified modifications unreported in diapause uncovers novel pathways potentially crucial in diapause regulation. This study provides a valuable resource for future investigations aiming to elucidate the underlying mechanisms of diapause.


Figures

Figure 1.
Figure 1.
H3K9me3 and H3K27me3 are involved in diapause regulation of O. furnacalis larvae. (AE) Western blot analysis was conducted on the head of Asian corn borer larvae to detect the levels of H3K9me3, H3K27me3, H3K4me2, H3K14ac, and H3K27ac. The antibody against total H3 was used as the loading control. The relative gray values of western blot were measured using Image J. Statistical differences were measured using an unpaired t-test: (ns) no significant difference, (**) P < 0.01. Error bars show the mean ± SEM. (F) Newly molted fourth instar larvae were fed artificial diets containing 0 mg/kg and 5 mg/kg SUV39H2-like (homologous to SU(VAR3-9) of D. melanogaster) inhibitor chaetocin, respectively. The results showed that chaetocin alleviated diapause caused by adverse environment. Statistical analysis using an unpaired t-test revealed a significant difference: (**) P < 0.01. (G) Similarly, newly molted fourth instar larvae were fed artificial diets containing 0 mg/kg and 10 mg/kg E(Z) inhibitor tazemetostat, which is homologous to E(Z) of D. melanogaster. The results indicated that tazemetostat exacerbated diapause caused by adverse environmental conditions. Statistical analysis using an unpaired t-test revealed a significant difference: (**) P < 0.01. Each point on the bar graph represents the value of an independent replicate.
Figure 2.
Figure 2.
Positive correlation between H3K9me3 and H3K27me3 during different diapause stages. (A) ChIP-seq experimental design. (B) Distribution of H3K9me3 and H3K27me3 peaks across the annotated genome. (CE) Overlapping peaks of H3K9me3 and H3K27me3 in the nondiapause (C), prediapause (D), and diapause (E) stages. (FH) Venn diagram shows the number of genes with H3K9me3 peaks, H3K27me3 peaks, or both at the nondiapause (F), prediapause (G), and diapause (H) stages. (IK) Genome-wide correlation plots showing correlation of the occupancies of H3K9me3 and H3K27me3 at the nondiapause (I), prediapause (J), and diapause (K) stages. The correlation coefficient R is indicated. (L) Comparative KEGG enrichment analysis of comodified genes in the nondiapause, prediapause, and diapause stages. The color shade of the dots represents the P-value, and the size of the dots represents the gene enrichment ratio.
Figure 3.
Figure 3.
Global features of H3K9me3 and H3K27me3 modifications during diapause of Asian corn borer larvae. (A) Genome-wide correlation plots of H3K9me3 and H3K27me3 occupancies changed between the prediapause and nondiapause stages, respectively. (B) Genome-wide correlation plots of H3K9me3 and H3K27me3 occupancies changed between the prediapause and diapause stages, respectively. (C) Genome-wide correlation plots of H3K9me3 and H3K27me3 occupancies changed between the diapause and nondiapause stages, respectively. (DG) Volcano plot of genes with statistically significant differential H3K9me3 and H3K27me3 peaks between different diapause stages. (H) Comparative KEGG enrichment analysis of genes with statistically significant differential H3K9me3 peaks. (I) Comparative KEGG enrichment analysis of genes with statistically significant differential H3K27me3 peaks. (J) Heatmaps showing the clustering of genes with H3K9me3, H3K27me3, or H3K9me3/H3K27me3 comodifications in the nondiapause, prediapause, and diapause stages (left panel). The ratios of H3K9me3, H3K27me3, and H3K9me3/H3K27me3 comodified genes are shown (right panel). Red indicates the domains that are marked only by H3K9me3; green, domains that are marked only by H3K27me3; blue, H3K9me3/H3K27me3 comodified domains; and gray, unmarked domains. (K) The number of peaks in each cluster in panel J. (L) Comparative KEGG enrichment analysis of genes in different clusters in panel J.
Figure 4.
Figure 4.
WGBS analysis reveals significant changes in DNA methylation during the diapause stages of Asian corn borer larvae but are not correlated with H3K9me3 and H3K27me3 in occupation. (A) Metaplot showing variations in DNA methylation levels upstream of and downstream from gene bodies at different developmental stages. Each region of the gene was equally divided into 50 bins, and the methylation level was defined as the average of the methylated cytosines of the bins. (B) The average levels of DNA methylation in the nondiapause, prediapause, and diapause stages displayed in a line chart showed significant changes during diapause stages. Each data point represents the mean ± SEM of the methylation level (percentage of methylated CG in all CGs) for each diapause stage. (****) P < 0.0001 (determined by unpaired t-test). (C) Comparative KEGG enrichment analysis of genes with significant changes in DNA methylation during different diapause stages. (D) Heatmaps showing the dynamics of H3K9me3 (left) and DNA methylation (right) on H3K9me3-positive genes during diapause of Asian corn borer larvae. (E) Heatmaps showing the dynamics of H3K27me3 (left) and DNA methylation (right) on H3K27me3-positive genes during diapause of Asian corn borer larvae. (FH) Genome-wide correlation plots depicting the association between H3K9me3 and DNA methylation occupancies at the nondiapause, prediapause, and diapause stages. (IK) Genome-wide correlation plots depicting the association between H3K27me3 and DNA methylation occupancies at the nondiapause, prediapause, and diapause stages.
Figure 5.
Figure 5.
Analysis on the trend of global-level changes in three modifications and their correlations with gene expression levels during diapause. The three epigenetic modifications show significant changes during the diapause stages of Asian corn borer larvae. (A) Heatmaps illustrating the dynamics of H3K9me3 (left), H3K27me3 (middle), and gene counts (right) of all genes bearing the H3K9me3 domain in the heads of Asian corn borer larvae. (BD) Box-plots indicating the average levels of H3K9me3, H3K27me3, and gene counts of all gene-locus-bearing H3K9me3 domains at the nondiapause, prediapause, and diapause stages. Each box represents the mean ± SEM. (****) P < 0.0001 (determined by unpaired t-test). (E) Heatmaps showing the dynamics of H3K27me3 (left), H3K9me3 (middle), and gene counts (right) of all genes bearing the H3K27me3 domain in the heads of Asian corn borer larvae. (FH) Box-plots indicating the average levels of H3K9me3, H3K27me3, and gene counts of all gene-locus-bearing H3K27me3 domains at the nondiapause, prediapause, and diapause stages. Each box represents the mean ± SEM. (****) P < 0.0001 (determined by unpaired t-test). (I) Heatmaps showing the dynamics of DNA methylation (left) and gene counts (right) of all genes bearing DNA methylation domains in the heads of Asian corn borer larvae. (J,K) Box-plots showing the average level of DNA methylation and gene counts of all gene-locus-bearing DNA methylation domains at the nondiapause, prediapause, and diapause stages. Each box represents the mean ± SEM. (****) P < 0.0001 (determined by unpaired t-test). (LN) Genome-wide correlation plots of DNA methylation and gene counts in the nondiapause, prediapause, and diapause stages.
Figure 6.
Figure 6.
Clustering of the epigenetically modified genes known to be important for diapause regulation. (AC) The Venn diagram illustrates the number of overlapping genes between the known diapause-regulating gene number and the gene numbers epigenetically modified by H3K9me3 (A), H3K27me3 (B), and DNA methylation (C), with or without changes during diapause, respectively. (D) Comparative KEGG enrichment analysis of the overlapping genes shown in panels AC for H3K9me3, H3K27me3, and DNA methylation, respectively. (EG) Clustering of the overlapping genes shown in panels AC for H3K9me3 (E), H3K27me3 (F), and DNA methylation (G), respectively. Heatmaps show the genes with statistically significant changes (clustered by k-means). The line displays the overall changes in genes in each cluster (left). The KEGG enrichment of genes of clusters is shown on the right panel.
Figure 7.
Figure 7.
H3K9me3 and H3K27me3 regulate the expression levels of genes known to be related to diapause regulation. (A) Relative expression changes of genes in the juvenile hormone (JH) pathway after treatment with 5 mg/kg of the SUV39H2-like inhibitor chaetocin and 10 mg/kg of the E(Z) inhibitor tazemetostat compared with DMSO controls. Statistical differences were measured using an unpaired t-test: (ns) no significant difference, (*) P < 0.05, (**) P < 0.01, (***) P < 0.001, and (****) P < 0.0001. Error bars show the mean ± SEM. (B) Percentage of diapause was significantly changed by treatment of 0.01 mg/kg JH with or without 5 mg/kg of the SUV39H2-like inhibitor chaetocin or 10 mg/kg of the E(Z) inhibitor tazemetostat, respectively. Statistical differences were measured using an unpaired t-test: (ns) no significant difference, (****) P < 0.0001. Each data point represents the value of an independent replicate.
Figure 8.
Figure 8.
Analysis of previously unreported gene profiles in diapause reveals potential new regulators for diapause. (A) Comparative GO enrichment analysis and comparative KEGG enrichment analysis for the overlapping gene group shown in the upper panel (cf. with Fig. 6A–C) for H3K9me3, H3K27me3, and DNA methylation, respectively. (B,C) The top positive and top negative gene lists from the gene group indicated at the top of panel A. (D) Comparative KEGG enrichment analysis of the top positive and top negative genes. (E) Comparative GO enrichment analysis of the top positive and top negative genes.

Similar articles

Cited by

References

    1. Ahmadi F, Mikani A, Moharramipour S. 2021. Induction of diapause by clock proteins period and timeless via changes in PTTH and ecdysteroid titer in the sugar beet moth, Scrobipalpa ocellatella (Lepidoptera: Gelechiidae). Arch Insect Biochem Physiol 107: e21790. 10.1002/arch.21790 - DOI - PubMed
    1. Barberà M, Mariano Collantes-Alegre J, Martínez-Torres D. 2017. Characterisation, analysis of expression and localisation of circadian clock genes from the perspective of photoperiodism in the aphid Acyrthosiphon pisum. Insect Biochem Mol Biol 83: 54–67. 10.1016/j.ibmb.2017.02.006 - DOI - PubMed
    1. Batz ZA, Brent CS, Marias MR, Sugijanto J, Armbruster PA. 2019. Juvenile hormone III but not 20-hydroxyecdysone regulates the embryonic diapause of Aedes albopictus. Front Physiol 10: 1352. 10.3389/fphys.2019.01352 - DOI - PMC - PubMed
    1. Bhat KP, Kaniskan HU, Jin J, Gozani O. 2021. Epigenetics and beyond: targeting writers of protein lysine methylation to treat disease. Nat Rev Drug Discov 20: 265–286. 10.1038/s41573-020-00108-x - DOI - PMC - PubMed
    1. Bolger AM, Lohse M, Usadel B. 2014. Trimmomatic: a flexible trimmer for Illumina sequence data. Bioinformatics 30: 2114–2120. 10.1093/bioinformatics/btu170 - DOI - PMC - PubMed

Publication types

LinkOut - more resources