Gel-assisted mass spectrometry imaging enables sub-micrometer spatial lipidomics
- PMID: 38866734
- PMCID: PMC11169460
- DOI: 10.1038/s41467-024-49384-w
Gel-assisted mass spectrometry imaging enables sub-micrometer spatial lipidomics
Abstract
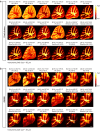
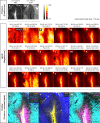
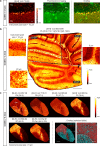
A technique capable of label-free detection, mass spectrometry imaging (MSI) is a powerful tool for spatial investigation of native biomolecules in intact specimens. However, MSI has often been precluded from single-cell applications due to the spatial resolution limit set forth by the physical and instrumental constraints of the method. By taking advantage of the reversible interaction between the analytes and a superabsorbent hydrogel, we have developed a sample preparation and imaging workflow named Gel-Assisted Mass Spectrometry Imaging (GAMSI) to overcome the spatial resolution limits of modern mass spectrometers. With GAMSI, we show that the spatial resolution of MALDI-MSI can be enhanced ~3-6-fold to the sub-micrometer level without changing the existing mass spectrometry hardware or analysis pipeline. This approach will vastly enhance the accessibility of MSI-based spatial analysis at the cellular scale.
© 2024. The Author(s).
Conflict of interest statement
R.G. is a co-inventor of multiple patents related to expansion microscopy. The other authors declare that they have no competing interests.
Figures


Update of
-
Gel-assisted mass spectrometry imaging.bioRxiv [Preprint]. 2023 Jun 3:2023.06.02.543480. doi: 10.1101/2023.06.02.543480. bioRxiv. 2023. Update in: Nat Commun. 2024 Jun 12;15(1):5036. doi: 10.1038/s41467-024-49384-w. PMID: 37398444 Free PMC article. Updated. Preprint.
Similar articles
-
Gel-assisted mass spectrometry imaging.bioRxiv [Preprint]. 2023 Jun 3:2023.06.02.543480. doi: 10.1101/2023.06.02.543480. bioRxiv. 2023. Update in: Nat Commun. 2024 Jun 12;15(1):5036. doi: 10.1038/s41467-024-49384-w. PMID: 37398444 Free PMC article. Updated. Preprint.
-
Combined matrix-assisted laser desorption/ionisation-mass spectrometry imaging with liquid chromatography-tandem mass spectrometry for observing spatial distribution of lipids in whole Caenorhabditis elegans.Rapid Commun Mass Spectrom. 2024 Sep;38(17):e9850. doi: 10.1002/rcm.9850. Rapid Commun Mass Spectrom. 2024. PMID: 39034751
-
Imaging mass spectrometry for lipidomics.Biochim Biophys Acta. 2011 Nov;1811(11):961-9. doi: 10.1016/j.bbalip.2011.03.004. Epub 2011 Mar 29. Biochim Biophys Acta. 2011. PMID: 21440085 Review.
-
Mass Spectrometry Imaging for Single-Cell or Subcellular Lipidomics: A Review of Recent Advancements and Future Development.Molecules. 2023 Mar 17;28(6):2712. doi: 10.3390/molecules28062712. Molecules. 2023. PMID: 36985684 Free PMC article. Review.
-
High-resolution atmospheric-pressure MALDI mass spectrometry imaging workflow for lipidomic analysis of late fetal mouse lungs.Sci Rep. 2019 Feb 28;9(1):3192. doi: 10.1038/s41598-019-39452-3. Sci Rep. 2019. PMID: 30816198 Free PMC article.
Cited by
-
Synthetic Lipid Biology.Chem Rev. 2025 Feb 26;125(4):2502-2560. doi: 10.1021/acs.chemrev.4c00761. Epub 2025 Jan 13. Chem Rev. 2025. PMID: 39805091 Review.
-
Mass Spectrometry-Based Spatial Multiomics Revealed Bioaccumulation Preference and Region-Specific Responses of PFOS in Mice Cardiac Tissue.Environ Sci Technol. 2025 Feb 4;59(4):1957-1968. doi: 10.1021/acs.est.4c09874. Epub 2025 Jan 22. Environ Sci Technol. 2025. PMID: 39841981 Free PMC article.
-
TEMI: tissue-expansion mass-spectrometry imaging.Nat Methods. 2025 May;22(5):1051-1058. doi: 10.1038/s41592-025-02664-9. Epub 2025 Apr 22. Nat Methods. 2025. PMID: 40263584 Free PMC article.
-
Seeing is Believing: Developing Multimodal Metabolic Insights at the Molecular Level.ACS Cent Sci. 2024 Mar 21;10(4):758-774. doi: 10.1021/acscentsci.3c01438. eCollection 2024 Apr 24. ACS Cent Sci. 2024. PMID: 38680555 Free PMC article. Review.
-
Plasma Lipidomics Profiling of Developmental Dysplasia of the Hip in Tibet Plateau.Health Care Sci. 2025 Apr 6;4(2):144-153. doi: 10.1002/hcs2.70012. eCollection 2025 Apr. Health Care Sci. 2025. PMID: 40241981 Free PMC article.
References
MeSH terms
Substances
Grants and funding
- R01NS124784/U.S. Department of Health & Human Services | National Institutes of Health (NIH)
- Startup Fund/UofI | University of Illinois at Chicago (UIC)
- R01 NS124784/NS/NINDS NIH HHS/United States
- McKnight Technological Innovations in Neuroscience Award/McKnight Endowment Fund for Neuroscience
- CAREER Award 2143920/National Science Foundation (NSF)
- UG3MH126864/U.S. Department of Health & Human Services | National Institutes of Health (NIH)
- R01NS114413/U.S. Department of Health & Human Services | National Institutes of Health (NIH)
- UG3 MH126864/MH/NIMH NIH HHS/United States
- R01 NS114413/NS/NINDS NIH HHS/United States
- Searle Scholars Program/Kinship Foundation
- DP2MH136390/U.S. Department of Health & Human Services | National Institutes of Health (NIH)
- DP2 MH136390/MH/NIMH NIH HHS/United States
LinkOut - more resources
Full Text Sources
Molecular Biology Databases

