. 2024 Jun 12;15(1):5037.
doi: 10.1038/s41467-024-48259-4.

Entire expressed peripheral blood transcriptome in pediatric severe malarial anemia

Affiliations

Entire expressed peripheral blood transcriptome in pediatric severe malarial anemia

Samuel B Anyona et al. Nat Commun. .

Abstract

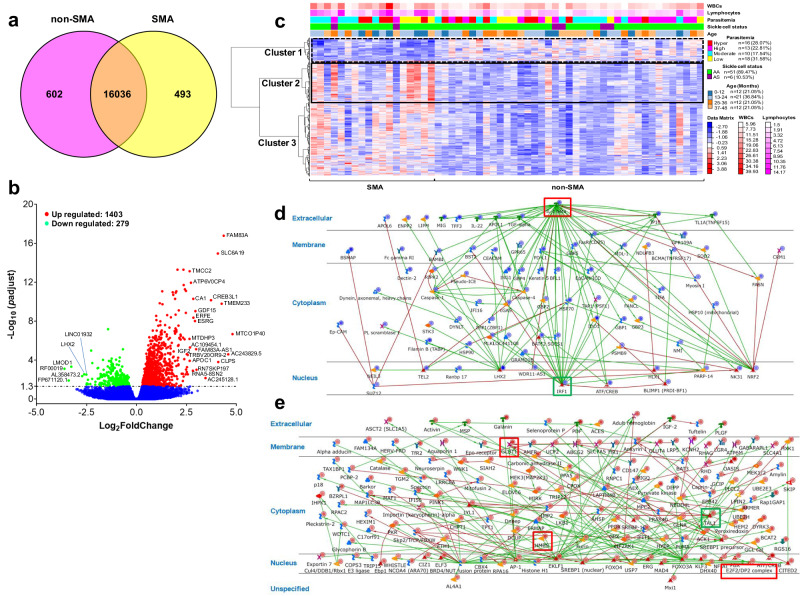
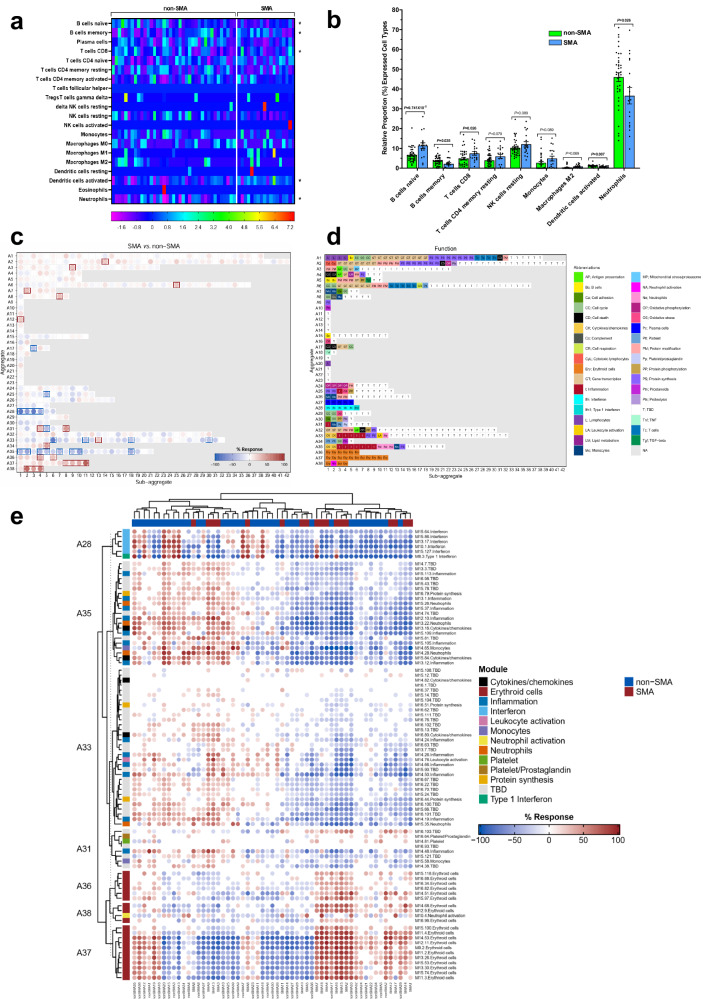
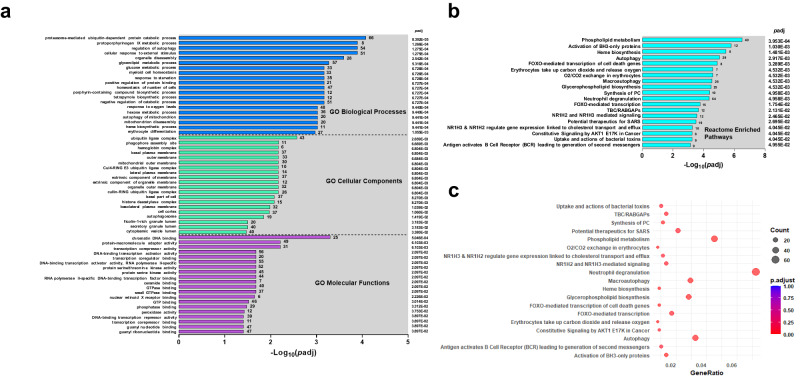
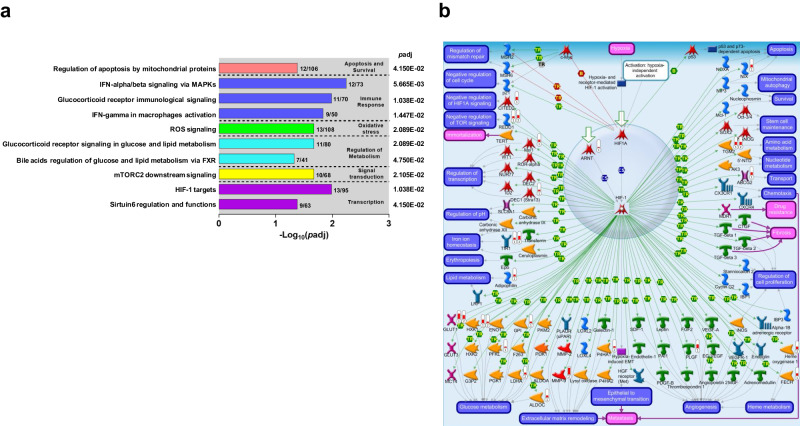
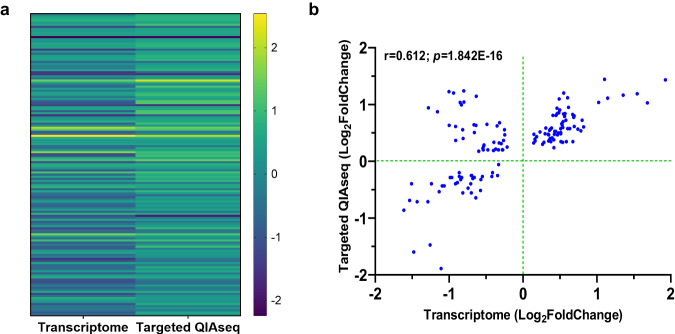
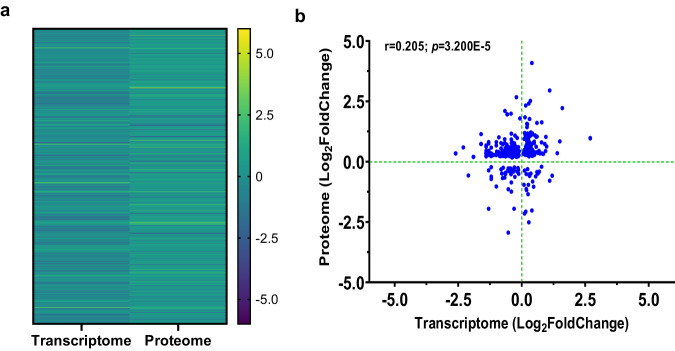
This study on severe malarial anemia (SMA: Hb < 6.0 g/dL), a leading global cause of childhood morbidity and mortality, compares the entire expressed whole blood host transcriptome between Kenyan children (3-48 mos.) with non-SMA (Hb ≥ 6.0 g/dL, n = 39) and SMA (n = 18). Differential expression analyses reveal 1403 up-regulated and 279 down-regulated transcripts in SMA, signifying impairments in host inflammasome activation, cell death, and innate immune and cellular stress responses. Immune cell profiling shows decreased memory responses, antigen presentation, and immediate pathogen clearance, suggesting an immature/improperly regulated immune response in SMA. Module repertoire analysis of blood-specific gene signatures identifies up-regulation of erythroid genes, enhanced neutrophil activation, and impaired inflammatory responses in SMA. Enrichment analyses converge on disruptions in cellular homeostasis and regulatory pathways for the ubiquitin-proteasome system, autophagy, and heme metabolism. Pathway analyses highlight activation in response to hypoxic conditions [Hypoxia Inducible Factor (HIF)-1 target and Reactive Oxygen Species (ROS) signaling] as a central theme in SMA. These signaling pathways are also top-ranking in protein abundance measures and a Ugandan SMA cohort with available transcriptomic data. Targeted RNA-Seq validation shows strong concordance with our entire expressed transcriptome data. These findings identify key molecular themes in SMA pathogenesis, offering potential targets for new malaria therapies.


Conflict of interest statement

The authors declare no competing interests.

Figures

Fig. 1
Fig. 1. Differential gene expression analysis in children with severe malaria anemia.
EdgeR (3.16.5) was used to infer the overall distribution of differentially expressed genes. a Venn Diagram depicting relationship (similarities and differences) of 53,286 transcripts between the clinical groups, with unique and co-expressed genes within each group shown, and overlapping regions indicating shared gene expression patterns. b Volcano plot showing 1,403 up-regulated and 279 down-regulated protein-coding genes in Kenyan children presenting with non-SMA (Hb≥6.0 g/dL, n = 39) and SMA (Hb<6.0 g/dL, n = 18). The significance measure (exact-test based on the negative binomial distribution) is shown on the Y-axis as negative logarithm of p-adjusted (-Log10(padj-value), and the effect size is depicted on the X-axis [Log2(FoldChange)]. Significance set at padj < 0.050 and Log2(FoldChange)>1.3. Blue dots represent genes with no significant difference, red dots denote up-regulated genes, and green dots represent down-regulated genes. c. Hierarchical Clustering Heatmap of 1,682 differentially expressed genes, illustrating clustering analysis based on Log2(FPKM + 1) values. WBCs counts, lymphocytes, parasitemia, sickle cell trait status, and age distributions are shown. Clusters 1 (down-regulated in SMA) and 2 (up-regulated in SMA) are delineated with hatched and solid black outlines, respectively. d, e DEGs enrichment analysis of process networks based on clusters from the heatmap, highlighting significant gene networks and central divergence/convergence hubs. Blue circles represent down-regulated genes, while red circles denote up-regulated genes. The IRF1 ↔ SUZ12 ↔ IL-1β ↔ NRF2 ↔ LHX2 network contained 279 down-regulated genes (Cluster 1) with the transcription factor, IRF1, as the central divergence hub (green box) and IL-1β as the central convergence (red box, Fig. 1d). The TAL1 ↔ LYL1 ↔ BRD4 ↔ FOXO3A ↔ EKLF1 network shows 489 up-regulated genes (Cluster 2) with TAL1 as the central divergence hub (green box) and the transcription factor, E2F2 as the central convergence hub containing secondary convergence hubs, GLUT1 and HMBS (red boxes, Fig. 1e). Details of symbols used in these figures are available at: https://portal.genego.com/legends/MetaCoreQuickReferenceGuide.pdf.
Fig. 2
Fig. 2. Cellular composition and module repertoire analysis of whole blood.
Deconvolution analysis of the different cell types in blood was determined using CIBERSORTx. Cellular frequencies were imputed using LM22 as the signature matrix file. a Heatmap representing the cell type expression for 22 types/subtypes of leukocyte cell populations presented at the individual patient level in the non-SMA (Hb≥6.0 g/dL, n = 39) and SMA (Hb<6.0 g/dL, n = 18) groups. An asterisk (*) indicates significant differences in immune cell proportions between the two groups determined using two-sided, two-sample t-tests with Welch correction, and p < 0.050. b Relative proportion (%) of expression for immune cell types differing between non-SMA (n = 39) and SMA (n = 18) groups, presented as mean (SEM) after bivariate analysis using two-sided, two-sample t-tests with Welch correction. Module repertoire analysis of DEGs was performed using the BloodGen3Module R package. c Module fingerprint grid plot analysis results following Welch′s-corrected t-test. Each module is positioned on a grid, with rows corresponding to ‘module aggregates’ reflecting similar abundance patterns across reference datasets of distinct immune states. The number of constitutive modules for each aggregate varies from 1 (A9-A14, A19-A23) to 42 (A2). Red spots indicate “up-regulated modules”, while blue spots represent “down-regulated modules” in children with SMA relative to non-SMA. d Biological/immunological function associated with each of the modules within the grid. e Fingerprint heatmap represents patterns of annotated modules across individual study participants. The heatmap displays the abundance patterns of 85 annotated modules using an FDR correction with a 20% differentially expressed significance level. Hierarchical clustering arranges samples (columns) and modules (rows), with color gradients indicating proportions of differentially expressed transcripts ranging from blue (decreased) to red (increased).
Fig. 3
Fig. 3. Functional enrichment analysis of differentially expressed genes in severe malarial anemia.
a Gene Ontology (GO) Enrichment Analysis presenting the top 20 enriched terms in biological process, cellular component, and molecular function categories of DEGs in children with SMA (Hb<6.0 g/dL, n = 18) compared to non-SMA (Hb≥6.0 g/dL, n = 39) group. Enrichment analysis was conducted using the clusterProfiler R package, correcting for gene length bias. Enriched GO terms were determined by hypergeometric test, with p-adjusted values < 0.050 considered significant. The X-axis represents the negative logarithm of p-adjusted (-Log10[p adjusted]) values. Significance determined by one-sided overrepresentation analysis with multiple testing corrections using the Benjamini-Hochberg procedure. b Reactome enrichment analysis of 19 enriched terms that were significantly different in children with SMA. Pathway names are represented on the Y-axis, while the X-axis shows the -Log10(p adj) values at <0.050. Statistical significance was computed using one-sided overrepresentation analysis (correction by Benjamini-Hochberg procedure). c Reactome enrichment histogram displaying the emerging 19 terms. Pathway names are represented on the Y-axis, while the X-axis indicates the gene ratio of up-and-down-regulated genes. The size of the black dots corresponds to the number of annotated genes, and the depth of red color indicates the magnitude of enrichment (padj < 0.050).
Fig. 4
Fig. 4. Top-ranked MetacoreTM canonical pathway maps in severe malarial anemia.
a The top 10-ranked canonical pathway maps that emerged from the RNA-Seq analysis in SMA (Hb<6.0 g/dL, n = 18) compared to non-SMA (Hb≥6.0 g/dL, n = 39) according to p-adjusted values. The top 10 maps that emerged represent six functional categories: (i) Apoptosis and Survival, (ii) Immune Response, (iii) Oxidative Stress, (iv) Regulation of Metabolism, (v) Signal Transduction, and (vi) Transcription. The left Y-axis indicates the specific biological pathways that were established by non-contradictory state-of-the-art knowledge of the major categories for human metabolism and cell signaling. The right Y-axis shows p-adjusted values for each pathway map. The X-axis represents the -Log10(padj) value. Statistical test computed using a hypergeometric probability formula, and padj < 0.050. b The second-top-ranked canonical pathway map for Kenyan children [SMA (n = 18) versus non-SMA (n = 39)] and top-ranked canonical pathway map for Ugandan children [SMA (n = 17) versus community children (household controls, n = 12)] was Hypoxia-Inducible Factor (HIF)-targets in transcription. The red thermometers indicate annotated genes that were up-regulated in children with SMA (1 = Kenyan children and 2 = Ugandan children), while the blue thermometers indicate down-regulated genes (1 = Kenyan children and 2=Ugandan children). The details of symbols used in these figures are available at: https://portal.genego.com/legends/MetaCoreQuickReferenceGuide.pdf.
Fig. 5
Fig. 5. Validation of whole blood transcriptome data using targeted-RNA-Seq panel.
Validation of the RNA-Seq results was performed by comparing the significant (p < 0.050) DEGs in the transcriptome analysis with those that were significant in a Qiagen targeted-RNA sequencing panel (491 immune response genes) in a different cohort of Kenyan children [SMA (n = 21) and non-SMA (n = 23). a Heatmap illustrating the comparison of significant (p < 0.050) DEGs between the two datasets. The Y-axis depicts the gene pairs, and the X-axis represents the assay type. The color scale depicts fold regulation (Log2). Statistical significance determined using a generalized linear model with a negative binomial distribution, p < 0.050. b Correlation scatter plot demonstrating the relationship between significantly expressed genes in targeted QIAseq analysis (Log2FoldChange, Y-axis) versus transcriptome data (Log2FoldChange, X-axis). A strong positive correlation of DEGs using two-tailed Spearman’s test (r = 0.612; 95% confidence interval, 0.496-0.706; p = 1.842E−16) validates concordance between the two sequencing methods.
Fig. 6
Fig. 6. Comparative analysis of transcriptomics and proteome abundance.
To assess the alignment between DEGs identified from RNA-Seq and changes in protein levels, whole blood transcriptome data were compared with protein abundance measured in plasma using a 7k SomaScan platform. MetaCoreTM facilitated the mapping of genes to their respective protein products for 35 children (n = 19 non-SMA and n = 16 SMA) with both available measurements. The analysis identified 405 gene/protein pairs with a significant association (p < 0.050). a Heatmap showing the comparison of significant (p < 0.050) gene/protein pairs between the two datasets. The Y-axis depicts the gene/protein pairs, while the X-axis represents the assay type. The color scale depicts fold regulation (Log2), and p < 0.050 calculated using a generalized linear model with a negative binomial distribution. b Correlation scatter plot demonstrating the relationship between significantly expressed protein targets (Log2FoldChange; Y-axis) and genes (Log2FoldChange; X-axis). A two-tailed Spearman’s test indicated a modest positive concordance between gene expression and protein abundance (r = 0.205; 95% confidence interval, 0.107–0.299); p = 3.200E−5].

Update of

Similar articles

Cited by

References

    1. WHO. World Malaria Report 2023. Report No. CC BY-NC-SA 3.0 IGO, (Geneva, 2023).
    1. Akech S, et al. The clinical profile of severe pediatric malaria in an area targeted for routine RTS, S/AS01 malaria vaccination in Western Kenya. Clin. Infect. Dis. 2020;71:372–380. doi: 10.1093/cid/ciz844. - DOI - PMC - PubMed
    1. Amek NO, et al. Childhood cause-specific mortality in rural Western Kenya: application of the InterVA-4 model. Glob. Health Action. 2014;7:25581. doi: 10.3402/gha.v7.25581. - DOI - PMC - PubMed
    1. Amek NO, et al. Infant and child mortality in relation to malaria transmission in KEMRI/CDC HDSS, Western Kenya: validation of verbal autopsy. Malar. J. 2018;17:37. doi: 10.1186/s12936-018-2184-x. - DOI - PMC - PubMed
    1. Obonyo CO, Vulule J, Akhwale WS, Grobbee DE. In-hospital morbidity and mortality due to severe malarial anemia in western Kenya. Am. J. Trop. Med. Hyg. 2007;77:23–28. doi: 10.4269/ajtmh.77.6.suppl.23. - DOI - PubMed

Substances