. 2024 Jun 12;15(1):5031.
doi: 10.1038/s41467-024-49300-2.

Tau follows principal axes of functional and structural brain organization in Alzheimer's disease

Affiliations

Tau follows principal axes of functional and structural brain organization in Alzheimer's disease

Julie Ottoy et al. Nat Commun. .

Abstract

Alzheimer's disease (AD) is a brain network disorder where pathological proteins accumulate through networks and drive cognitive decline. Yet, the role of network connectivity in facilitating this accumulation remains unclear. Using in-vivo multimodal imaging, we show that the distribution of tau and reactive microglia in humans follows spatial patterns of connectivity variation, the so-called gradients of brain organization. Notably, less distinct connectivity patterns ("gradient contraction") are associated with cognitive decline in regions with greater tau, suggesting an interaction between reduced network differentiation and tau on cognition. Furthermore, by modeling tau in subject-specific gradient space, we demonstrate that tau accumulation in the frontoparietal and temporo-occipital cortices is associated with greater baseline tau within their functionally and structurally connected hubs, respectively. Our work unveils a role for both functional and structural brain organization in pathology accumulation in AD, and supports subject-specific gradient space as a promising tool to map disease progression.


Conflict of interest statement

The authors declare no competing interests.

Figures

Fig. 1
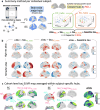
Fig. 1. Methodology of gradient generation.
a Our multi-modal input data included dMRI, fMRI, and PET images, co-registered to a high-resolution custom brain atlas. b The resulting modality-specific connectomes or covariance matrices were transformed into a similarity matrix and subjected to diffusion map embedding. The resulting gradients make up a low-dimensional coordinate space. The interpretation of gradients (as applied in the current work) is visually compared to the traditional atlasing techniques, showing overlapping modes of connectivity similarity vs. discrete regions. c The main analyses involve either cohort-level investigations using group-wise connectomes/covariance matrices (Spearman’s rank coefficient ρ between different modalities) or individual participants’ connectomes (between-group differences based on t-statistics).
Fig. 2
Fig. 2. Functional and structural connectivity gradients are altered in AD.
a The first three functional connectivity gradients (GFC) projected onto the left-brain surface, extracted from the cohort-level connectome (average of n = 213 connectomes). Similar colors along the purple-yellow scale represent similar brain-wide connectivity patterns. The bar plots represent the corresponding network-specific average gradient scores ± standard error of the mean (SEM). G1FC, G2FC, and G3FC explained 55, 17, and 9% of the information in functional connectome data, respectively. b Coordinate system spanned by the first two gradients based on group-level functional connectomes (average of n = 103, 35, and 75 connectomes, respectively), indicating G1FC contraction with unimodal and transmodal (DMN) regions moving closer to each other in CI participants. c Histogram of gradient scores reflected global G1FC contraction with an expansion of scores centered around zero. d Between-group comparisons (green: CN A+ [n = 35] vs. controls [n = 101]; orange: CI [n = 72] vs. controls [n = 101]) of network-based G1FC alterations (asterisks represent significant t-statistics at the network-level with two-sided P < 0.05, adjusted for age, sex, and APOE-ε4) using a group-level (left) or full cohort-level (right) gradient realignment strategy. Word clouds of NeuroSynth cognitive terms associated with regions with positive (red) or negative (blue) t-statistic G1FC differences between diagnostic groups (using cohort-level realignment strategy). e G1SC, G2SC, and G3SC explained 28, 20, and 9% of the information in structural connectome data, respectively. f Coordinate system spanned by the first two gradients. g Histogram of G1SC. h Between-group comparisons (green: CN A+ [n = 35] vs. controls [n = 102]; orange: CI [n = 72] vs. controls [n = 102]) of network-based G1SC alterations and corresponding word clouds. Results are displayed for the left hemisphere; Supplementary Fig. 1, 3, and 7 show right hemisphere projections and group differences. Source data are provided as a Source Data file. Abbreviations: CN cognitively normal, CI cognitively impaired, FC functional connectivity, G gradient, SC structural connectivity.
Fig. 3
Fig. 3. Connectivity gradients align with PET gradients.
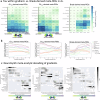
a The first three gradients of tau-PET (GTAU) projected onto the brain surface and their corresponding network-specific average values ± SEM for G1TAU and G2TAU (40 and 28% explained the information in tau-PET data), extracted from the CI group (average of n = 75 tau covariance matrices). b Heatmap showing Spearman’s rank correlations ρ between gradients of functional connectivity (GFC) and GTAU, indicating a strong association between their primary gradients G1FC and G1TAU. c ρ between gradients of structural connectivity (GSC) and GTAU, indicating a strong association between G1SC and G2TAU. d The first three gradients of inflammation (TSPO)-PET (GINFLAM) projected onto the brain surface and their corresponding network-specific average values for G1INFLAM and G3INFLAM (39 and 11% explained information in TSPO-PET data), extracted from the CI group (thresholded at 50% sparsity due to low sample size [average of n = 32 TSPO covariance matrices]). G2INFLAM (19% explained information) may primarily reflect partial volume effect and was not included in the barplots. e Heatmap showing ρ between GFC and GINFLAM, indicating a modest association between G2FC and G1INFLAM. f ρ between GSC and GINFLAM, indicating a strong association between G1SC and G1INFLAM. Results are displayed for the left hemisphere; Supplementary Fig. 14, 15 show right hemisphere projections and correlations. A cubic polynomial was fitted for each of the regressions, indicating absolute RMSE and R2 of the fitted model. The two-sided P-value of gradient correlations was tested with null models using spatial autocorrelation-preserving surrogates based on variogram matching (1000 permutations). Source data are provided as a Source Data file. Abbreviations: CI cognitively impaired, FC functional connectivity, G gradient, RMSE root-mean-square error, SC structural connectivity.
Fig. 4
Fig. 4. Longitudinal tau-PET gradients align with connectome and inflammation gradients.
a The first three gradients of longitudinal tau accumulation (GΔTAU) projected onto the left brain surface, extracted from the A+ group (average of n = 39 Δtau covariance matrices). b Network-specific average values ± SEM for G1ΔTAU (top) and G2ΔTAU (bottom), explaining 51 and 13% of the information respectively in Δtau-PET data, with the first gradient largely overlapping with Braak stages. c Heatmap showing Spearman’s rank correlation ρ between GFC or GSC and GΔTAU, indicating good alignment (G1FC-G2ΔTAU: RMSE = 0.04, R2 = 0.26; G2FC-G1ΔTAU: RMSE = 0.16, R2 = 0.12; G1SC-G1ΔTAU: RMSE = 0.15, R2 = 0.30). Results are displayed for the left hemisphere; Supplementary Fig. 15 shows right hemisphere correlations. d ρ between GΔTAU and GINFLAM based on template gradients across the cohort. e ρ between GΔTAU and GINFLAM based on template gradients in A+. The two-sided P-value of gradient correlations was tested with null models using spatial autocorrelation-preserving surrogates based on variogram matching (1000 permutations). Source data are provided as a Source Data file. Abbreviations: FC functional connectivity, G gradient, RMSE root-mean-square error, SC structural connectivity.
Fig. 5
Fig. 5. Tau within gradient-derived subject-specific hubs drives tau accumulation.
a Subject-specific hubs were identified (blue) based on the graph theoretical metric called degree extracted from the thresholded and binarized connectivity matrix, from which the top nearest distance hubs (in gradient space) to each ROI were selected (yellow), for each participant. Tau SUVR was then averaged within each of these FC hubs (green; tauFC_hubs) and SC hubs (orange; tauSC_hubs). b Regression results (n = 86 participants) of longitudinal ΔtauROI with baseline tauFC_hubs and tauSC_hubs, adjusted for age, sex, APOE-ε4, baseline tauROI, and FWE at two-sided P < 0.001, replicated for two different atlases. A positive t-statistic (red) within an ROI indicates a positive relationship between tau accumulation within the ROI and baseline tau within the ROI’s hubs, while a negative t-statistic (blue) indicates a negative relationship. c Schematic showing the baseline tau within the subject-wise selected hubs nearest connected to the top positive and negative t-statistic ROI from panel b, averaged across the cohort. A positive t-statistic (red color in panel b) resulted from a relatively higher tau deposition within the ROI’s hubs (see average [avg] tauFC_hubs and tauSC_hubs) compared to tau within the ROI itself, while a negative t-statistic (blue color in panel b) resulted from a relatively lower tau deposition within the ROI’s hubs. The average Δtau SUVR among all participants is shown on the outer right panel. Source data are provided as a Source Data file. Abbreviations: FC functional connectivity, ROI region-of-interest, SC structural connectivity, SUVR standardized uptake value ratio.
Fig. 6
Fig. 6. Interaction between connectome gradient and tau on cognition.
a The interaction effect between regional tau SUVR and G1FC score (aligned to the full cohort-level template) on baseline MMSE and language in A+ (n = 107 and n = 90, respectively). A negative interaction effect (blue t-statistic in transmodal regions) indicates that higher tau together with a higher G1FC score (gradient contraction towards unimodal) results in lower cognition. Similarly, a positive interaction (red t-statistic in unimodal regions) indicates that higher tau together with lower G1FC score (gradient contraction towards transmodal) is associated with lower cognition. b The interaction effect between regional tau SUVR and G1SC score on cognition. The scatterplot illustrates the interaction effect between regional tau (binned into low [blue] vs. high [orange] for visualization) and G1 score for representative ROIs (see Source Data file), with linear fits and 95% confidence intervals. c, d The 3-way interaction effect between time, regional tau SUVR and G1FC (panel c) or G1SC (panel d) on 2-year cognitive change across all participants. Sample sizes varied across composite scores: MMSE: nvisit1 = 104, nvisit2 = 89, nvisit3 = 58 and language: nvisit1 = 99, nvisit2 = 78, nvisit3 = 58. Limbic regions are blue for G1FC and red for G1SC because they are largely located on the negative vs. the more positive pole of the respective gradients; while, the prefrontal cortex (blue) is located on both the negative poles of the respective gradients. All analyses were adjusted for age, sex, education, APOE-ε4 and FWE at two-sided P < 0.01. Source data are provided as a Source Data file. Abbreviations: FC functional connectivity, G gradient, MMSE Mini-mental state examination, ROI region-of-interest, SC structural connectivity, SUVR standardized uptake value ratio.
Fig. 7
Fig. 7. Gradient-derived ROIs capture brain-behavior relationships.
a Cognitive correlates of tau SUVR within G1FC-derived (left), G1SC-derived (middle), or Braak meta-ROIs (right). Partial regression (absolute Pearson’s R) adjusted for age, sex, education, and APOE-ε4. Sample sizes of A+ participants varied across composite scores: word reading n = 87, delayed memory n = 76, immediate memory n = 82, executive function n = 86, object recognition n = 86, processing speed n = 84, and cognitive flexibility n = 81. b The resultant correlation coefficients changed in a topology-specific manner along the G1FC and G1SC but not the Braak axes (based on a linear regression between gradient bin ordering and the tau-cognition [z-scored] correlation coefficient within each bin, at two-sided PFDR < 0.05). c Z-statistic maps of the associations between meta-analytic cognitive terms and our primary functional (left), structural (middle), and tau-PET (right) CI template gradients. Terms are ordered by the weighted mean of their location along 5-percentile bins of the gradient. Source data are provided as a Source Data file. Abbreviations: CI cognitively impaired, FC functional connectivity, ROI region-of-interest, SC structural connectivity.

References

    1. The Alzheimer’s Association. 2023 Alzheimer’s disease facts and figures. Alzheimers Dement. 19, 1598–1695 (2023). - PubMed
    1. Sepulcre, J. et al. Tau and amyloid β proteins distinctively associate to functional network changes in the aging brain. Alzheimers Dement13, 1261–1269 (2017). - PMC - PubMed
    1. Jack, C. R. et al. NIA-AA research framework: toward a biological definition of Alzheimer’s disease. Alzheimers Dement14, 535–562 (2018). - PMC - PubMed
    1. Malpetti, M., Joie, R. L. & Rabinovici, G. D. Tau Beats Amyloid in predicting brain atrophy in Alzheimer disease: implications for prognosis and clinical trials. J. Nucl. Med.63, 830–832 (2022). - PMC - PubMed
    1. Pini, L. Brain network modulation in Alzheimer’s disease: clinical phenotypes and windows of opportunity. Neural Regen. Res.18, 115–116 (2022). - PMC - PubMed

MeSH terms