. 2024 Jun 12;15(6):411.
doi: 10.1038/s41419-024-06775-7.

MAL2 reprograms lipid metabolism in intrahepatic cholangiocarcinoma via EGFR/SREBP-1 pathway based on single-cell RNA sequencing

Affiliations

MAL2 reprograms lipid metabolism in intrahepatic cholangiocarcinoma via EGFR/SREBP-1 pathway based on single-cell RNA sequencing

Tian Huang et al. Cell Death Dis. .

Abstract

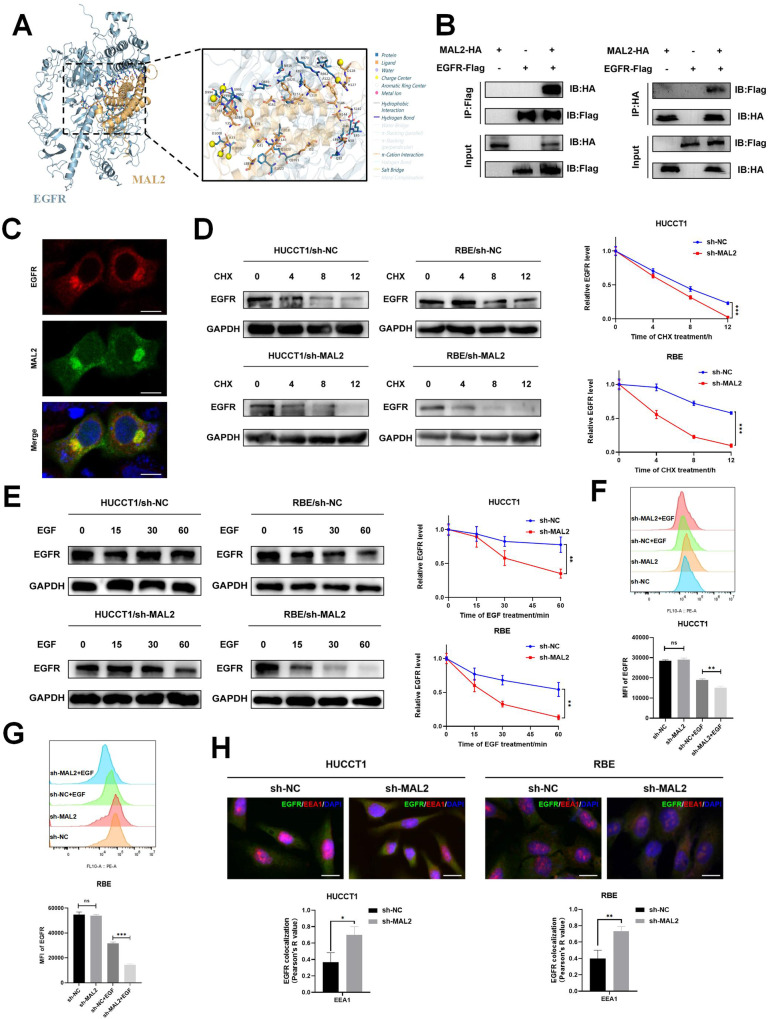
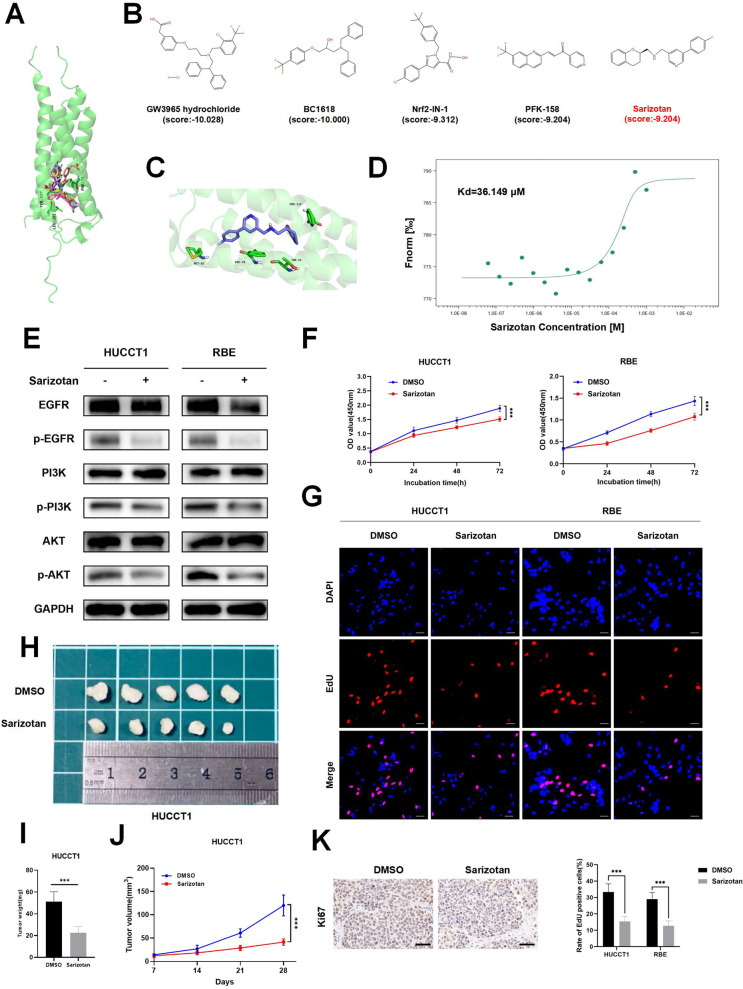
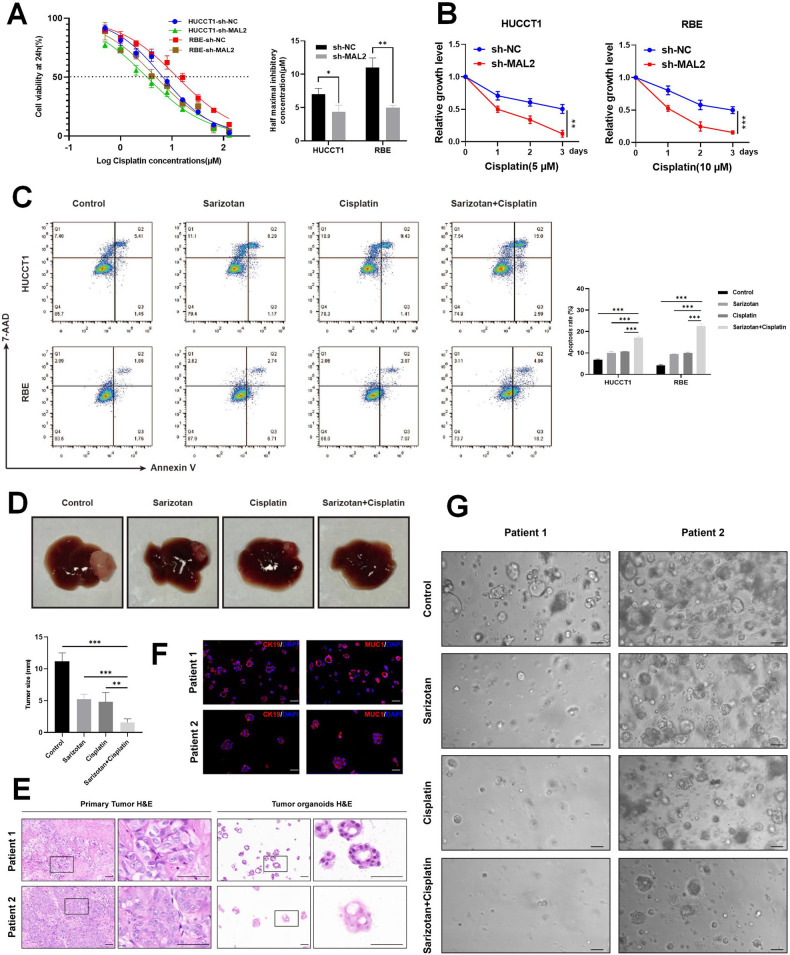
Intrahepatic cholangiocarcinoma (ICC) is a highly aggressive cancer characterized by a poor prognosis and resistance to chemotherapy. In this study, utilizing scRNA-seq, we discovered that the tetra-transmembrane protein mal, T cell differentiation protein 2 (MAL2), exhibited specific enrichment in ICC cancer cells and was strongly associated with a poor prognosis. The inhibition of MAL2 effectively suppressed cell proliferation, invasion, and migration. Transcriptomics and metabolomics analyses suggested that MAL2 promoted lipid accumulation in ICC by stabilizing EGFR membrane localization and activated the PI3K/AKT/SREBP-1 axis. Molecular docking and Co-IP proved that MAL2 interacted directly with EGFR. Based on constructed ICC organoids, the downregulation of MAL2 enhanced apoptosis and sensitized ICC cells to cisplatin. Lastly, we conducted a virtual screen to identify sarizotan, a small molecule inhibitor of MAL2, and successfully validated its ability to inhibit MAL2 function. Our findings highlight the tumorigenic role of MAL2 and its involvement in cisplatin sensitivity, suggesting the potential for novel combination therapeutic strategies in ICC.


Conflict of interest statement

The authors declare no competing interests.

Figures

Fig. 1
Fig. 1. Outlines the acquisition of scRNA-seq profiles for various ICC samples and subsequent data generation.
A A UMAP visualization representing eight unique cell types identified within normal and tumoral tissues. B Utilization of a violin plot to depict the distinct cellular populations and their respective differential markers. C Heat maps presenting the differentiation of cell populations and their distinguishing markers. D Another UMAP representation showcasing the heterogeneity in MAL2 expression across various clusters. E The heat maps depict differential expressions within varied cell populations derived from disparate samples. F The violin plot portrays the diversity in MAL2 expression within differing clusters and tissues. G Clustering heatmap of CopyKAT-estimated copy number profiles of scRNA-seq. H UAMP visualization of malignant cholangiocyte clusters identified on the basis of CNV. I A UMAP visualization representing five unique cell types identified within normal and tumoral tissues. J UMAP representation showcasing the heterogeneity in MAL2 expression across various clusters. K The violin plot portrays the diversity in MAL2 expression within differing clusters and tissues.
Fig. 2
Fig. 2. The substantial impact of MAL2 knockdown in hindering ICC cell proliferation, invasion, and migration.
A Comparative analysis of MAL2’s mRNA expression levels in HUCCT1 and RBE cells following transfection with either sh-NC (negative control) or sh-MAL2 (sh1, sh2, and sh3). B Quantification of MAL2 protein expression in HUCCT1 and RBE cells post-transfection with sh-NC or sh-MAL2 (sh1, sh2, and sh3) using western blotting technique. C Relative mRNA and protein expression of MAL2 in HUCCT1 and RBE cells transfected with control (negative control) or MAL2 vector. D Growth kinetics of HUCCT1 and RBE cells, post-transfection with sh-NC, sh-MAL2, control or MAL2 vector, was charted based on the CCK-8 assay data at various time points – 0, 24, 48, and 72 h. E, F Cell proliferation in ICC cells post-transfection with sh-NC, sh-MAL2, control, or MAL2 vector was evaluated using an EdU assay; the scale bar represents 50 μm. G, H A wound healing assay assessed the migratory capacity of HUCCT1 and RBE cells post-transfection with sh-NC, sh-MAL2, control, or MAL2 vector; the scale bar represents 50 μm. I, J Invasion potential of HUCCT1 and RBE cells post-transfection with sh-NC, sh-MAL2, control, or MAL2 vector was investigated using a Transwell invasion assay; the scale bar stands for 200 μm. *P < 0.05; **P < 0.01; ***P < 0.001.
Fig. 3
Fig. 3. Transcriptomic and metabolomic exploration upon MAL2 suppression in ICC cells.
A A heatmap displays shifts in gene expression subsequent to MAL2 silencing in ICC cells. B, C Pathway enrichment of KEGG and GO among the diverse genes expressed. D A Circos plot illustrating the associations among various disparate metabolites. E Classification and tallying of distinctive metabolites in every control group, based on their structure and function, are demonstrated, presenting classification data from both KEGG and HMDB databases. F A Sankey diagram showing the trajectories of downregulated metabolite data flow across multiple pathways. G KEGG pathway investigation pinpointing the key pathways where these altered metabolites are heavily represented.
Fig. 4
Fig. 4. MAL2 enhancement of cellular lipid storage in HUCCT1 and RBE cells through the activation of PI3K/AKT signal pathway.
The baseline LDs content in sh-NC or sh-MAL2-introduced (A), and control or MAL2 vector-introduced (B) HUCCT1 and RBE cells was evaluated using Nile red staining, scale bar, 50 μm. This was followed by quantifying the mean fluorescence intensity of Nile red staining for each cell line. C Western blotting methodology was implemented to investigate the expression of SREBP-1 post-MAL2 suppression and overexpression, using GAPDH as a loading standard. D In HUCCT1 and RBE cells, post-MAL2 suppression and overexpression, the relative mRNA expression of lipid synthesis genes was probed through qRT-PCR. E In HUCCT1 and RBE cells, post-Fatostain treatment (20 µM, 48 h), the relative mRNA expression of SCD and FASN was probed through qRT-PCR. F The impact of MAL2 on the PI3K/AKT signal pathway in sh-NC or sh-MAL2-transfected HUCCT1 and RBE cells was explored using western blotting. G Results of determining the PA concentration in each sample group. H, I ICC cell line membrane expression of MAL2, stimulated by PA or 2-BP, was discerned via western blotting. *P < 0.05; **P < 0.01; ***P < 0.001.
Fig. 5
Fig. 5. EGFR is involved in MAL2-mediated activation of the PI3K/AKT signaling axis.
A, B Utilizing immunofluorescence, the expression of MAL2 and EGFR in ICC tissues from patients exhibiting high or low MAL2 expression was assessed, scale bar, 50 μm. C The correlation between MAL2 and EGFR was analyzed based on mean fluorescence intensity (MFI). D The impact of MAL2 on the EGFR/PI3K/AKT signal pathway in sh-NC or sh-MAL2-transfected HUCCT1 and RBE cells post EGF treatment (50 ng/ml, 30 min) was explored using western blotting. E The impact of MAL2 on the EGFR/PI3K/AKT signal pathway in vector or MAL2-transferred HUCCT1 and RBE cells post AG1478 treatment (10 μM, 24 h) was explored using western blotting. F Invasion potential of HUCCT1 and RBE cells transfected with control or MAL2 vector post AG1478 treatment (10 μM, 24 h) was investigated using a Transwell invasion assay; the scale bar stands for 200 μm. G Cell proliferation in ICC cells transfected with control or MAL2 vector post AG1478 treatment (10 μM, 24 h) was evaluated using an EdU assay; the scale bar represents 50 μm. H The baseline LDs content in control or MAL2 vector-introduced HUCCT1 and RBE cells post AG1478 treatment (10 μM, 24 h) was evaluated using Nile red staining, scale bar, 50 μm. This was followed by quantifying the mean fluorescence intensity of Nile red staining for each cell line. ***P < 0.001.
Fig. 6
Fig. 6. Interaction of MAL2 and EGFR inhibits the degradation of EGFR through endocytosis.
A Postulated modes of binding between MAL2 and EGFR. B Co-IP analysis was conducted to represent the association between MAL2 and EGFR in HEK293T cells transfected with HA-tagged MAL2 and flag-tagged EGFR. C Immunofluorescence was used to validate the binding interaction between MAL2 and EGFR, scale bar, 10 μm. D ICC cells from different groups treated with CHX (20 μg/ml). Cells were then harvested at specified time frames (0, 4, 8, 12 h) for subsequent western blotting. E HUCCT1 and RBE cell lines from sh-NC and sh-MAL2 groups were serum-starved for 24 h. After stimulation with EGF (50 ng/ml) at the indicated time intervals (min), EGFR expression levels were detected by western blot. F, G HUCCT1 and RBE cell lines from sh-NC and sh-MAL2 groups were serum-starved for 24 h. Exemplary flow cytometry analysis and mean fluorescence intensity of EGFR in HUCCT1 and RBE cells, following treatment with EGF (50 ng/ml, 30 min). H The extent of EGFR and lysosomal marker EEA1 co-localization in control and knockdown ICC cells with MAL2 was evaluated via immunofluorescence assay post EGF stimulation (50 ng/ml,15 min), scale bar, 20 μm. *P < 0.05; **P < 0.01; ***P < 0.001.
Fig. 7
Fig. 7. Identification of a minuscule molecular inhibitor aiming at MAL2’s active site.
A The superimposed MAL2 protein (AlphaFold ID: AF-Q969L2-F1) alongside compounds chosen via computer-aided screening. B Conformational and docking advantages of sarizotan from the leading MAL2-compound scoring top-five interaction model. C A simplified depiction of sarizotan occupying the MAL2 protein’s active site. D MST analysis quantified the binding tenacity between sarizotan and MAL2. E The impact of sarizotan on the EGFR/PI3K/AKT signal pathway in HUCCT1 and RBE cells was explored using western blotting. F CCK-8 assay traced the growth trajectories of HUCCT1 and RBE cells under DMSO or sarizotan administration at 0, 24, 48, and 72 h intervals. G Cell propagation of ICC cells under DMSO or sarizotan treatment was scrutinized via EdU assay, scale bar, 50 μm. H Representative images of tumors from nude mice treated with DMSO or sarizotan. I, J Tumor growth curves and tumor weights of each group. K The expression level of Ki67 in nude mice-derived xenograft tumor was determined by IHC, scale bar, 50 μm. ***P < 0.001.
Fig. 8
Fig. 8. Sarizotan heightens the sensitivity of ICC to cisplatin.
A Post 24 h of cisplatin treatment, the IC50 values for HUCCT1 and RBE cells transfected with sh-NC or sh-MAL2 were determined. B The survival of HUCCT1 and RBE cells, transfected with either sh-NC or sh-MAL2 was gauged via the CCK-8 assay following cisplatin administration (5 or 10 μM, respectively). C Apoptosis in HUCCT1 and RBE cells across various treatments was gauged with flow cytometry, employing the Annexin V/7AAD Apoptosis Detection Kit. D Macroscopic appearance of liver orthotopic transplanted tumor from different groups. E Depicted are representative images of primary tumors and their matching organoids stained with H&E, scale bar, 50 μm. F The immunofluorescence staining of CK19 and MUC1 (red) – the ICC markers, validated the retention of the primary tumor marker expression profile in the organoids, scale bar, 50 µm. G Canonical illustrations of two discrete ICC organoid lines post 72 h of varying treatments, scale bar, 200 μm. *P < 0.05; **P < 0.01; ***P < 0.001.
Fig. 9
Fig. 9. Charts the molecular modus operandi of MAL2 bolstering ICC advancement.
When EGF is instigated, MAL2 sustains the membrane presence of EGFR, averting endocytosis, and persistently triggers the PI3K/AKT/SREBP-1 route. This sequence of events consequently accelerates lipid accretion in ICC and induces cisplatin insensitivity. Increased PA succeeds in preserving the membrane localization of MAL2. Sarizotan is identified as a diminutive molecular disruptor of MAL2, signifying its prospective utility in ICC therapy.

References

    1. Moris D, Palta M, Kim C, Allen PJ, Morse MA, Lidsky ME. Advances in the treatment of intrahepatic cholangiocarcinoma: an overview of the current and future therapeutic landscape for clinicians. CA Cancer J Clin. 2023;73:198–222. doi: 10.3322/caac.21759. - DOI - PubMed
    1. Sirica AE, Gores GJ, Groopman JD, Selaru FM, Strazzabosco M, Wei Wang X, et al. Intrahepatic cholangiocarcinoma: continuing challenges and translational advances. Hepatology. 2019;69:1803–15. doi: 10.1002/hep.30289. - DOI - PMC - PubMed
    1. Kelley RK, Bridgewater J, Gores GJ, Zhu AX. Systemic therapies for intrahepatic cholangiocarcinoma. J Hepatol. 2020;72:353–63. doi: 10.1016/j.jhep.2019.10.009. - DOI - PubMed
    1. Papalexi E, Satija R. Single-cell RNA sequencing to explore immune cell heterogeneity. Nat Rev Immunol. 2018;18:35–45. doi: 10.1038/nri.2017.76. - DOI - PubMed
    1. Jovic D, Liang X, Zeng H, Lin L, Xu F, Luo Y. Single-cell RNA sequencing technologies and applications: a brief overview. Clin Transl Med. 2022;12:e694. doi: 10.1002/ctm2.694. - DOI - PMC - PubMed

Publication types

MeSH terms

Substances