. 2024 Jun 12;15(1):5035.
doi: 10.1038/s41467-024-49482-9.

Programmable melanoma-targeted radio-immunotherapy via fusogenic liposomes functionalized with multivariate-gated aptamer assemblies

Affiliations

Programmable melanoma-targeted radio-immunotherapy via fusogenic liposomes functionalized with multivariate-gated aptamer assemblies

Xijiao Ren et al. Nat Commun. .

Abstract

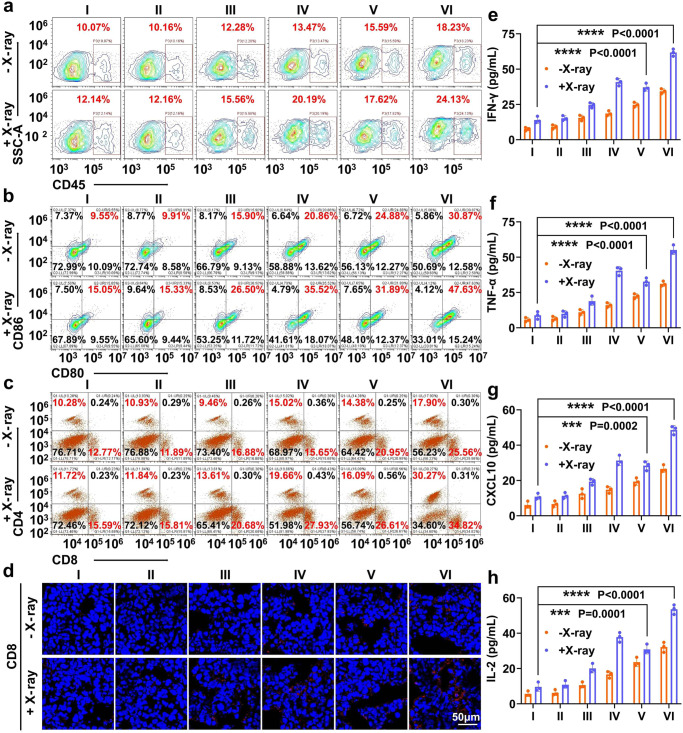
Radio-immunotherapy exploits the immunostimulatory features of ionizing radiation (IR) to enhance antitumor effects and offers emerging opportunities for treating invasive tumor indications such as melanoma. However, insufficient dose deposition and immunosuppressive microenvironment (TME) of solid tumors limit its efficacy. Here we report a programmable sequential therapeutic strategy based on multifunctional fusogenic liposomes (Lip@AUR-ACP-aptPD-L1) to overcome the intrinsic radio-immunotherapeutic resistance of solid tumors. Specifically, fusogenic liposomes are loaded with gold-containing Auranofin (AUR) and inserted with multivariate-gated aptamer assemblies (ACP) and PD-L1 aptamers in the lipid membrane, potentiating melanoma-targeted AUR delivery while transferring ACP onto cell surface through selective membrane fusion. AUR amplifies IR-induced immunogenic death of melanoma cells to release antigens and damage-associated molecular patterns such as adenosine triphosphate (ATP) for triggering adaptive antitumor immunity. AUR-sensitized radiotherapy also upregulates matrix metalloproteinase-2 (MMP-2) expression that combined with released ATP to activate ACP through an "and" logic operation-like process (AND-gate), thus triggering the in-situ release of engineered cytosine-phosphate-guanine aptamer-based immunoadjuvants (eCpG) for stimulating dendritic cell-mediated T cell priming. Furthermore, AUR inhibits tumor-intrinsic vascular endothelial growth factor signaling to suppress infiltration of immunosuppressive cells for fostering an anti-tumorigenic TME. This study offers an approach for solid tumor treatment in the clinics.


Conflict of interest statement

The authors declare no competing interests.

Figures

Fig. 1
Fig. 1. Schematic illustration of Lip@AUR-ACP-aptPD-L1 construction and its radio-immunotherapeutic effect.
(I) Schematic depiction of the assembly process of ACP and construction of Lip@AUR-ACP-aptPD-L1. As the primary ATP binding sequence in aptATP was simultaneously occupied by the GGAGTATTGC segments in the 5’ end of eCpG and the AGGAA-GG-TAAGA segments located near the MMP-2-cleavable peptidic chain in PNA, the ACP assemblies have high stability in physiological environment with negligible eCpG leakage. (II) Schematic representation of the AND-gate release of eCpG from ACP assembly in Lip@AUR-ACP-aptPD-L1 in the context of IR treatment. (III) Lip@AUR-ACP-aptPD-L1 mediates sequential radiosensitization of melanoma cells and anti-tumorigenic remodeling of tumor immune microenvironment, potentiating enhanced radio-immunotherapeutic efficacy.
Fig. 2
Fig. 2. Physicochemical characterization of the fusogenic liposomes.
a Preparation process and lipid composition of Lip@AUR-ACP-aptPD-L1. b DNA-PAGE analysis regarding eCpG release from aptATP/eCpG complex in response to different ATP concentrations (n = 3 experimental replicates). c Impact of competitive ATP binding on aptATP/eCpG complex via DNA-PAGE analysis (aptATP:eCpG = 2:1) (n = 3 experimental replicates). d DNA-PAGE analysis regarding eCpG release from the ACP assembly (aptATP: eCpG: PNA = 2:1:3) with 200 nM ATP and 5 nM or 10 nM MMP-2 (n = 3 experimental replicates). The yellow box under 200 nM ATP, the blue box under 10 nM MMP-2, and the red box under 200 nM ATP and 10 nM MMP-2. e TEM results of Lip@AUR-ACP-aptPD-L1 stained with 4% phosphotungstic acid (n = 3 experimental replicates). f The stability of Lip@AUR-ACP-aptPD-L1 in pH7.4 PBS buffer at 12–48 h by DLS analysis. The purple color represents the size and the blue color represents the polydispersity index (PDI). g Degradation assessment of Lip@AUR-ACCy5P-aptPD-L1 in DNase 1 or 10% FBS through 50 h incubation. h DNA-PAGE analysis of eCpG release from Lip@AUR-ACP-aptPD-L1 with 200 nM ATP and 5 nM or 10 nM MMP-2 (n = 3 experimental replicates). The yellow box under 200 nM ATP, the blue box under 10 nM MMP-2 and the red box under 200 nM ATP and 10 nM MMP-2. i Fluorescence analysis of eCpGCy5 release from Lip@AUR-ACP-aptPD-L1 with or without 200 nM ATP/10 nM MMP-2 stimulus input. j Fluorescence analysis of eCpGCy5 release from different liposome formulations under different ATP concentrations. I: Lip@AUR-ACCy5-aptPD-L1, II: Lip@AUR-ACCy5P-aptPD-L1, III: Lip@AUR-ACCy5P-aptPD-L1 + 5 nM MMP-2, IV: Lip@AUR-ACCy5P-aptPD-L1 + 10 nM MMP-2. Data are presented as mean values ± SEM (n = 3 experimental replicates for (f, g) and (i, j)). Source data are provided as a Source Data file.
Fig. 3
Fig. 3. Melanoma targeting and membrane fusion performance of Lip@AUR-ACP-aptPD-L1 in vitro based on B16F10/splenocyte co-incubation system.
a Targeting ability of eCpG and aptPD-L1 with the designated cell targets in the B16F10/splenocyte co-incubation system by flow cytometry. b Fusion status of different liposomes to B16F10 cell membranes in the co-culture system at 3, 6, 12, or 18 h of incubation by CLSM (n = 3 experimental replicates). I: Lip@Dil, II: Lip@Dil-ACP, III: Lip@Dil-ACP-aptPD-L1. Red: Dil. Green: Invitrogen CellMask™ Green plasma membrane stain. Blue: DAPI. c Tumor sphere assay on the targeting ability of different samples at 12 h incubation (n = 3 experimental replicates). I: ACCy5P, II: Lip-ACCy5P, III: Lip-ACCy5P-aptPD-L1. d, e Time-dependent changes in ATP and MMP-2 abundance in vivo with Lip@AUR-ACP-aptPD-L1 + 4 Gy IR treatment. (f) Fusion status of different liposomes to B16F10 cell membranes in the co-culture system at 16, 18 or 30 h of incubation by CLSM (n = 3 experimental replicates). 4 Gy IR treatment was applied at 12 h. I: Lip@Dil+IR, II: Lip@Dil-ACP + IR, III: Lip@Dil-ACP-aptPD-L1 + IR. g Time-dependent melanoma-targeted membrane fusion performance of Cy5-Lip@AUR-ACP-aptPD-L1 in vivo. 4 Gy IR treatment was applied after 12 h post intravenous injection (n = 3 experimental replicates). h Schedule of the combinational Lip@AUR-ACP-aptPD-L1 + 4 Gy IR treatment set-up in vitro. Data are presented as mean values ± SEM (n = 3 experimental replicates for (a), n = 3 mice for (de)). Statistical analysis in (a) and (de) was carried out via one-way ANOVA method. * indicates significance at p < 0.05, ** indicates significance at p < 0.01, *** indicates significance at p < 0.001, **** indicates significance at p < 0.0001. Source data are provided as a Source Data file.
Fig. 4
Fig. 4. Evaluation on AND-gate release of eCpG from Lip@AUR-ACP-aptPD-L1 for DC stimulation.
a NUPACK analysis on eCpG secondary structure. bd Molecular docking analysis on the TLR9-binding behaviors of CpG ODN and eCpG. e Flow cytometry analysis on the target binding of different DNA sequences to DCs (n = 3 experimental replicates). I: Control, II: CpG ODN, III: eCpG, IV: mutated CpG ODN, V: mutated eCpG, VI: closed eCpG. f Stimulatory impact of various DNA sequences to DC maturation by flow cytometry analysis (n = 3 experimental replicates). I: Control, II: CpG ODN, III: eCpG, IV: mutated CpG ODN, V: mutated eCpG, VI: closed eCpG. gThe CLSM analysis regarding the effect of PNA complexation on eCpGCy5 release from membrane-bound aptamer assemblies under different conditions (n = 3 experimental replicates). I: 0 nM ATP + 5 nM MMP-2, II: 100 nM ATP + 5 nM MMP-2, III: 0 nM ATP + 10 nM MMP-2, IV: 200 nM ATP + 10 nM MMP-2. h Flow cytometry analysis regarding eCpGCy5 release from membrane-bound aptamer assemblies under different conditions (n = 3 experimental replicates). I: 0 nM ATP + 5 nM MMP-2, II: 100 nM ATP + 5 nM MMP-2, III: 0 nM ATP + 10 nM MMP-2, IV: 200 nM ATP + 10 nM MMP-2. i CLSM analysis regarding PNA complexation on eCpGCy5 released from membrane-bound aptamer assemblies at 16 h incubation in vivo with three mice per group. j Time-dependent analysis on eCpGCy5 release from Lip@AUR-ACCy5P-aptPD-L1 in vivo with three mice per group. k Time-dependent evaluation on DC maturation status (CD11c + CD80 + CD86+) after Lip@AUR-ACP-aptPD-L1 + 4 Gy IR treatment (n = 3 experimental replicates). l, m Time-dependent evaluation on DC maturation status (CD11c + CD80 + CD86+) after Lip@AUR-ACP-aptPD-L1 + 4 Gy IR treatment in vivo with three mice per group. n Treatment schedule for the B16F10-mouse splenocyte co-incubation system for the evaluation of the immunostimulatory effects.
Fig. 5
Fig. 5. Immunostimulatory effect of combined Lip@AUR-ACP-aptPD-L1 and 4 Gy IR treatment in vitro.
a Flow cytometry analysis on the maturation status (CD11c + CD80 + CD86+) of DCs in the co-incubation system after different treatments (n = 3 experimental replicates). b Flow cytometry analysis on T cell activation status (CD3 + CD4 + CD8+) in the co-incubation system after different treatments (n = 3 experimental replicates). cf Secretion levels of immunostimulatory markers including IFN-γ, TNF-α, CXCL10, and IL-2 in the supernatants of the co-culture system after different treatments. g Flow cytometry analysis on the apoptosis of B16F10 cells after different treatments in co-culture system (n = 3 experimental replicates). h γ-H2AX immunofluorescence of IR-treated B16F10 cells after different sample treatments (n = 3 experimental replicates). I: PBS, II: Lip, III: Lip-aptPD-L1, IV: Lip-ACP-aptPD-L1, V: Lip@AUR-aptPD-L1, VI: Lip@AUR-ACP-aptPD-L1. Data in (cf) are presented as mean values ± SEM (n = 3 experimental replicates). Statistical analysis in (cf) was carried out via one-way ANOVA method. * indicates significance at p < 0.05, ** indicates significance at p < 0.01, *** indicates significance at p < 0.001, **** indicates significance at p < 0.0001. Source data are provided as a Source Data file.
Fig. 6
Fig. 6. Anti-tumor effects of Lip@AUR-ACP-aptPD-L1-augmented radio-immunotherapy in vivo.
a Schematic representation of the treatment protocol for B16F10-luc tumor-bearing mice. b Tumor volume analysis throughout the treatment period. I: PBS, II: Lip, III: Lip-aptPD-L1, IV: Lip-ACP-aptPD-L1, V: Lip@AUR-aptPD-L1, VI: Lip@AUR-ACP-aptPD-L1, VII: PBS + IR, VIII: Lip+IR, IX: Lip-aptPD-L1 + IR, X: Lip-ACP-aptPD-L1 + IR, XI: Lip@AUR-aptPD-L1 + IR, XII: Lip@AUR-ACP-aptPD-L1 + IR. c Tumor weight analysis at the end of the treatment period. I: PBS, II: Lip, III: Lip-aptPD-L1, IV: Lip-ACP-aptPD-L1, V: Lip@AUR-aptPD-L1, VI: Lip@AUR-ACP-aptPD-L1. d Survival analysis of mice after different treatments. I: PBS, II: Lip, III: Lip-aptPD-L1, IV: Lip-ACP-aptPD-L1, V: Lip@AUR-aptPD-L1, VI: Lip@AUR-ACP-aptPD-L1, VII: PBS + IR, VIII: Lip + IR, IX: Lip-aptPD-L1 + IR, X: Lip-ACP-aptPD-L1 + IR, XI: Lip@AUR-aptPD-L1 + IR, XII: Lip@AUR-ACP-aptPD-L1 + IR. e Western blotting on the expression levels of related proteins in the tumor tissues with five mice per group. I: PBS, II: Lip, III: Lip-aptPD-L1, IV: Lip-ACP-aptPD-L1, V: Lip@AUR-aptPD-L1, VI: Lip@AUR-ACP-aptPD-L1. f The release level of ATP and MMP-2 in B16F10 tumors after different treatment. I: PBS + IR, II: Lip+IR, III:Lip@AUR + IR, IV: Lip@AUR-aptPD-L1 + IR. g TUNEL staining of tumor tissue samples after treatment with five mice per group. I: PBS, II: Lip, III: Lip-aptPD-L1, IV: Lip-ACP-aptPD-L1, V: Lip@AUR-aptPD-L1, VI: Lip@AUR-ACP-aptPD-L1. Data are presented as mean values ± SEM (n = 5 mice for (bc), n = 6 mice for (d), n = 3 mice for (f)). Statistical analysis in (c, f) was carried out via one-way ANOVA method. * indicates significance at p < 0.05, ** indicates significance at p < 0.01, *** indicates significance at p < 0.001, **** indicates significance at p < 0.0001. Source data are provided as a Source Data file.
Fig. 7
Fig. 7. Mechanism underlying Lip@AUR-ACP-aptPD-L1-augmented radio-immunotherapy in vivo.
ac Flow cytometry analysis on the infiltration of total immune cells (CD45+), DCs (CD11c + CD80 + CD86+), and effector T cells (CD3 + CD4 + CD8+) at the tumor site after different groups treatment with five mice per group. I: PBS, II: Lip, III: Lip-aptPD-L1, IV: Lip-ACP-aptPD-L1, V: Lip@AUR-aptPD-L1, VI: Lip@AUR-ACP-aptPD-L1. d Immunofluorescence images of the extracted tumors showing infiltration of CD8+ T cells after different groups treatment with five mice per group. I: PBS, II: Lip, III: Lip-aptPD-L1, IV: Lip-ACP-aptPD-L1, V: Lip@AUR-aptPD-L1, VI: Lip@AUR-ACP-aptPD-L1. eh The secretion levels of IFN-γ, TNF-α, CXCL10, and IL-2 in mouse serum after treatment with I: PBS, II: Lip, III: Lip-aptPD-L1, IV: Lip-ACP-aptPD-L1, V: Lip@AUR-aptPD-L1, VI: Lip@AUR-ACP-aptPD-L1. Data are presented as mean values ± SEM (n = 3 mice for (eh)). Statistical analysis in (eh) was carried out via one-way ANOVA method. * indicates significance at p < 0.05, ** indicates significance at p < 0.01, *** indicates significance at p < 0.001, **** indicates significance at p < 0.0001. Source data are provided as a Source Data file.
Fig. 8
Fig. 8. Systemic anti-tumor immunity of Lip@AUR-ACP-aptPD-L1 to suppress distal B16F10 tumors.
a Schematic diagram of the treatment schedule for bilateral B16F10 tumor model. b Statistical analysis of distal B16F10 tumor volume during treatment. I: PBS, II: Lip, III: Lip-aptPD-L1, IV: Lip-ACP-aptPD-L1, V: Lip@AUR-aptPD-L1, VI: Lip@AUR-ACP-aptPD-L1, VII: PBS + IR, VIII: Lip + IR, IX: Lip-aptPD-L1 + IR, X: Lip-ACP-aptPD-L1 + IR, XI: Lip@AUR-aptPD-L1 + IR, XII: Lip@AUR-ACP-aptPD-L1 + IR. c Survival analysis of bilateral B16F10 tumor model-bearing mice. I: PBS, II: Lip, III: Lip-aptPD-L1, IV: Lip-ACP-aptPD-L1, V: Lip@AUR-aptPD-L1, VI: Lip@AUR-ACP-aptPD-L1, VII: PBS + IR, VIII: Lip+IR, IX: Lip-aptPD-L1 + IR, X: Lip-ACP-aptPD-L1 + IR, XI: Lip@AUR-aptPD-L1 + IR, XII: Lip@AUR-ACP-aptPD-L1 + IR. df Flow cytometry analysis on the infiltration levels of DCs (CD11c + CD80 + CD86+), effector T cells (CD3 + CD4 + CD8+), and memory CD8+ T cells (CD8 + CD44 + CD62L-) within the distal tumors after different groups treatment with three mice per group. I: PBS, II: Lip, III: Lip-aptPD-L1, IV: Lip-ACP-aptPD-L1, V: Lip@AUR-aptPD-L1, VI: Lip@AUR-ACP-aptPD-L1. Data are presented as mean values ± SEM (n = 3 mice for (b), n = 6 mice for (c)). Source data are provided as a Source Data file.

Similar articles

Cited by

References

    1. Zai W, et al. E. coli membrane vesicles as a catalase carrier for long-term tumor hypoxia relief to enhance radiotherapy. ACS Nano. 2021;15:15381–15394. doi: 10.1021/acsnano.1c07621. - DOI - PubMed
    1. Ding Z, et al. Radiotherapy reduces N-oxides for prodrug activation in tumors. J. Am. Chem. Soc. 2022;144:9458–9464. doi: 10.1021/jacs.2c02521. - DOI - PubMed
    1. Lan Y, et al. Simultaneous targeting of TGF-β/PD-L1 synergizes with radiotherapy by reprogramming the tumor microenvironment to overcome immune evasion. Cancer Cell. 2021;39:1388–1403.e10. doi: 10.1016/j.ccell.2021.08.008. - DOI - PubMed
    1. Zhang P, et al. STING agonist-loaded, CD47/PD-L1-targeting nanoparticles potentiate antitumor immunity and radiotherapy for glioblastoma. Nat. Commun. 2023;14:1610. doi: 10.1038/s41467-023-37328-9. - DOI - PMC - PubMed
    1. Walle T, et al. Radiotherapy orchestrates natural killer cell dependent antitumor immune responses through CXCL8. Sci. Adv. 2022;8:eabh4050. doi: 10.1126/sciadv.abh4050. - DOI - PMC - PubMed