. 2024 Jun 12;15(1):5034.
doi: 10.1038/s41467-024-49390-y.

Enhancing the diagnosis of functionally relevant coronary artery disease with machine learning

Affiliations

Enhancing the diagnosis of functionally relevant coronary artery disease with machine learning

Christian Bock et al. Nat Commun. .

Abstract

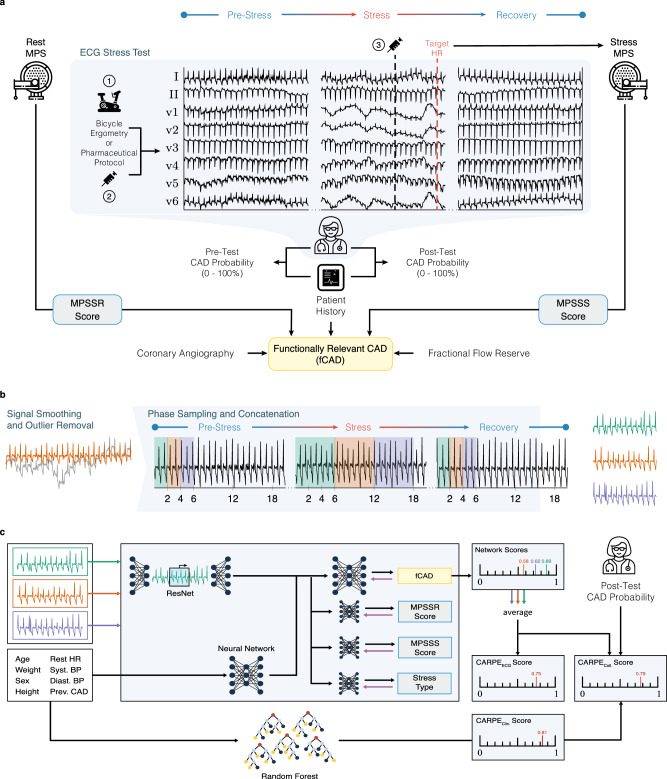
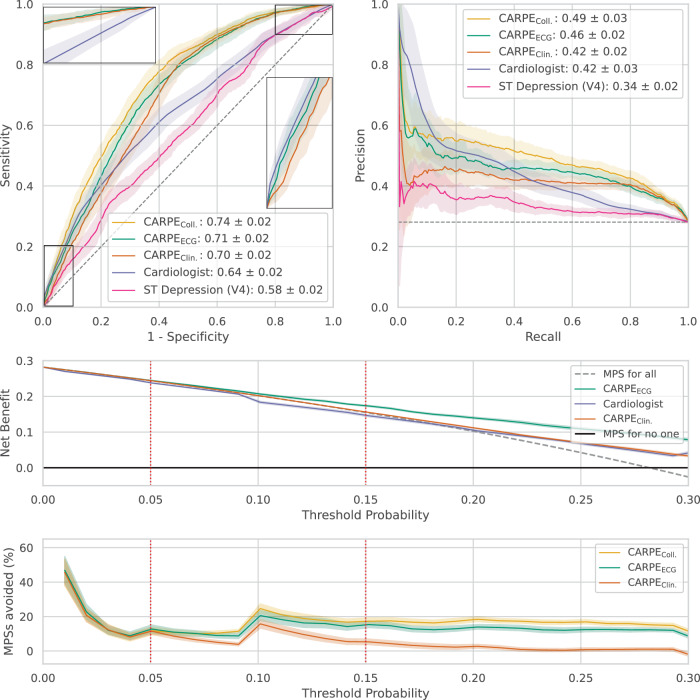
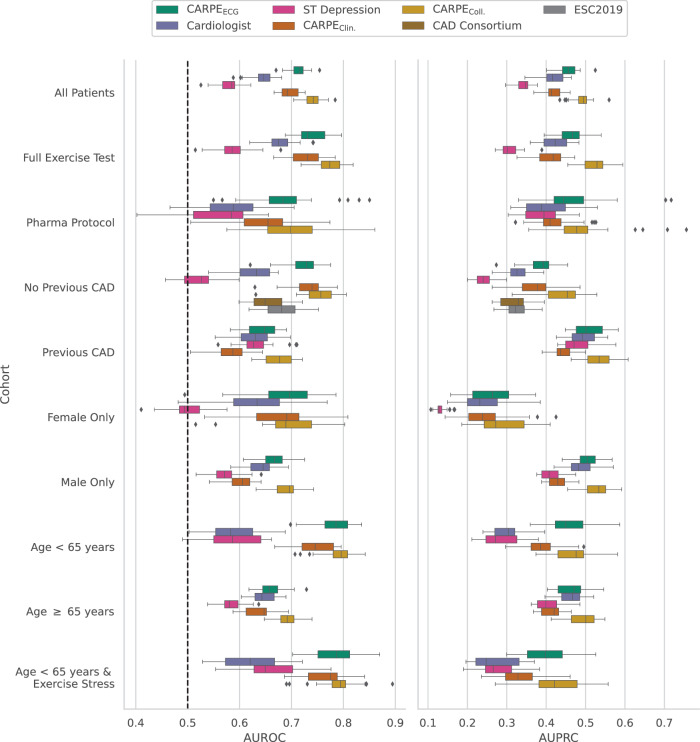
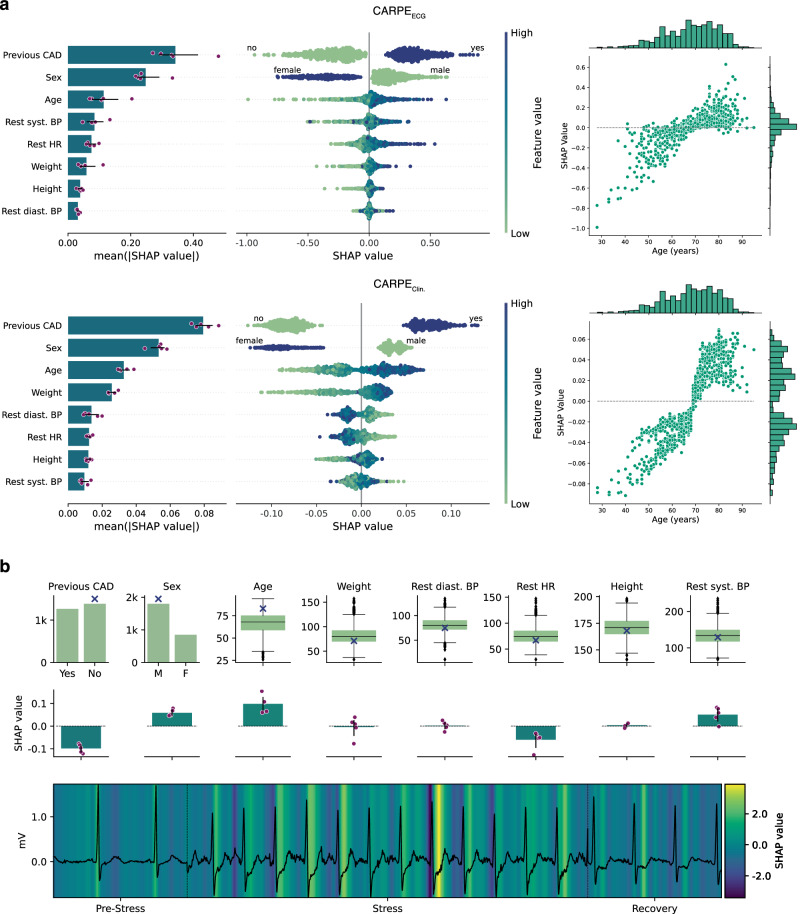
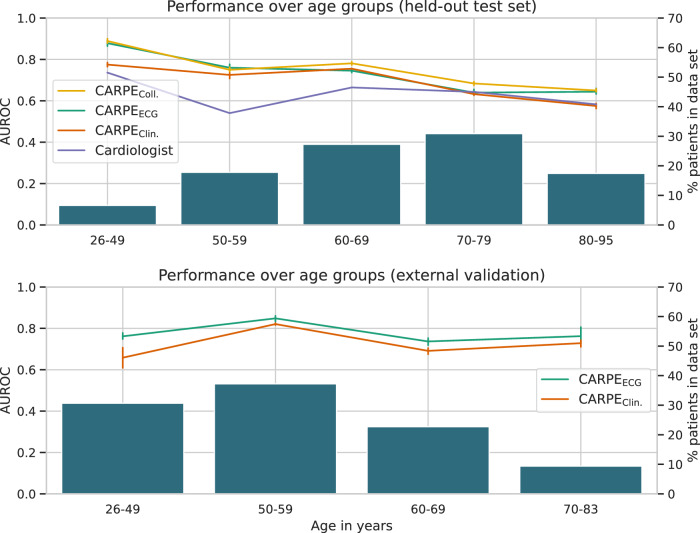
Functionally relevant coronary artery disease (fCAD) can result in premature death or nonfatal acute myocardial infarction. Its early detection is a fundamentally important task in medicine. Classical detection approaches suffer from limited diagnostic accuracy or expose patients to possibly harmful radiation. Here we show how machine learning (ML) can outperform cardiologists in predicting the presence of stress-induced fCAD in terms of area under the receiver operating characteristic (AUROC: 0.71 vs. 0.64, p = 4.0E-13). We present two ML approaches, the first using eight static clinical variables, whereas the second leverages electrocardiogram signals from exercise stress testing. At a target post-test probability for fCAD of <15%, ML facilitates a potential reduction of imaging procedures by 15-17% compared to the cardiologist's judgement. Predictive performance is validated on an internal temporal data split as well as externally. We also show that combining clinical judgement with conventional ML and deep learning using logistic regression results in a mean AUROC of 0.74.


Conflict of interest statement

J.E.W. has no conflict of interest to declare regarding this project and reports grants from Swiss Heart Foundation (FF19097 and F18111) and from the Swiss Academy Medical Sciences. C.M. has no conflict of interest to declare regarding this project and received research support from the Swiss National Science Foundation, the Swiss Heart Foundation, the KTI, the University of Basel, the University Hospital Basel, Abbott, Beckman Coulter, Brahms, Idorsia, Novartis, Ortho Clinical Diagnostics, Quidel, Roche, Siemens, Singulex, and Sphingotec as well as speaker honoraria/consulting honoraria from Amgen, AstraZeneca, Bayer, Beckman Coulter, Boehringer Ingelheim, BMS, Idorsia, Novartis, Osler, Roche, Sanofi, Siemens, and Singulex. The other authors declare no competing interests.

Figures

Fig. 1
Fig. 1. Protocol overview.
a Data acquisition: We highlight the three primary subgroups of exercise stress testing: ① patients who complete the bicycle exercise stress test, ② patients not able to exercise on the bicycle, and for whom a pharmaceutical protocol is used at the beginning of the stress test, and ③ patients starting on the bicycle but need pharmacological support to reach their target heart rate. Doctors perform myocardial perfusion scans at rest (rest MPS), and at the target heart rate (stress MPS). Myocardial perfusion is quantified by the myocardial perfusion scan summed rest score (MPSSR score), and the MPS summed stress score (MPSSS score). The cardiologist estimates the probability of a functionally relevant CAD (fCAD) before and after the stress test (Pre/Post-Test CAD Probability in the figure). The binary label indicating the presence of fCAD (yellow box) is adjudicated by considering the stress test results and additional relevant clinical parameters. b Data Preprocessing: Following smoothing and outlier removal, time series that serve as input to the neural network are constructed by joining short subsequences from different phases of the stress test. For this, 2 s from the pre-stress phase, 6 s from the stress phase, and 2 s from the recovery phase are sampled and concatenated multiple times for a single patient (green, orange, and purple sequences). x-axes represent time in seconds. c Machine Learning: For our neural network approach (CARPEECG), these 2-6-2 sequences are fed into a residual neural network (ResNet). In parallel, the patient’s static clinical data are processed by a 2-layer feedforward network. Four subnetworks are trained on three auxiliary tasks (i.e., MPSSR & MPSSS score as well as stress type prediction) and one main task (fCAD prediction). We average predictions of the main task over all 2-6-2 sequences per patient. Purple arrows in front of each task indicate the direction of the learning signal. The same clinical variables as for CARPEECG are used to train a random forest classifier (CARPEClin.); nodes are coloured to enhance legibility. We combine both predictions with the cardiologist’s judgement in a logistic regression model (CARPEColl.).
Fig. 2
Fig. 2. Diagnostic performance overview.
ROC and PR-curve. Predictive performance of our deep learning-based approach (CARPEECG), a random forest based on clinical data (CARPEClin.), the cardiologist, and ST depression in terms of mean performance ± standard deviation (envelopes) over n = 25 bootstrap draws. The upper plots show that both machine learning approaches outperform the cardiologist in terms of area under the receiver operating characteristic and precision-recall curve. In regions of high specificity (inline plot), the neural network is on par with the cardiologist while CARPEClin. exhibits worse performance. Both machine learning methods outperform the cardiologist’s judgement in regions of high sensitivity (inline plot). Decision Curve: First row: Net benefit plot for CARPEECG (green), CARPEClin. (orange), the cardiologist (purple), a myocardial perfusion scan (MPS) for no patient (black), and MPS for all patients (dashed grey). CARPEColl. is not shown as it is visually indistinguishable from CARPEECG. Net benefit puts both benefit and harm on the same scale. In our case, we consider harm to be inflicted by performing an unnecessary MPS. At a decision threshold of 5%, all approaches lead to a similar net benefit. At the second threshold of 15%, CARPEClin. and the cardiologist demonstrate a net benefit similar to performing MPS on all patients, with CARPEECG leading to a higher net benefit. Second row: Potential MPSs avoided compared to the cardiologist’s strategy: While the conventional ML model and deep learning avoid the approximately same number of MPSs at the decision threshold of 5% (11.5% and 12.8%, respectively), the gap increases at the pre-MPS threshold of 15% (15.3% and 5.3%, respectively). Envelopes in both rows show 95% confidence intervals around the mean over n = 25 bootstrap draws. Source data are provided as a Source Data file.
Fig. 3
Fig. 3. Diagnostic performance subcohort analysis.
Performance breakdown over different subcohorts and n = 25 bootstrap draws. The dashed black line indicates the AUROC of a random classifier. Over the full cohort (All Patients), both CARPEClin. and CARPEECG reach a statistically significantly higher AUROC than the cardiologist. Additionally, the collaborative approach (CARPEColl.) significantly increases predictive performance over CARPEECG. Please refer to Supplementary Table 6 and Supplementary Fig. 4 for more details. Box plots indicate median (middle line), 25th, and 75th percentile (box). Whiskers extend to points that lie within 1.5 IQRs of the lower and upper quartile. Diamonds are outliers. Error bars in the bar plots indicate 95% confidence intervals. Source data are provided as a Source Data file.
Fig. 4
Fig. 4. SHAP value analysis.
a Bar plots show the mean absolute SHAP value for all clinical variables used by our predictors. Purple scatter plots show individual data points. CAD history and sex are the most important clinical features for both classifiers. The central scatter plots show the impact individual feature values have on the prediction score. High feature values are depicted in a dark blue, low values in a light green. SHAP values for an existing CAD history are always positive. Similarly, SHAP values of the “sex” feature are always positive for male patients. We depict SHAP value distributions over all ages in the scatter plots on the right-hand side. b SHAP values for clinical variables and one 2-6-2 sequence of a patient. The first row shows the feature distribution of the development data set (n = 2648) in green. The blue cross marks where in the distribution the patient lies. Second row: SHAP values for the specific patient for each feature over n = 5 splits. The absence of a CAD history and the resting heart rate of 67 BPM result in negative SHAP values. The patient’s sex (male), his age, and systolic blood pressure at rest are associated with higher SHAP values. Last row: One of the patient’s 2-6-2 sequence (black) with the SHAP values of each individual measurement in the background. We show negative SHAP values in dark purple and positive ones in yellow. Dashed black lines mark the borders of pre-stress, stress, and recovery samples. The largest areas of high SHAP values concentrate in the stress phase around the ST-segment. Error bars in all plots indicate 95% confidence intervals over all models from all five splits. Box plots indicate median (middle line), 25th, and 75th percentile (box). Whiskers extend to points that lie within 1.5 IQRs of the lower and upper quartile. Diamonds are outliers. Bar plots show the mean over n = 5 test splits with error bars indicating 95% confidence intervals. Source data are provided as a Source Data file.
Fig. 5
Fig. 5. Diagnostic performance over age groups.
On the x-axes, we show different age groups in the held-out test and external validation set. Left y-axes: area under the receiver operator characteristic (AUROC). Error bars indicate 95% confidence intervals around the mean. Right y-axes: percentage of patients who comprise the respective subgroup of the x-axis. No cardiologist’s judgement is available in the external validation set, hence CARPEColl. cannot be evaluated. The performance difference between random forest and CARPEECG is strongest in the external validation set due to the conventional ML model relying (too) strongly on the “age” variable. Error bars indicate 95% confidence intervals over all models of all five splits. The number of individuals in each bin are 53, 143, 219, 248, 140 for the held-out test set and 281, 341, 208, 86, respectively. Source data are provided as a Source Data file.

References

    1. Townsend N, et al. Cardiovascular disease in europe: epidemiological update 2016. Eur. Heart J. 2016;37:3232–3245. doi: 10.1093/eurheartj/ehw334. - DOI - PubMed
    1. Writing Group Members, et al. Heart disease and stroke statistics-2016 update: a report from the American Heart Association. Circulation. 2016;133:e38–e360. - PubMed
    1. GBD 2017 Disease and Injury Incidence and Prevalence Collaborators. Global, regional, and national incidence, prevalence, and years lived with disability for 354 diseases and injuries for 195 countries and territories, 1990–2017: a systematic analysis for the global burden of disease study 2017. Lancet392, 1789–1858 (2018). - PMC - PubMed
    1. Puelacher C, et al. Diagnostic value of ST-segment deviations during cardiac exercise stress testing: systematic comparison of different ECG leads and time-points. Int. J. Cardiol. 2017;238:166–172. doi: 10.1016/j.ijcard.2017.02.079. - DOI - PubMed
    1. Ladapo JA, Blecker S, Douglas PS. Physician decision making and trends in the use of cardiac stress testing in the United States: an analysis of repeated cross-sectional data. Ann. Intern. Med. 2014;161:482–490. doi: 10.7326/M14-0296. - DOI - PMC - PubMed