

Comparative genomics of Giardia duodenalis sub-assemblage AI beaver (Be-2) and human (WB-C6) strains show remarkable homozygosity, sequence similarity, and conservation of VSP genes
- PMID: 38866814
- PMCID: PMC11169602
- DOI: 10.1038/s41598-024-63783-5
Comparative genomics of Giardia duodenalis sub-assemblage AI beaver (Be-2) and human (WB-C6) strains show remarkable homozygosity, sequence similarity, and conservation of VSP genes
Abstract
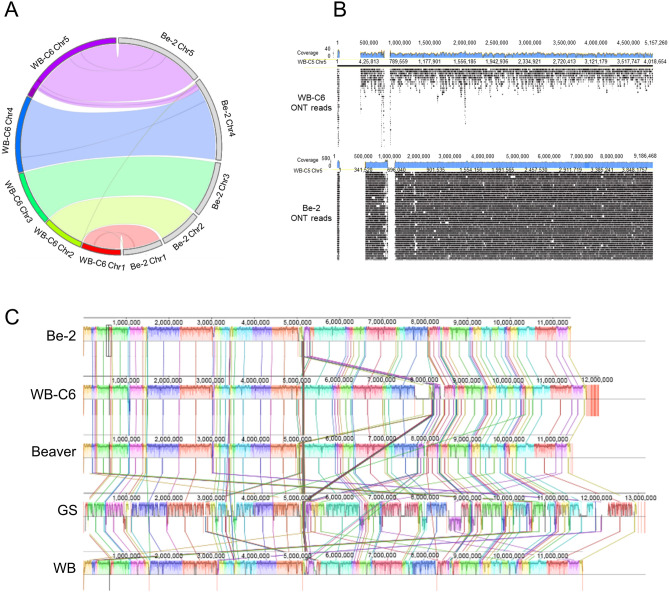
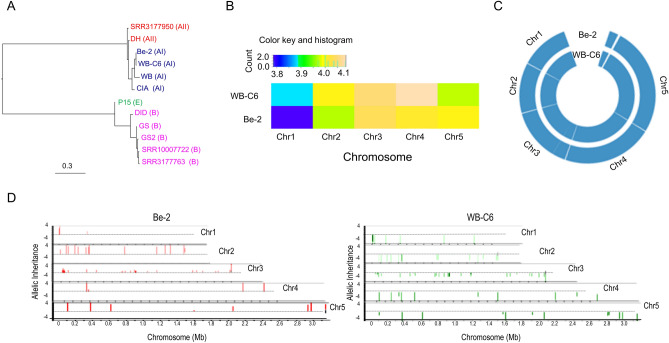
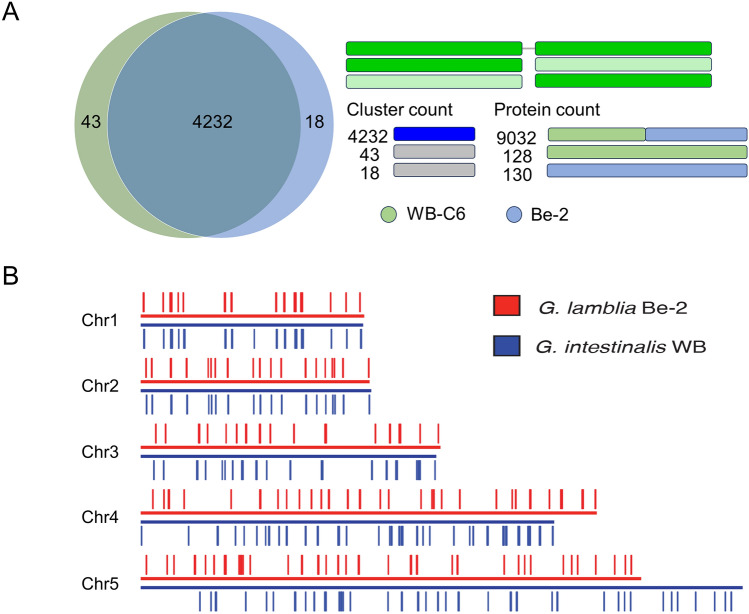
Giardia duodenalis, a major cause of waterborne infection, infects a wide range of mammalian hosts and is subdivided into eight genetically well-defined assemblages named A through H. However, fragmented genomes and a lack of comparative analysis within and between the assemblages render unclear the molecular mechanisms controlling host specificity and differential disease outcomes. To address this, we generated a near-complete de novo genome of AI assemblage using the Oxford Nanopore platform by sequencing the Be-2 genome. We generated 148,144 long-reads with quality scores of > 7. The final genome assembly consists of only nine contigs with an N50 of 3,045,186 bp. This assembly agrees closely with the assembly of another strain in the AI assemblage (WB-C6). However, a critical difference is that a region previously placed in the five-prime region of Chr5 belongs to Chr4 of Be-2. We find a high degree of conservation in the ploidy, homozygosity, and the presence of cysteine-rich variant-specific surface proteins (VSPs) within the AI assemblage. Our assembly provides a nearly complete genome of a member of the AI assemblage of G. duodenalis, aiding population genomic studies capable of elucidating Giardia transmission, host range, and pathogenicity.
Keywords: Giardia; Annotation; Genome assembly; Long-read sequencing; Ploidy; Synteny.
© 2024. This is a U.S. Government work and not under copyright protection in the US; foreign copyright protection may apply.
Conflict of interest statement
The authors declare no competing interests.
Figures

Similar articles
-
Highly contiguous genomes of human clinical isolates of Giardia duodenalis reveal assemblage- and sub-assemblage-specific presence-absence variation in protein-coding genes.Microb Genom. 2023 Mar;9(3):mgen000963. doi: 10.1099/mgen.0.000963. Microb Genom. 2023. PMID: 36976254 Free PMC article.
-
Comparative genomic analyses of freshly isolated Giardia intestinalis assemblage A isolates.BMC Genomics. 2015 Sep 15;16(1):697. doi: 10.1186/s12864-015-1893-6. BMC Genomics. 2015. PMID: 26370391 Free PMC article.
-
Genomic comparisons confirm Giardia duodenalis sub-assemblage AII as a unique species.Front Cell Infect Microbiol. 2022 Oct 17;12:1010244. doi: 10.3389/fcimb.2022.1010244. eCollection 2022. Front Cell Infect Microbiol. 2022. PMID: 36325462 Free PMC article.
-
Host specificity in the Giardia duodenalis species complex.Infect Genet Evol. 2018 Dec;66:335-345. doi: 10.1016/j.meegid.2017.12.001. Epub 2017 Dec 7. Infect Genet Evol. 2018. PMID: 29225147 Review.
-
Giardia duodenalis Virulence - "To Be, or Not To Be".Curr Trop Med Rep. 2021;8(4):246-256. doi: 10.1007/s40475-021-00248-z. Epub 2021 Oct 21. Curr Trop Med Rep. 2021. PMID: 34697581 Free PMC article. Review.
Cited by
-
Cryptosporidium in cattle: Assessing the zoonotic risk.Curr Res Parasitol Vector Borne Dis. 2025 Jun 14;8:100279. doi: 10.1016/j.crpvbd.2025.100279. eCollection 2025. Curr Res Parasitol Vector Borne Dis. 2025. PMID: 40656159 Free PMC article.
-
De Novo Long-Read Genome Assembly and Annotation of the Mosquito Gut-Dwelling Fungus, Smittium minutisporum.Genome Biol Evol. 2024 Dec 4;16(12):evae259. doi: 10.1093/gbe/evae259. Genome Biol Evol. 2024. PMID: 39579072 Free PMC article.
-
A chromosome-scale genome assembly of Giardia duodenalis by long-read sequencing of ten trophozoites.Sci Data. 2025 Jul 1;12(1):1079. doi: 10.1038/s41597-025-05405-x. Sci Data. 2025. PMID: 40592872 Free PMC article.
References
-
- The World Health report 1996—fighting disease, fostering development. World Health Forum18, 1–8 (1997). - PubMed
Publication types
MeSH terms
Substances
Grants and funding
LinkOut - more resources
Full Text Sources
