. 2024 Jun 12;14(1):13492.
doi: 10.1038/s41598-024-63223-4.

MicroRNA-141-regulated KLK10 and TNFSF-15 gene expression in hepatoblastoma cells as a novel mechanism in liver carcinogenesis

Affiliations

MicroRNA-141-regulated KLK10 and TNFSF-15 gene expression in hepatoblastoma cells as a novel mechanism in liver carcinogenesis

Ahmed M Awad et al. Sci Rep. .

Abstract

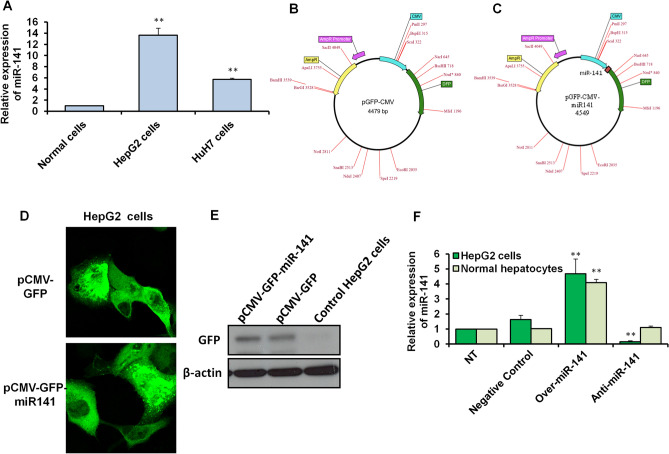
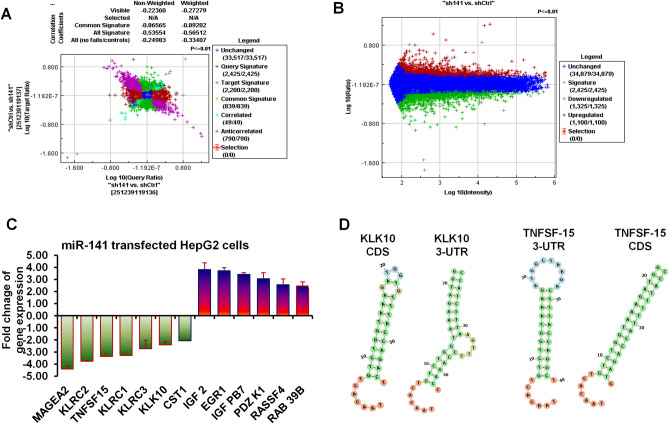
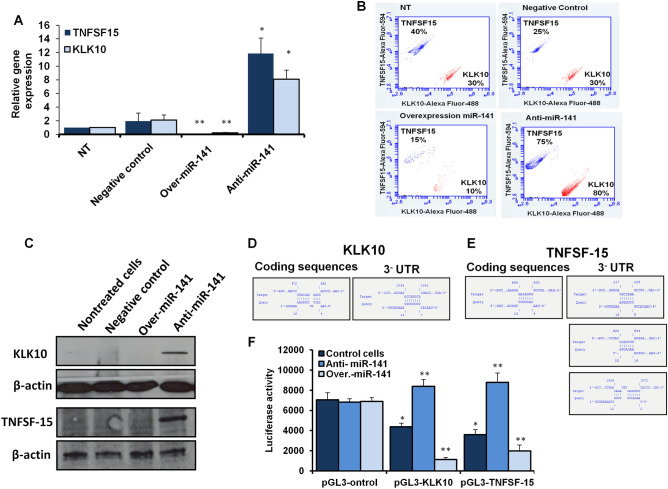
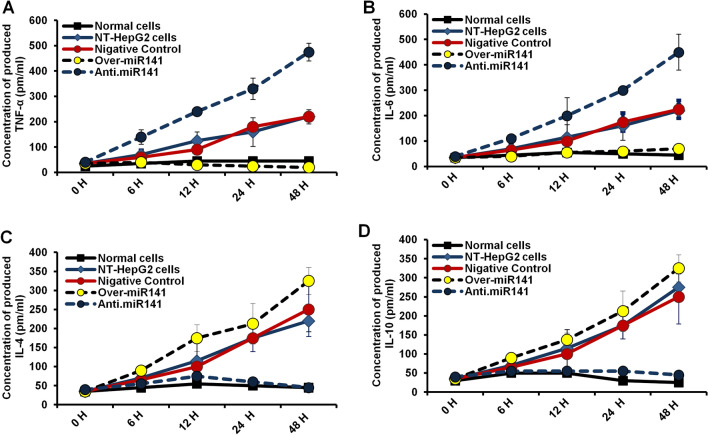
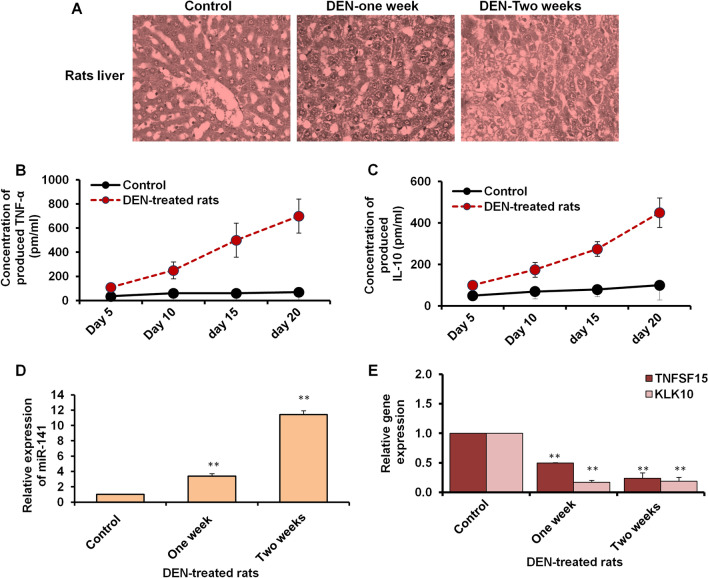
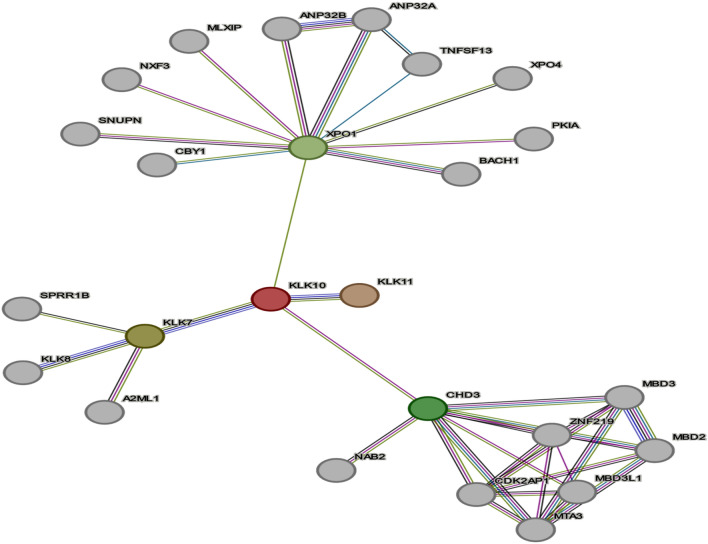
Liver cancer is one of the most pivotal global health problems, leading hepatocellular carcinoma (HCC) with a significant increase in cases worldwide. The role of non-coding-RNA in cancer proliferation and carcinogenesis has attracted much attention in the last decade; however, microRNAs (miRNAs), as non-coding RNA, are considered master mediators in various cancer progressions. Yet the role of miR-141 as a modulator for specific cellular processes in liver cancer cell proliferation is still unclear. This study identified the role of miR-141 and its potential functions in liver carcinogenesis. The level of miR-141 in HepG2 and HuH7 cells was assessed using quantitative real-time PCR (qRT-PCR) and compared with its expression in normal hepatocytes. A new miR-141 construct has been performed in a CMV promoter vector tagged with GFP. Using microarray analysis, we identified the potentially regulated genes by miR-141 in transfected HepG2 cells. The protein profile of the kallikrein-related peptidase 10 (KLK10) and tumor necrosis factor TNFSF-15 was investigated in HepG2 cells transfected with either an inhibitor, antagonist miR-141, or miR-141 overexpression vector using immunoblotting and flow cytometry assay. Finally, ELISA assay has been used to monitor the produced inflammatory cytokines from transfected HepG2 cells. Our findings showed that the expression of miR-141 significantly increased in HepG2 and HuH7 cells compared to the normal hepatocytes. Transfection of HepG2 cells with an inhibitor, antagonist miR-141, showed a significant reduction of HepG2 cell viability, unlike the transfection of miR-141 overexpression vector. The microarray data of HepG2 cells overexpressed miR-141 provided a hundred downregulated genes, including KLK10 and TNFSF-15. Furthermore, the expression profile of KLK10 and TNFSF-15 markedly depleted in HepG2 cells transfected with miR-141 overexpression accompanied by a decreasing level of interleukin 6 (IL-6) and tumor necrosis factor-alpha (TNF-α), indicating the role of miR-141 in HepG2 cell proliferation and programmed cell death. Interestingly, the experimental rats with liver cancer induced by Diethylnitrosamine injection further confirmed the upregulation of miR-141 level, IL-10, and TNF-α and the disturbance in KLK10 and TNFSF-15 gene expression compared with their expression in normal rats. The in-silico online tools, IntaRNA and miRWalk were used to confirm the direct interaction and potential binding sites between miR-141 and identified genes. Thus, the seeding regions of potential targeted sequences was cloned upstream of luciferase reporter gene in pGL3 control vector. Interestingly, the luciferase activities of constructed vectors were significantly decreased in HepG2 cells pre-transfected with miR-141 overexpression vector, while increasing in cells pre-transfected with miR-141 specific inhibitor. In summary, these data suggest the crucial role of miR-141 in liver cancer development via targeting KLK10 and TNFSF-15 and provide miR-141 as an attractive candidate in liver cancer treatment and protection.


Conflict of interest statement

The authors declare no competing interests.

Figures

Figure 1
Figure 1
Establishment of miR-141 overexpression system and its levels in liver cancer cell lines and normal hepatocytes. (A) Quantification of miR-141expression level indicated by fold changes in liver cancer cell lines, including HepG2 cells and HuH7 cells compared with normal hepatocyte cells using qRT- PCR. (B and C) Schematic representation of pCMV-miR-141-GFP and empty construct map showed the cloned full-length miR-141 downstream of CMV promoter cassette using online Molbiotools. (D) Immunofluorescent assay of transfected HepG2 cells with the miR-141 overexpression vector tagged with GFP that markedly represents the GFP signaling in transfected cells. (E) Immunoblotting assay of transected HepG2 cells reveals the protein expression profile of GFP in transfected cells. The protein expression of β-actin severed as loading control. (F) The relative expression level of miR-141 in transfected HepG2 cells and normal hepatocytes in comparison with nontransfected cells (NT) and control-transfected cells. Error panels indicate the standard deviation (STD) of three independent experiments. Student two-tailed t-test used for statistical analysis, (*) indicates P- values ≤ 0.05, (**) indicates P ≤ 0.01, and (***) indicates P ≤ 0.001.
Figure 2
Figure 2
Microarray analysis of transfected HepG2 cells with miR-141 overexpression and its predicted targets. (A) Microarray analysis of gene expression in HepG2 cells transfected with miR-141 overexpression vs. cells transfected with the control vector using a miRNA library from Exiqon. (B) Microarray analysis of gene expression in HepG2 cells transfected with miR-141 overexpression vs. cells transfected with the control vector using oligonucleotides from Ambion. The blue color indicates the sustained gene expression, the red color indicates the upregulated genes, and the green color indicates the downregulated genes. (C) The expression of the most relevant genes to liver cancer indicates the upregulated genes in red columns and downregulated genes in green. Error bars indicate the STD between Exiqon and Ambion data. (D) The potential seeding regions of hsa-miR-141 within the coding sequences and 3-UTR of KLK10 and TNFSF-15 gene sequences that carried out in-silico by miRWalk online tool.
Figure 3
Figure 3
The influence of miR-141 in cell viability and cyotoxicity in transfected HepG2 cells and normal hepatocytes. (A) The cell morphology of HepG2 cells and normal hepatocytes indicated by inverted microscope upon 48 h of transfection with either miR-141 overexpression vector or an inhibitor antagonist miR-141 compared with control-transfected and untreated cells (NT). (B) After transfection with the miR-141 inhibitor or the overexpression vector, the number of living normal hepatocytes and HepG2 cells. (C) Cell viability rate of transfected HepG2 cells with different concentrations of the miR-141 inhibitor or the overexpression vector indicated by the absorbance rate of treated cells with MTT agent. (D) Cell viability rate of transfected normal hepatocyte cells with different concentrations of the miR-141 inhibitor or the overexpression vector indicated by the absorbance rate of treated cells with MTT agent (E) HepG2 cells were transfected with either miR-141 overexpression vector or inhibitor for 48 h, and then cells were stained with (Annexin V+/Propidium Iodide (PI)). The early apoptotic cells and late dead cells were monitored using flow cytometry. (F) The percentage of transfected cells with positive signals for early or late apoptosis and the percentage of dead cells indicated by flow cytometric assay. Error panels indicate the standard deviation (STD) of three independent experiments. Student two-tailed t-test used for statistical analysis(*) indicates P-values ≤ 0.05, (**) indicates P ≤ 0.01, and (***) indicates P ≤ 0.001.
Figure 4
Figure 4
The correlation between the level of miR-141 and KLK10 and TNFSF-15 on gene expression level and protein level in HepG2 cells. (A) The relative gene expression of KLK10 and TNFSF-15 in HepG2 cells transfected with the inhibitor against miR-141 and miR-141 overexpression vector indicated by fold change compared with control-transfected and nontreated cells using qRT-PCR. Error bars indicate the STD of three independent experiments. Student two-tailed t-test used for statistical analysis(*) indicates P-values ≤ 0.05, and (**) indicates P ≤ 0.01. (B) Flow cytometric assay quantifies the kinetic proteins expression profile of KLK10 (the blue dots) and TNFSF-15 (the red dots) in transfected cells compared with control-transfected and nontreated (NT) cells. (C) Western blot analysis shows the protein expression of KLK10 and TNF SF15 in transfected cells compared to control-transfected and nontreated cells. β-actin expression severed as an internal control. (D and E) Schematic representation of miR-141 binding sites and seeding regions (SR) in KLK10 and TNFSF-15 gene sequence indicated by IntaRNA program. (F) In HepG2 cells pre-transfected with miR-141 overexpressing vector or specific inhibitor, the luciferase activities upon cotransfection with luciferase reporter constructs, pGL3-KLK10 or pGL3-TNFSH-15 compared with cells cotransfected with pGL3-control vector. Error bars reveal the STD of three replicates. Student two-tailed t-test used for statistical analysis, (*) indicates P-values ≤ 0.05, and (**) indicates P ≤ 0.01.
Figure 5
Figure 5
Levels of produced inflammatory cytokines in transfected HepG2 cells. (A) The concentration of TGF-β (pm/ml) produced in the fluid media of transfected HepG2 cells in response to the expression level of miR-141 at the indicated time points and compared with nontreated cells (NT) and normal hepatocytes. (B) The concentration of IL-8 in the culture media of transfected HepG2 cells simultaneously post-transfection compared with NT cells and normal hepatocytes. (C and D) At the same time points and compared with NT cells and normal hepatocytes, the concentration of IL-4 and IL-10 in the fluid media of transfected HepG2 cells points to post-transfection, respectively. The Expression rate of IL-4 and IL-10 was elevated remarkably with the overexpression of miR-141, while their expression decreased with transfection with anti-miR141.
Figure 6
Figure 6
In-vivo study of DEN-induced liver cancer in rats. (A) Histological analysis of a liver section of albino rats that were injected with a single dose of DEN either for 1 week, represented a mild swelling or 2 weeks, which revealed hepatic cancer cells in comparison with the liver section of control rats. (B and C) The level of serum TNF-α and IL-10 in rats with liver cancer in response to DEN treatment at the indicated schedules compared with their concentration in the control rats. Error bars indicate the STD of two sacrificed rats. (D) The relative expression level of miR-141 in liver cells of DEN-treated rats for 1 or 2 weeks in comparison with control-treated rats. (E) The relative expression of KLK10 and TNFSF-15 genes in liver cells of DEN-treated rats at 1 or 2 weeks compared with control-treated rats. Error bars indicate the STD of two sacrificed rats. Student two-tailed t-test was used to evaluate the significance of indicated values. (**) indicates that the P value is ≤ 0.01.
Figure 7
Figure 7
The schematic representation of KLK10 and other proteins interaction. The colored nodes meant the direct interaction/s. The shortlisted targeted genes by miR-141 were selected from the microarray and subjected to Search Tool for the Retrieval of Interacting Genes (STRING) 12 version database analyses. STRING constructed a network model that allows displaying the interaction of all proteins. This analysis is connected to the KEGG and the Gene Ontology (GO) databases to cluster the shortlisted genes as input into various pathways and biological processes. (The red line indicates the presence of fusion evidence, the green line refers to the neighborhood evidence, the blue line shows the co-occurrence evidence, the purple line indicates the experimental evidence, the yellow line refers to the mining evidence, the light blue line suggests the database evidence and black line indicates the co-expression evidence).

References

    1. Peng Y, Croce CM. The role of microRNAs in human cancer. Signal Transduct. Target. Ther. 2016;1:15004. doi: 10.1038/sigtrans.2015.4. - DOI - PMC - PubMed
    1. Ghafouri-Fard S, et al. Exploring the role of non-coding RNAs in autophagy. Autophagy. 2022;18:949–970. doi: 10.1080/15548627.2021.1883881. - DOI - PMC - PubMed
    1. Shi T, et al. Evaluating the effect of lenvatinib on sorafenib-resistant hepatocellular carcinoma cells. Int. J. Mol. Sci. 2021;22:13071. doi: 10.3390/ijms222313071. - DOI - PMC - PubMed
    1. Ghafouri-Fard S, et al. A review on the role of PRNCR1 in human disorders with an especial focus on cancer. Pathol. Res. Pract. 2022;237:154026. doi: 10.1016/j.prp.2022.154026. - DOI - PubMed
    1. Maher E, et al. Hsa-miR-21-mediated cell death and tumor metastases: A potential dual response during colorectal cancer development. Middle East J. Cancer. 2020;11:483–492.

MeSH terms