. 2024 Jun 12;7(1):135.
doi: 10.1038/s42004-024-01213-3.

Carbenoid-involved reactions integrated with scaffold-based screening generates a Nav1.7 inhibitor

Affiliations

Carbenoid-involved reactions integrated with scaffold-based screening generates a Nav1.7 inhibitor

Jirong Shu et al. Commun Chem. .

Abstract

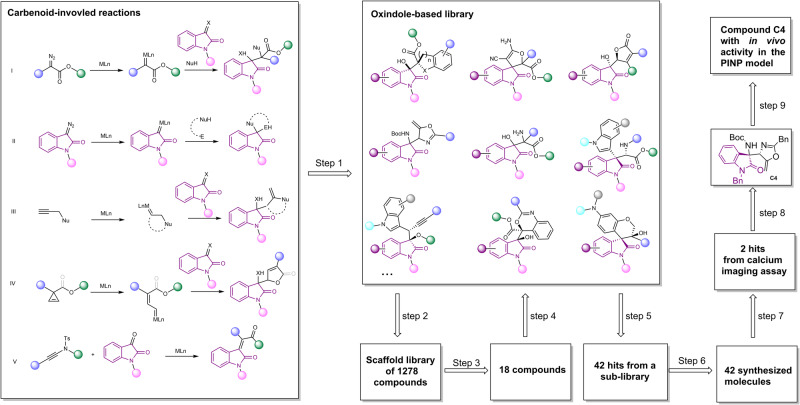
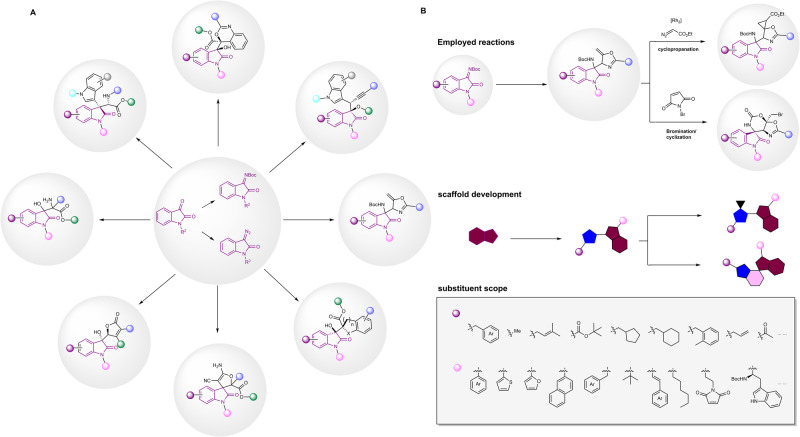
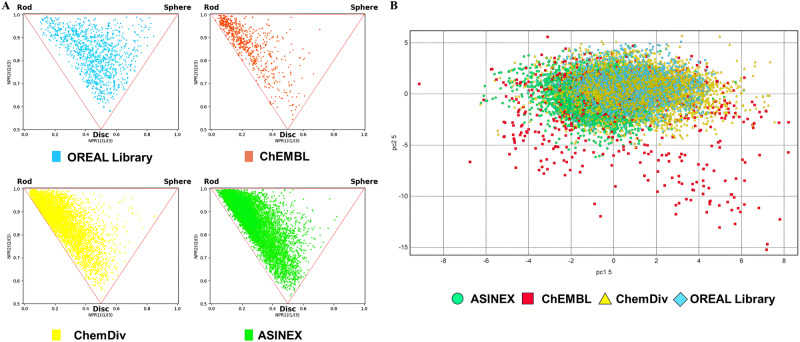
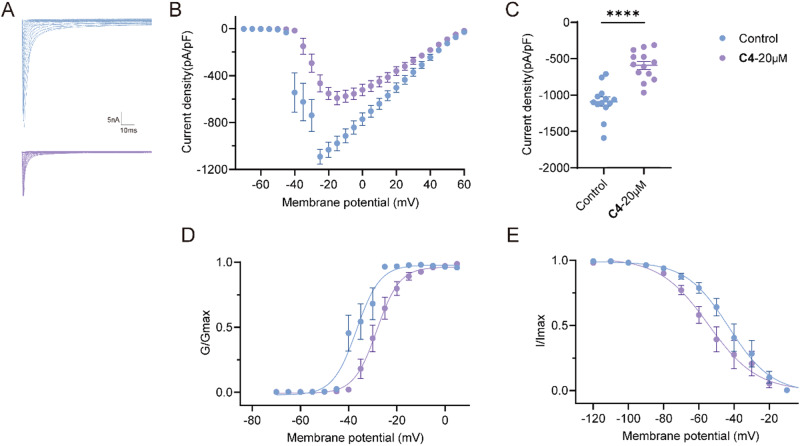
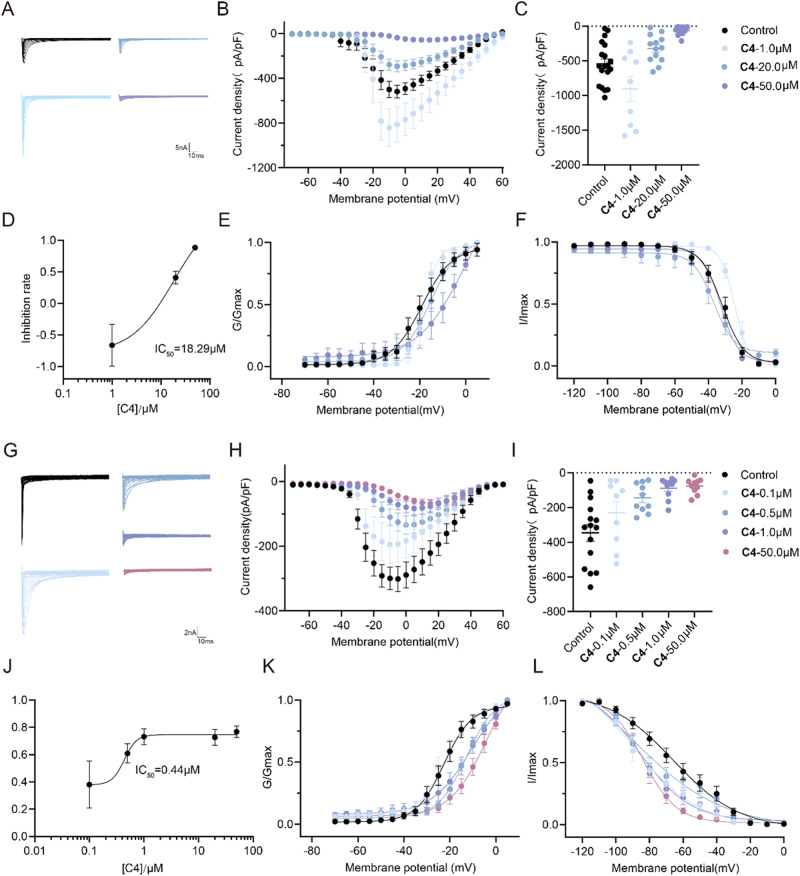
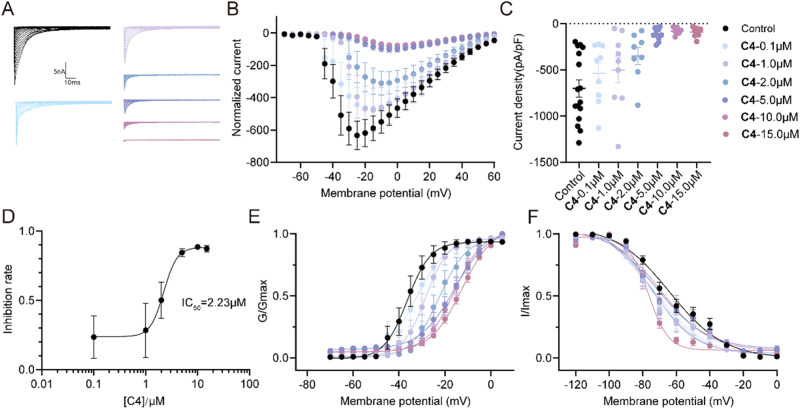
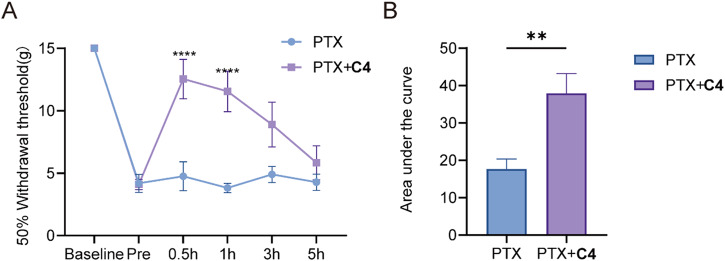
The discovery of selective Nav1.7 inhibitors is a promising approach for developing anti-nociceptive drugs. In this study, we present a novel oxindole-based readily accessible library (OREAL), which is characterized by readily accessibility, unique chemical space, ideal drug-like properties, and structural diversity. We used a scaffold-based approach to screen the OREAL and discovered compound C4 as a potent Nav1.7 inhibitor. The bioactivity characterization of C4 reveals that it is a selective Nav1.7 inhibitor and effectively reverses Paclitaxel-induced neuropathic pain (PINP) in rodent models. Preliminary toxicology study shows C4 is negative to hERG. The consistent results of molecular docking and molecular simulations further support the reasonability of the in-silico screening and show the insight of the binding mode of C4. Our discovery of C4 paves the way for pushing the Nav1.7-based anti-nociceptive drugs forward to the clinic.


Conflict of interest statement

The authors declare no competing interests.

Figures

Fig. 1
Fig. 1. Current development of Nav1.7 inhibitors.
Three types of inhbitors have been developed including: convetional VGSC inhibitors, sulphonamide derivatives and acyl sulphonamide derivatives.
Fig. 2
Fig. 2. Development of the OREAL based on the CIRs.
Top: the advantages of CIRs for building libraries; Middle: the representative starting materials and products of CIRs; Bottom: The rational of selecting oxindole scaffold.
Fig. 3
Fig. 3. Workflow of discovery of compound C4 as a Nav1.7 inhibitor.
Step 1: Substrate scope directed construction of OREAL via rdkit and OREAL characterization; Step 2: Extraction of scaffolds; Step 3: Molecular docking to Nav 1.7; Step 4: Back to OREAL to search for molecules with desired scaffolds; Step 5: Molecular docking to Nav 1.7 again; Step 6: Organic synthesis of hits; Step 7: Calcium imaging assay screening; Step 8: Nav1.7 inhibitory activity assessment and molecular simulations; Step 9: Investigation of in vivo activity on the PINP mice model.
Fig. 4
Fig. 4. Construction and characterization of OREAL.
A CIRs of 22 papers were employed to build the OREAL. B Example of substituents of compound and its derivatives. All derivations shown were from one paper. The derivable sites have been pointed out and available substituents were reported in paper. All collected works are shown in Supplementary Table 1.
Fig. 5
Fig. 5. Characterization of OREAL and commercial library.
A Principal Moment of Inertia (PMI) analysis of four libraries: OREAL (Blue), ChEMBL (Red), ChemDiv (yellow) and ASINEX (green). B PCA analysis of different compound libraries. Different libraries have been shown in different colors: OREAL (Blue), ChEMBL (Red), ChemDiv (yellow) and ASINEX (green). The loadings of PC1 and PC2 are listed in Supplementary Fig. 6. 11 descriptors were used for PCA, including hydrogen bond donors (HBD), hydrogen bond acceptors (HBA), number of rotatable bonds (RB), molecular weight (MW), octanol/water partition coefficient (logP(o/w)), and topological polar surface area (TPSA), number of heavy atom (NH), number of chiral center (chiral), fraction of rotatable bond (FRB), number of ring(ring) and number of aromatic atom (NA). Each library’s PCA analysis is shown separately in four independent figures in Supplementary Fig. 7.
Fig. 6
Fig. 6. C4 inhibited total Na+ currents in rat DRG neurons.
A Representative traces of Na+ currents from DRG sensory neurons treated with 0.1% DMSO (control) or 20 μM C4. Currents were evoked by 150 ms pulses between −70 and +60 mV. B Summary of the normalized (pA/pF) sodium current density versus voltage relationship. C Normalized peak currents from DRG sensory neurons treated as indicated (****P < 0.0001, unpaired two-tailed Student’s t test, n > 12 cells per condition). Boltzmann fits for normalized conductance voltage relations for voltage dependent activation (D) and inactivation (E) of sensory neurons treated as indicated. Asterisks indicate statistical significance compared with cells treated with 0.1% DMSO. Values for V1/2, the voltage of half-maximal inactivation and activation, and the slope factors (k) were derived from Boltzmann distribution fits to the individual recordings and were averaged to determine the mean (±SEM) voltage dependence of steady-state inactivation and activation, respectively. Source data of this figure can be found in supplementary data 1.
Fig. 7
Fig. 7. The effect of C4 on TTX-R channels and TTX-S channels in DRG neurons.
A Representative traces of TTX-R Na+ currents from DRG sensory neurons treated with 0.1% DMSO (Control) or 1 μM, 20 μM or 50 μM C4. B Summary of the normalized (pA/pF) TTX-R sodium current density versus voltage relationship. C Normalized peak currents from DRG sensory neurons treated as indicated (n > 8 cells per condition, one-way ANOVA test, 1 μM C4, P = 0.8335; 20 μM C4, P = 0.3122, 50 μM C4, ****P < 0.0001). D Concentration curve of inhibition rate by C4 on TTX-R Na+ currents in DRG neurons. Boltzmann fits for normalized conductance voltage relations for voltage dependent activation (E) and inactivation (F) of sensory neurons treated as indicated. Asterisks indicate statistical significance compared with cells treated with 0.1% DMSO. G Representative traces of TTX-S Na+ currents from DRG sensory neurons treated with 0.1% DMSO (Control) or 0.1 μM, 0.5 μM, 1 μM or 50 μM C4. H Summary of the normalized (pA/pF) TTX-R sodium current density versus voltage relationship. I Normalized peak currents from DRG sensory neurons treated as indicated (n > 8 cells per condition, one-way ANOVA test, 0.1 μM C4, P = 0.3917; 0.5 μM C4, P = 0.0632;1 μM C4, ***P = 0.0008, 50 μM C4, ***P = 0.0005). J Concentration curve of inhibition rate by C4 on TTX-S Na+ currents. Boltzmann fits for normalized conductance voltage relations for voltage dependent activation (K) and inactivation (L) of sensory neurons treated as indicated. Source data of this figure can be found in supplementary data 2.
Fig. 8
Fig. 8. C4 selectively targeted Nav1.7 to inhibit Na+ currents.
A Representative traces of Nav1.7 currents from Nav1.7-transfected HEK293 cell line treated with 0.1% DMSO (Control) or 0.1 μM, 1.0 μM, 2.0 μM, 5.0 μM, 10.0 μM or 15.0 μM C4. B Summary of the normalized (pA/pF) Nav1.7 current density versus voltage relationship. C Normalized peak currents from Nav1.7-transfected HEK293 cell line treated as indicated (n > 7 cells per condition, one-way ANOVA test, 0.1 μM C4, P = 0.8128; 1.0 μM C4, P = 0.7864; 2.0 μM C4, P = 0.0799; 5.0 μM C4, ****P < 0.0001; 10.0 μM C4, ****P < 0.0001; 15.0 μM C4, ****P < 0.0001). D Concentration curve of inhibition rate by C4 on Nav1.7 in Nav1.7-transfected HEK293 cell line. Boltzmann fits for normalized conductance voltage relations for voltage dependent activation (E) and inactivation (F) of Nav1.7-transfected HEK293 cell line treated as indicated. Source data of this figure can be found in supplementary data 3.
Fig. 9
Fig. 9. C4 reversed PINP.
A The 50% paw withdraw threshold of adult male rat (n = 6) were measured at 21 days post PTX-injected. B Area under curve for mechanical pain behavior. Data are presented as means ± SEM. Asterisks indicate statistical significance compared with vehicle treatment (PTX, 17.7 ± 2.7; C4, 37.95 ± 5.3; **P < 0.01 and ****P < 0.0001; two-way ANOVA with Sidak’s post hoc test). The experimenter was blinded to the treatment condition. Source data of this figure can be found in supplementary data 4.
Fig. 10
Fig. 10. Binding mode of ligand C4.
The binding model of C4-5EK0 complex shows in cartoon model, surface model and 2D interaction picture. The ligand C4 mainly have interaction with Tyr1537, Trp1538 and Arg1602 in magnified docking pose.

Similar articles

Cited by

References

    1. Gardill, B. et al. Nanodisc technology facilitates identification of monoclonal antibodies targeting multi-pass membrane proteins. Sci. Rep. 10, 1130 (2020). - PMC - PubMed
    1. Hameed S. Nav1.7 and Nav1.8: Role in the pathophysiology of pain. Mol. Pain. 2019;15:174480691985880. doi: 10.1177/1744806919858801. - DOI - PMC - PubMed
    1. Dib-Hajj SD, Yang Y, Black JA, Waxman SG. The NaV1.7 sodium channel: from molecule to man. Nat. Rev. Neur. 2012;14:49–62. doi: 10.1038/nrn3404. - DOI - PubMed
    1. Toledo-Aral JJ, et al. Identification of PN1, a predominant voltage-dependent sodium channel expressed principally in peripheral neurons. Pro. Nat. Aca. Sci. 1997;94:1527–1532. doi: 10.1073/pnas.94.4.1527. - DOI - PMC - PubMed
    1. Weiss J, et al. Loss-of-function mutations in sodium channel Nav1.7 cause anosmia. Nature. 2011;472:186–190. doi: 10.1038/nature09975. - DOI - PMC - PubMed