. 2024 Jun 12;14(1):13524.
doi: 10.1038/s41598-024-63314-2.

Induction and antiviral activity of ferret myxovirus resistance (Mx) protein 1 against influenza A viruses

Affiliations

Induction and antiviral activity of ferret myxovirus resistance (Mx) protein 1 against influenza A viruses

Rubaiyea Farrukee et al. Sci Rep. .

Abstract

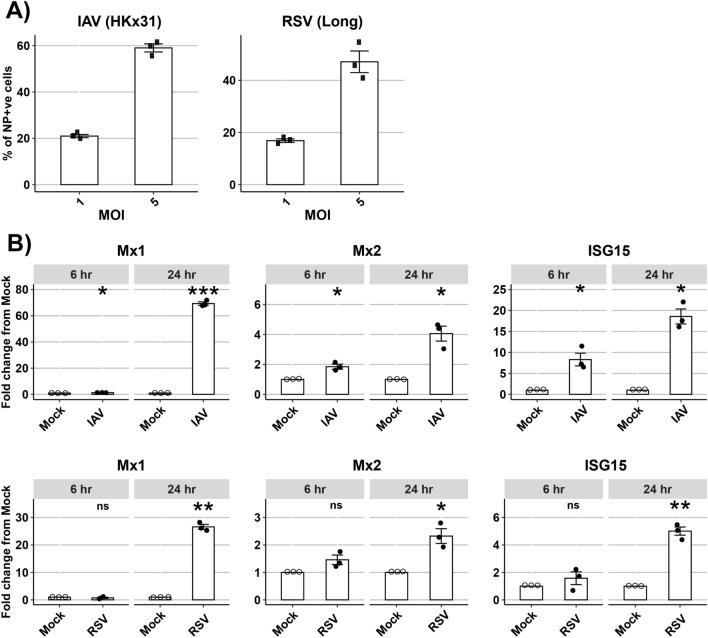
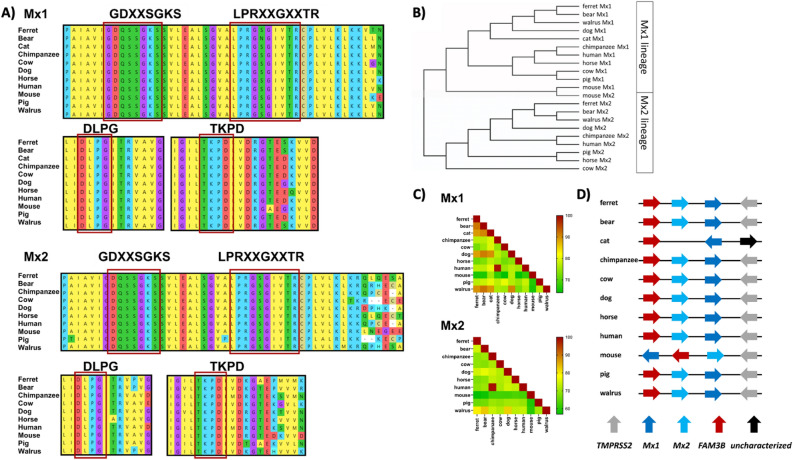
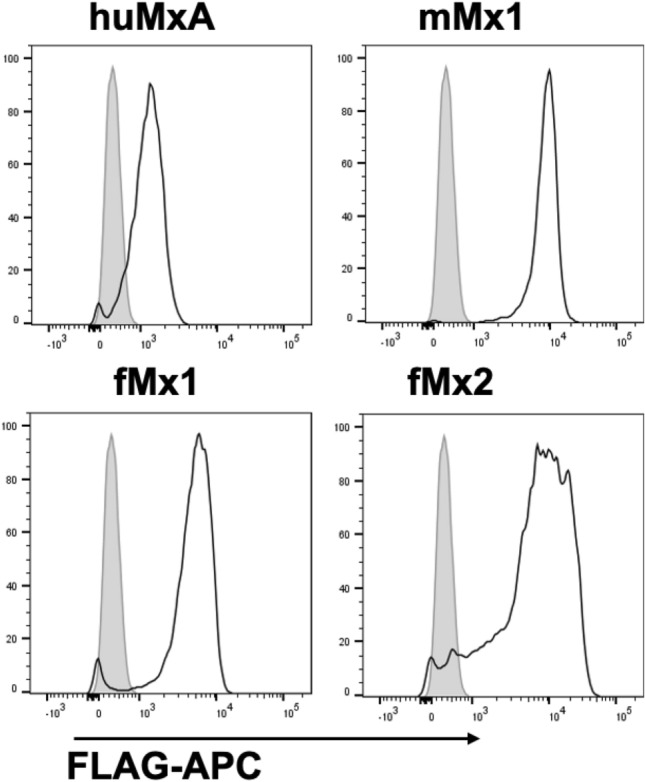
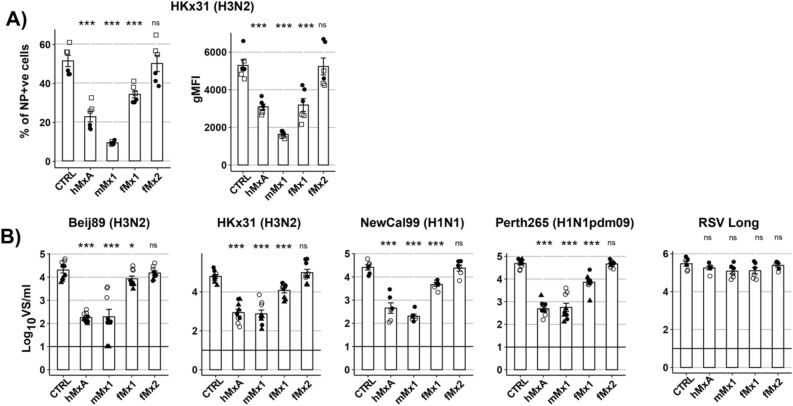
Myxovirus resistance (Mx) proteins are products of interferon stimulated genes (ISGs) and Mx proteins of different species have been reported to mediate antiviral activity against a number of viruses, including influenza A viruses (IAV). Ferrets are widely considered to represent the 'gold standard' small animal model for studying pathogenesis and immunity to human IAV infections, however little is known regarding the antiviral activity of ferret Mx proteins. Herein, we report induction of ferret (f)Mx1/2 in a ferret lung cell line and in airway tissues from IAV-infected ferrets, noting that fMx1 was induced to higher levels that fMx2 both in vitro and in vivo. Overexpression confirmed cytoplasmic expression of fMx1 as well as its ability to inhibit infection and replication of IAV, noting that this antiviral effect of fMx1was modest when compared to cells overexpressing either human MxA or mouse Mx1. Together, these studies provide the first insights regarding the role of fMx1 in cell innate antiviral immunity to influenza viruses. Understanding similarities and differences in the antiviral activities of human and ferret ISGs provides critical context for evaluating results when studying human IAV infections in the ferret model.


Conflict of interest statement

The authors declare no competing interests.

Figures

Figure 1
Figure 1
Nucleotide Alignment (MUSCLE) of predicted mRNA transcript variants of (A) fMx1 and (B) fMx2. Grey bars indicate areas of nucleotide match, black bars indicate nucleotide mismatch and grey lines show sequence deletions. In A/B, orange triangles indicate generic Mx1/2 primers used for qPCR. Note that X5 is truncated at its N-terminus relative to X1-X4. In A, green triangles indicate primers to amplify fMx1(X1-X4) (C, Primer set 1) and the blue triangle indicates forward primer specific for fMx1(X5) used with generic reverse Mx1 primer (green) to amplify fMx1(X5) (C, Primer set 2). (C) Agarose gel showing predicted size and actual PCR products generated from FRL cells 24 h after stimulation with ferret IFN-a using primer set 1 or 2. The full image of the gel is shown as Supplementary data 1. (D) Protein alignment of first 150 amino acids of different mammalian Mx proteins with translated ORFs of fMx1(X4) and (X5). Red boxes highlight leucine (L) at residue 41 (*) as well as signaling domains GDXXSGKS and LPRXXGXXTR, which are present in fMx1(X4) but not (X5). The first methionine (M) of fMx1(X5) ORF is marked with ‘ + ’.
Figure 2
Figure 2
Induction of ISGs following treatment of ferret FRL cells in vitro. (A) FRL cells were treated with recombinant ferret IFN-a for 6 or 24 h and then total RNA was extracted and mRNA levels of ferret Mx1, Mx2, ISG15 and GAPDH (housekeeping gene) were determined by qPCR. Data show fold change relative to mock-treated cells. (B) FRL cells were transfected with RIG-I agonist (3pRNA) or control (ctrl) RNA for 6 or 24 h and mRNA levels of ferret ISGs and GAPDH were determined by qPCR. Data show fold change relative to ctrl. Representative data from triplicate samples in one of three independent experiments are shown. Wilcoxon Rank Sum test was used to calculate statistical differences. * p < 0.05, ** p < 0.01, *** p < 0.001.
Figure 3
Figure 3
Induction of ferret ISGs following infection of FRL cells with respiratory viruses in vitro. (A) FRL cells were infected with IAV (HKx31) or RSV (Long) at the MOIs indicated (1 or 5) and the percentage of virus-infected cells were determined at 8 or 16 h post infection (hpi), respectively, by staining for viral NP protein and flow cytometry. Data from triplicate samples in one of two independent experiments are shown. (B) FRL cells were infected with either IAV (HKx31) or RSV (Long) at MOI = 5 for 6 or 24 h and then total RNA was extracted and mRNA levels of ferret Mx1, Mx2, ISG15 and GAPDH (housekeeping gene) were determined by qPCR. Upregulation of ferret ISGs was calculated relative to mock-infected cells. Representative data from one of two independent experiments with triplicate samples is shown. Wilcoxon Rank Sum test was used to calculate statistically significant upregulation of ISGs after virus infection compared to mock. * p < 0.05, ** p < 0.01, *** p < 0.001, ns = Not significant.
Figure 4
Figure 4
Induction of ferret ISGs in vivo following IAV infection. Ferrets (n = 3–4/group) were mock-infected or infected with with 107 PFU of IAV (A/Perth/265/2009 (H1N1pdm09)) and 6 or 24 h later, lungs and nasal turbinates were removed for analysis of total RNA (by qPCR). (A, B) Baseline mRNA expression of ferret ISGs relative to housekeeping gene (GAPDH) were measured in RNA extracted from (A) nasal turbinates of mock-infected ferrets. Data points from individual animals are shown (n = 4) or (B) lung lobes from mock-infected ferrets (n = 3, designated F1, F2 and F3). Data points from 5 individual lung lobes/animal are shown. (C, D) Expression of ferret (i) Mx1, (ii) Mx2 and (iii) ISG15 (iv) IAV M gene in nasal turbinates. Data for i), ii) and iii) are shown as fold change relative to mock-treated animals (assigned a value of 1) after normalizing to housekeeping gene (GAPDH)). Data for iv) has been log transformed and expressed as fold change. (C) Data from individual animals are shown (n = 4/group). (D) Data from mock-infected animals have been pooled while data from individual IAV-infected ferrets (F1-F4, 5 lobes/animal) are shown. Statistical analysis was performed using Wilcoxon rank sum test. * p < 0.05, ** p < 0.01, *** p < 0.001, ns = Not significant.
Figure 5
Figure 5
Multiple alignments of Mx1 and Mx2 proteins from different species. (A) Predicted amino acid sequences for species indicated were aligned by performing a MUSCLE algorithm using the Molecular Evolutionary Genetics Analysis (MEGA X) software. Conserved regions in the GTPase domain are marked. (B) Phylogenetic trees based on alignment from (A) were generated by Maximum Likelihood methods which show the relative evolutionary history of Mx proteins amongst different species. (C) Heatmap showing the percent homology between Mx proteins from different species, include human, mouse and ferret. (D) Representation of the Mx gene locus of ferrets and other mammalian species. Flanking genes are TMPRSS2 and FAM3B. Arrow direction indicates the orientation of a particular gene. For all these analyses, the following protein sequences were used: fMx1 and fMx2 (Mustela putorius furo Mx1: XP_004762249.1, Mx2: XP_012916740.1), bear (Ursus arctos horribilis Mx1: XP_026356328.1, Ursus arctos Mx2: XP_026356450), cat (Felis catus Mx1: XP_023094481.1), chimpanzee (Pan troglodytes Mx1: NP_001266765.1, Mx2 isoform X2: XP_001171751.3), cow (Bos taurus Mx1: NP_776365.1, Mx2: NP_776366.1), dog (Canis lupus familiaris Mx1: NP_001003134.1, Mx2: XP_038299486.1) horse (Equus caballus Mx1: NP_001075961.1, Mx2: XP_005606216.2), human (Homo sapiens Mx1 isoform a: NP_001138397.1, Mx2: NP_002454.1), mouse (Mus musculus Mx1: NP_034976.1, Mx2: Q9WVP9.2), pig (Sus scrofa Mx1: NP_999226.2, Mx2: A7VK00.1) and walrus (Odobenus rosmarus divergens Mx1 isoform X1: XP_004406610.1, Mx2: XP_004406645.1).
Figure 6
Figure 6
Intracellular localisation of human, mouse or ferret Mx proteins following HeLa cell transfection. Cells were transfected with pcDNA3.1 vectors expressing huMxA, mMx1, fMx1 or fMx2, each with a N-terminal FLAG tag. At 24 h post-transfection cells were fixed and stained for intracellular (i) DAPI and (ii) FLAG-tagged Mx proteins. Representative images are shown at 63 × magnification and acquired on Zeiss LSM780 confocal microscope.
Figure 7
Figure 7
Generation of 293 T cells with stable overexpression of Mx proteins. 293 T cells were transfected with pcDNA3.1-mCherry vectors expressing huMxA, mMx1, fMx1 or fMx2, each with a N-terminal FLAG tag, or with the same vector expressing chicken ovalbumin with no FLAG tag as a control (CTRL). Stable transfectants were selected in the presence of hygromycin and enriched by sorting for mCherry+ cells. Cells were fixed and stained for intracellular expression of FLAG-tagged proteins and examined by flow cytometry. After gating on live mCherry + cells, FLAG expression was determined in different Mx-expressing cell lines (white histograms) relative to CTRL cells (grey histogram).
Figure 8
Figure 8
Anti-IAV activity of human, mouse and ferret Mx proteins. (A) CTRL 293 T cells or cells overexpressing different Mx proteins were infected with IAV (HKx31, MOI 2.5) for 8 h, then fixed and stained for intracellular expression of viral NP. Flow cytometry was performed to determine the % of NP+ cells and geometric mean fluorescence intensity (gMFI) of NP in the NP + gate. (B) Cells were infected with different IAV strains (MOI 0.1) or RSV (MOI 0.1) and titres of infectious virus in clarified supernatants were determined at 48 hpi by ViroSpot (VS) assay. For (A, B), data from two or three independent experiments, each with triplicate samples, are shown. Specific symbols correspond to triplicate samples in one experiment and symbols differ between independent experiments. Statistical analysis was performed using Student’s unpaired t-test with unequal variance to compare Mx + cell lines to the CTRL cell line. * p < 0.05, ** p < 0.01, *** p < 0.001, ns = Not significant.

Similar articles

Cited by

References

    1. Marx S, et al. RIG-I-induced innate antiviral immunity protects mice from lethal SARS-CoV-2 infection. Mol. Ther. Nucl. Acids. 2022;27:1225–1234. doi: 10.1016/j.omtn.2022.02.008. - DOI - PMC - PubMed
    1. Schwab LSU, et al. Retinoic acid-inducible gene i activation inhibits human respiratory syncytial virus replication in mammalian cells and in mouse and ferret models of infection. J. Infect. Dis. 2022;226:2079–2088. doi: 10.1093/infdis/jiac295. - DOI - PMC - PubMed
    1. Schwab LSU, et al. Induction of interferon-stimulated genes correlates with reduced growth of influenza a virus in lungs after RIG-I agonist treatment of ferrets. J. Virol. 2022;96:e0055922. doi: 10.1128/jvi.00559-22. - DOI - PMC - PubMed
    1. Schwab LSU, et al. Expression of a functional Mx1 protein is essential for the ability of RIG-I agonist prophylaxis to provide potent and long-lasting protection in a mouse model of influenza a virus infection. Viruses. 2022 doi: 10.3390/v14071547. - DOI - PMC - PubMed
    1. Villalon-Letelier F, Brooks AG, Saunders PM, Londrigan SL, Reading PC. Host cell restriction factors that limit influenza A infection. Viruses. 2017 doi: 10.3390/v9120376. - DOI - PMC - PubMed

Substances