

The Goldilocks paradigm: comparing classical machine learning, large language models, and few-shot learning for drug discovery applications
- PMID: 38866916
- PMCID: PMC11169557
- DOI: 10.1038/s42004-024-01220-4
The Goldilocks paradigm: comparing classical machine learning, large language models, and few-shot learning for drug discovery applications
Abstract
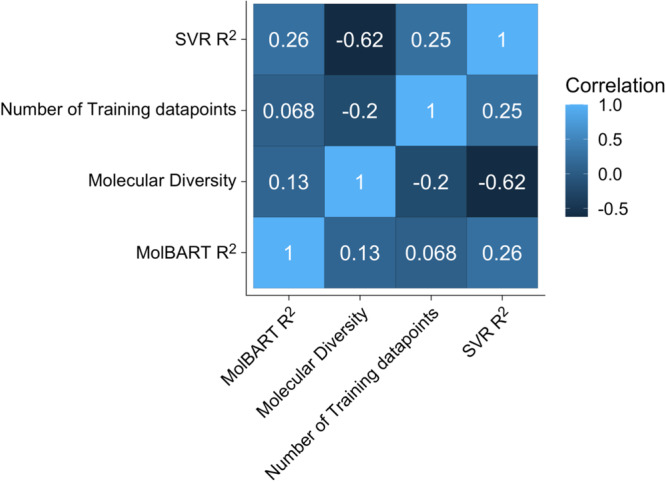
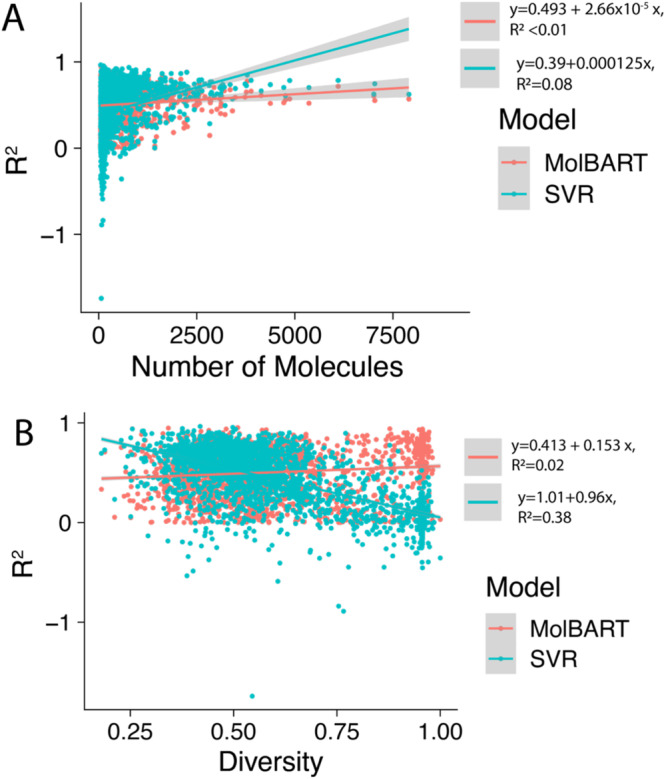
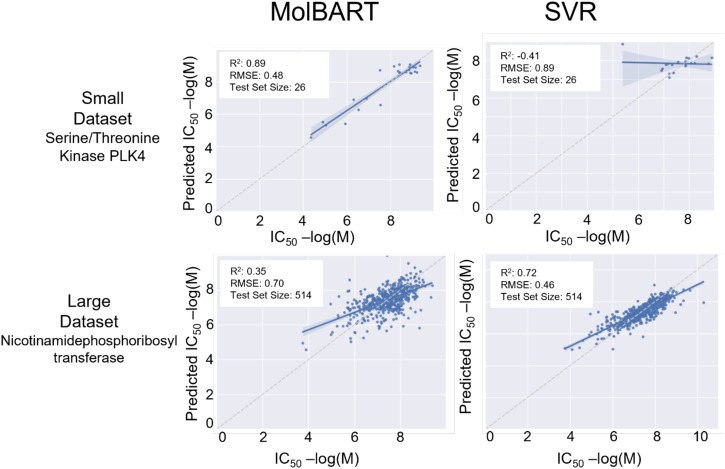
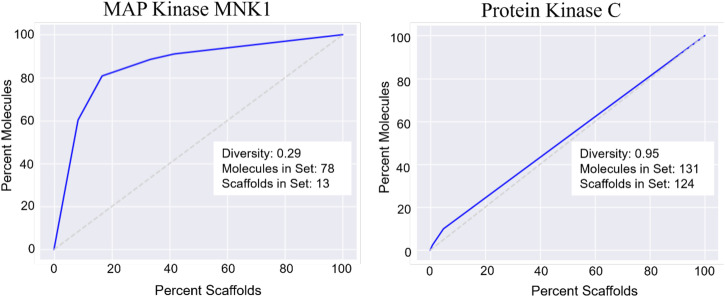
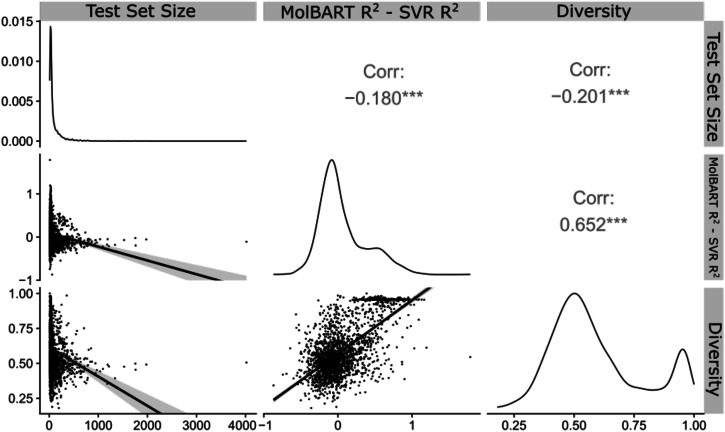
Recent advances in machine learning (ML) have led to newer model architectures including transformers (large language models, LLMs) showing state of the art results in text generation and image analysis as well as few-shot learning (FSLC) models which offer predictive power with extremely small datasets. These new architectures may offer promise, yet the 'no-free lunch' theorem suggests that no single model algorithm can outperform at all possible tasks. Here, we explore the capabilities of classical (SVR), FSLC, and transformer models (MolBART) over a range of dataset tasks and show a 'goldilocks zone' for each model type, in which dataset size and feature distribution (i.e. dataset "diversity") determines the optimal algorithm strategy. When datasets are small ( < 50 molecules), FSLC tend to outperform both classical ML and transformers. When datasets are small-to-medium sized (50-240 molecules) and diverse, transformers outperform both classical models and few-shot learning. Finally, when datasets are of larger and of sufficient size, classical models then perform the best, suggesting that the optimal model to choose likely depends on the dataset available, its size and diversity. These findings may help to answer the perennial question of which ML algorithm is to be used when faced with a new dataset.
© 2024. The Author(s).
Conflict of interest statement
S.E. is the owner and all others are employees of Collaborations Pharmaceuticals, Inc.
Figures
Similar articles
-
Transformers-sklearn: a toolkit for medical language understanding with transformer-based models.BMC Med Inform Decis Mak. 2021 Jul 30;21(Suppl 2):90. doi: 10.1186/s12911-021-01459-0. BMC Med Inform Decis Mak. 2021. PMID: 34330244 Free PMC article.
-
An Empirical Evaluation of Prompting Strategies for Large Language Models in Zero-Shot Clinical Natural Language Processing: Algorithm Development and Validation Study.JMIR Med Inform. 2024 Apr 8;12:e55318. doi: 10.2196/55318. JMIR Med Inform. 2024. PMID: 38587879 Free PMC article.
-
Few-Shot Learning with Semi-Supervised Transformers for Electronic Health Records.Proc Mach Learn Res. 2022 Aug;182:853-873. Proc Mach Learn Res. 2022. PMID: 37538125 Free PMC article.
-
Do it the transformer way: A comprehensive review of brain and vision transformers for autism spectrum disorder diagnosis and classification.Comput Biol Med. 2023 Dec;167:107667. doi: 10.1016/j.compbiomed.2023.107667. Epub 2023 Nov 3. Comput Biol Med. 2023. PMID: 37939407 Review.
-
Weakly Supervised Learning using Attention gates for colon cancer histopathological image segmentation.Artif Intell Med. 2022 Nov;133:102407. doi: 10.1016/j.artmed.2022.102407. Epub 2022 Sep 24. Artif Intell Med. 2022. PMID: 36328667 Review.
Cited by
-
Predicting the Hallucinogenic Potential of Molecules Using Artificial Intelligence.ACS Chem Neurosci. 2024 Aug 21;15(16):3078-3089. doi: 10.1021/acschemneuro.4c00405. Epub 2024 Aug 2. ACS Chem Neurosci. 2024. PMID: 39092989 Free PMC article.
-
MHNfs: Prompting In-Context Bioactivity Predictions for Low-Data Drug Discovery.J Chem Inf Model. 2025 May 12;65(9):4243-4250. doi: 10.1021/acs.jcim.4c02373. Epub 2025 Apr 30. J Chem Inf Model. 2025. PMID: 40302701 Free PMC article.
-
Comparative analysis of the performance of the large language models ChatGPT-3.5, ChatGPT-4 and Open AI-o1 in the field of Programmed Cell Death in myeloma.Discov Oncol. 2025 May 23;16(1):870. doi: 10.1007/s12672-025-02648-3. Discov Oncol. 2025. PMID: 40407967 Free PMC article.
-
A meta-learning approach for selectivity prediction in asymmetric catalysis.Nat Commun. 2025 Apr 16;16(1):3599. doi: 10.1038/s41467-025-58854-8. Nat Commun. 2025. PMID: 40234410 Free PMC article.
-
Adjusted imbalance ratio leads to effective AI-based drug discovery against infectious disease.Sci Rep. 2025 Aug 12;15(1):29563. doi: 10.1038/s41598-025-15265-5. Sci Rep. 2025. PMID: 40796603 Free PMC article.
References
Grants and funding
- 1R43ES031038-01/U.S. Department of Health & Human Services | NIH | National Institute of Environmental Health Sciences (NIEHS)
- R44GM122196-02A1/U.S. Department of Health & Human Services | NIH | National Institute of General Medical Sciences (NIGMS)
- R43 AT010585/AT/NCCIH NIH HHS/United States
- R44 GM122196/GM/NIGMS NIH HHS/United States
- R43 ES031038/ES/NIEHS NIH HHS/United States
LinkOut - more resources
Full Text Sources
