. 2024 Jun;26(6):991-1002.
doi: 10.1038/s41556-024-01424-9. Epub 2024 Jun 12.

Three-dimensional chromatin reorganization regulates B cell development during ageing

Affiliations

Three-dimensional chromatin reorganization regulates B cell development during ageing

Fei Ma et al. Nat Cell Biol. 2024 Jun.

Abstract

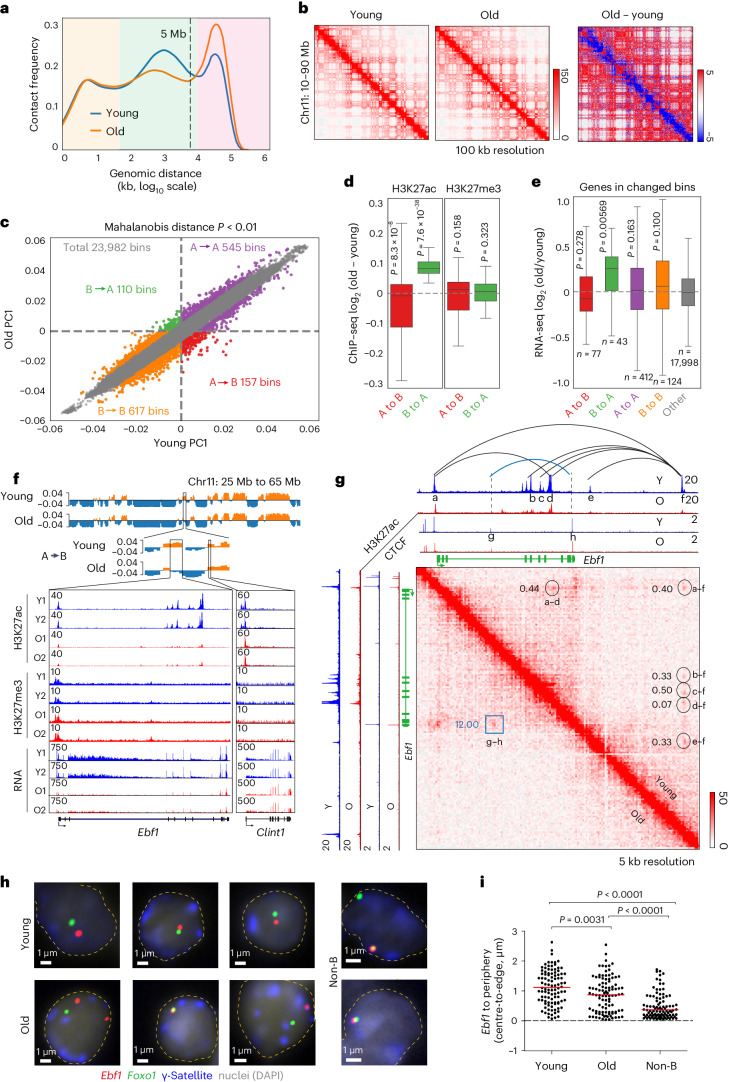
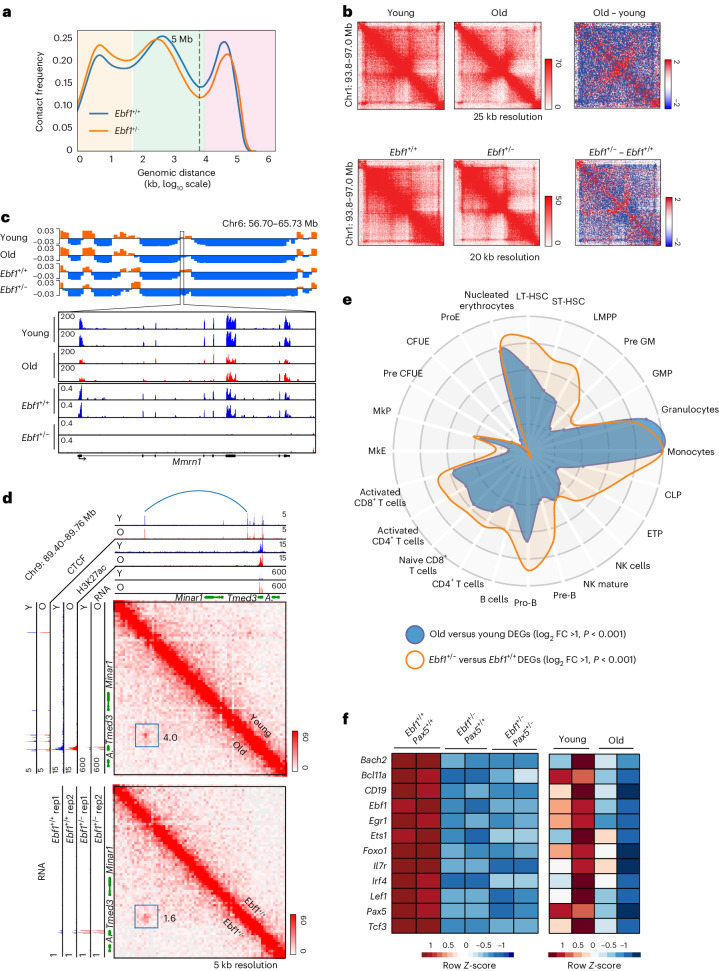
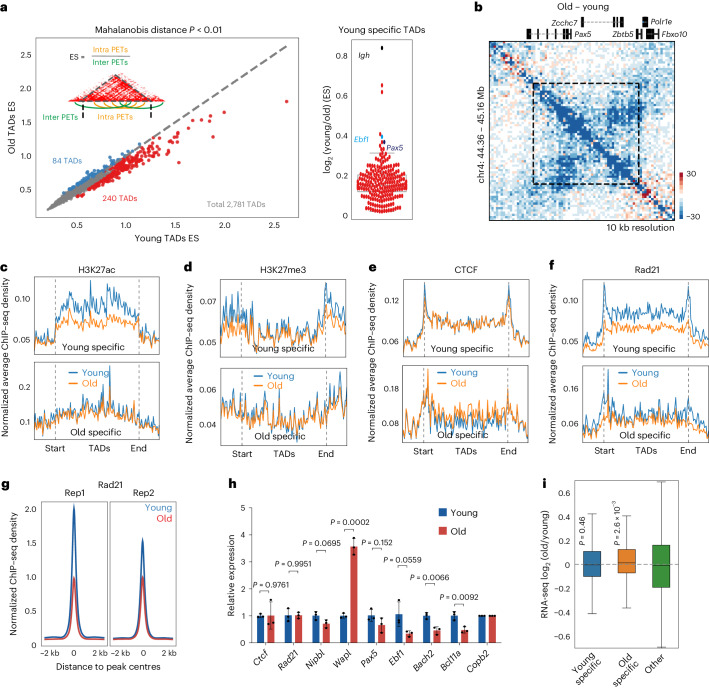
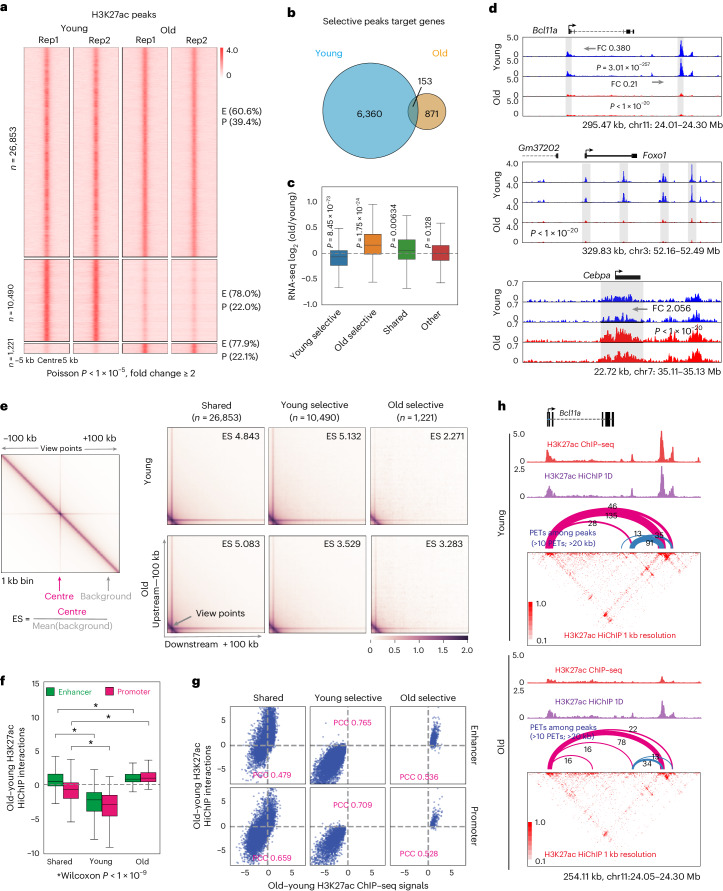
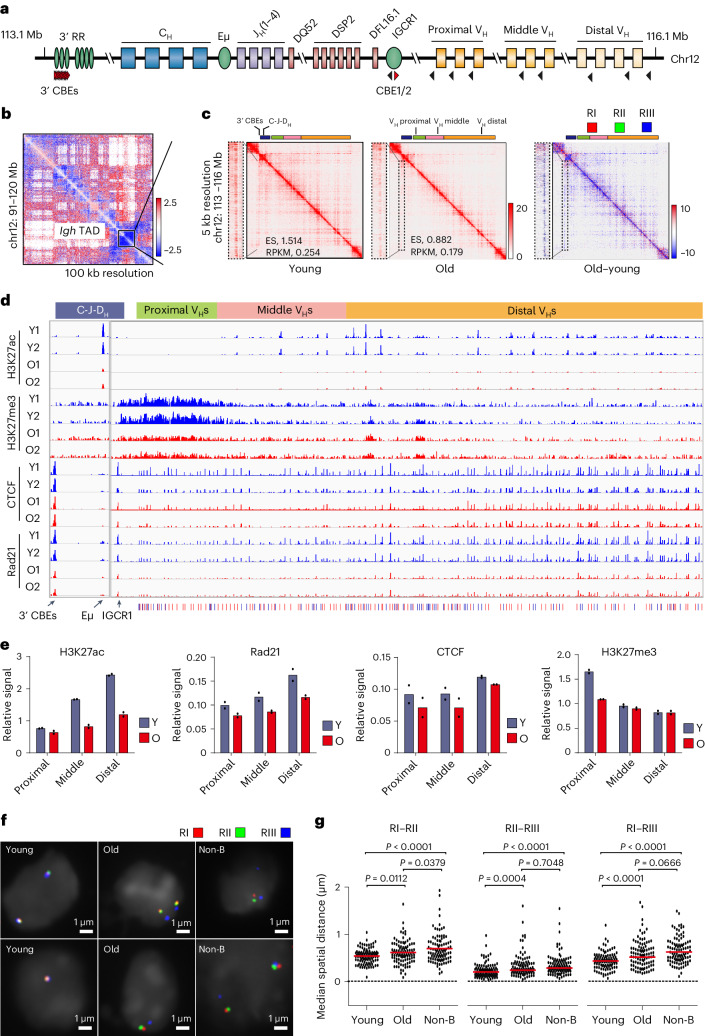
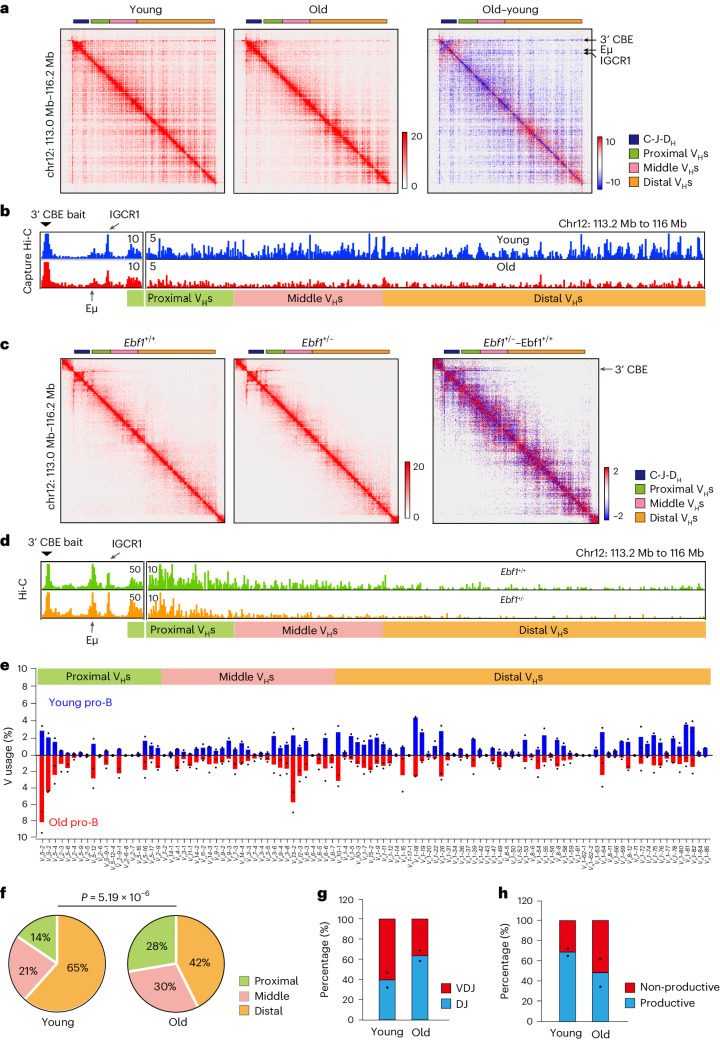
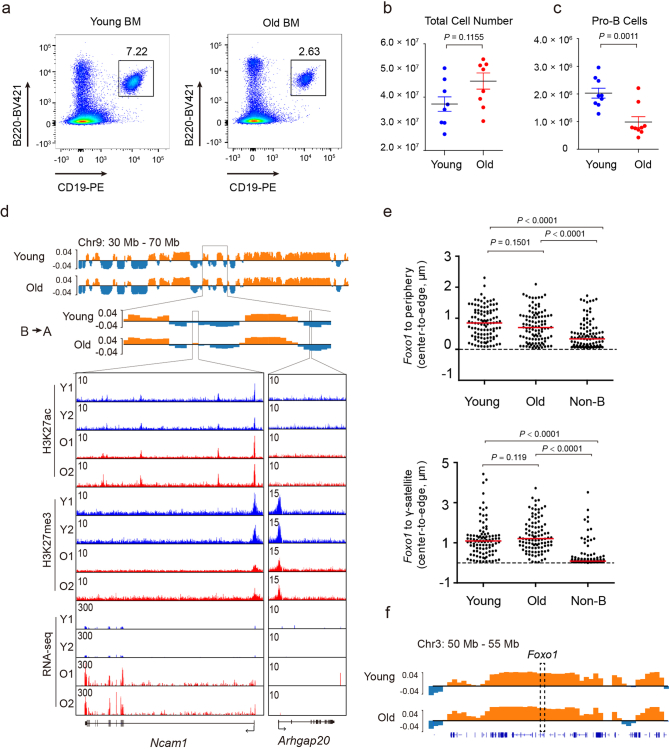
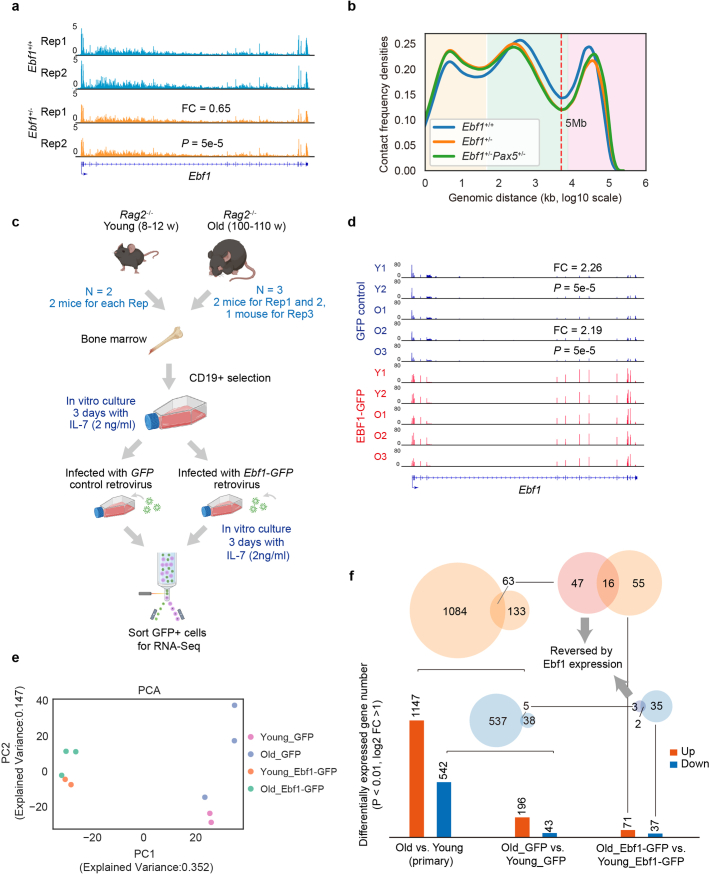
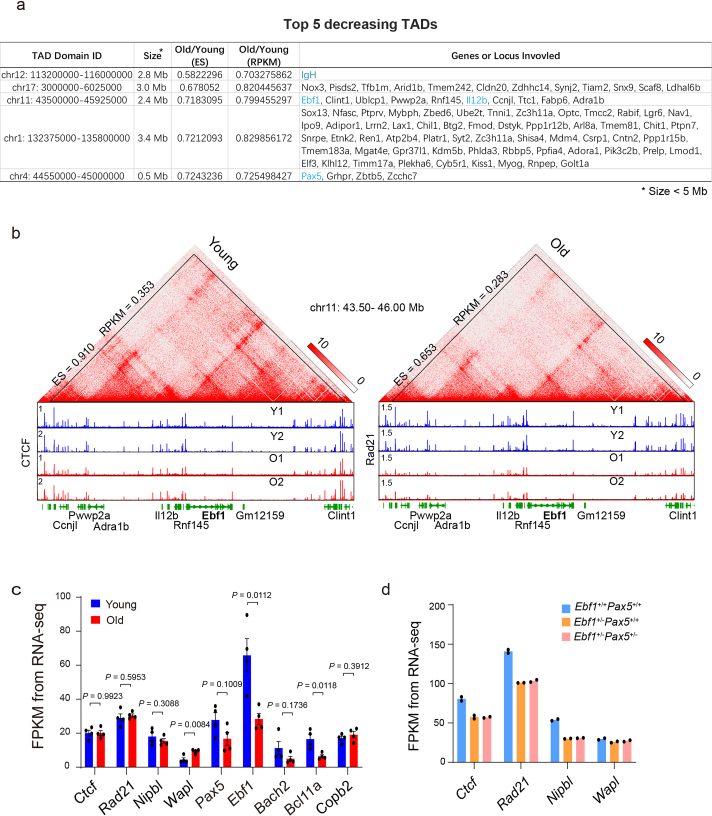
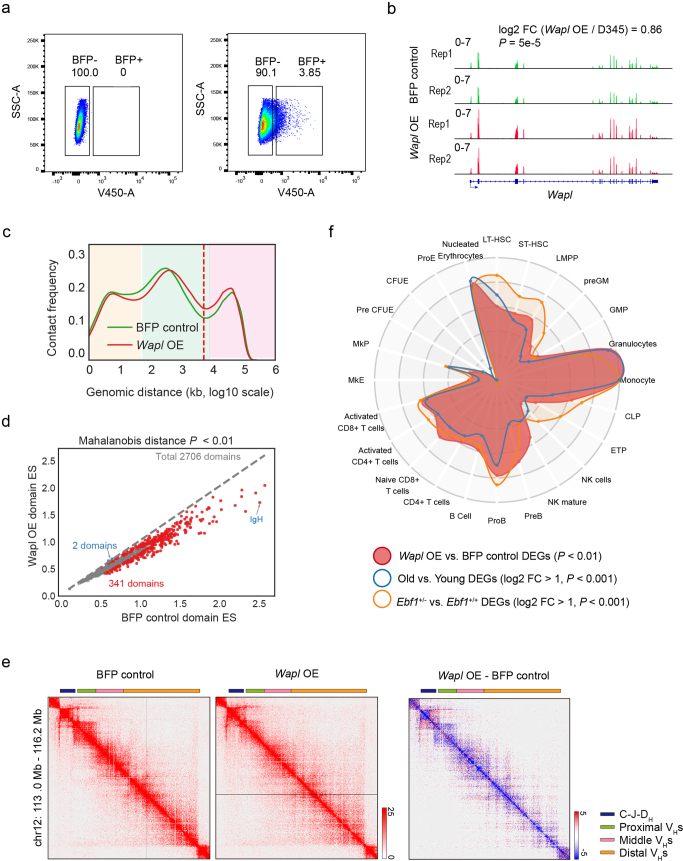
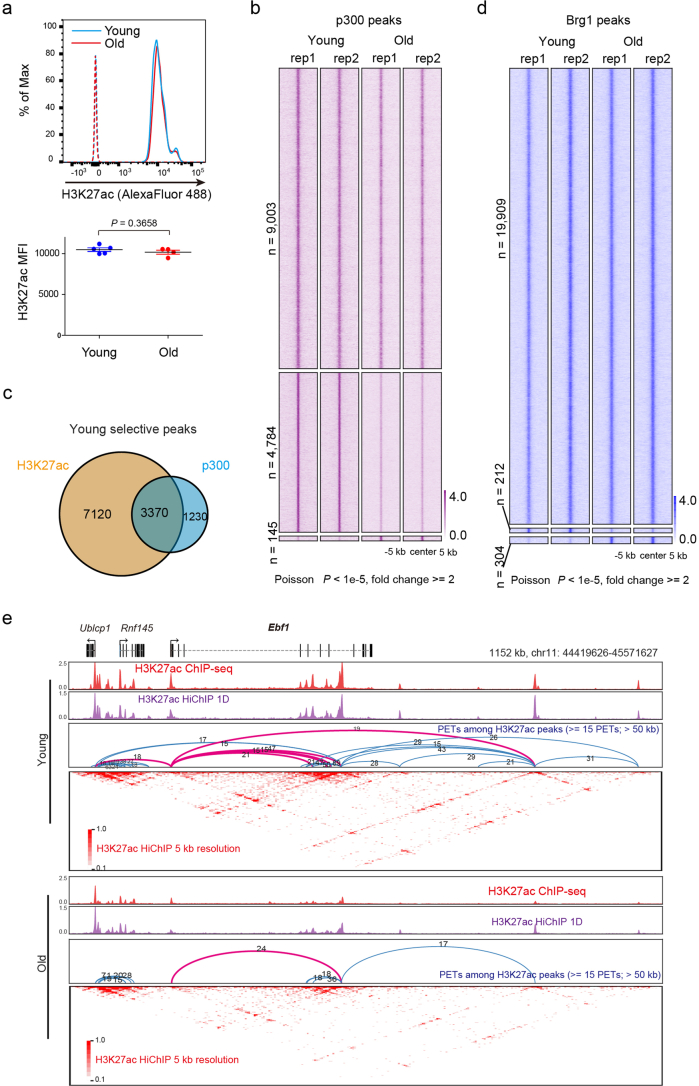
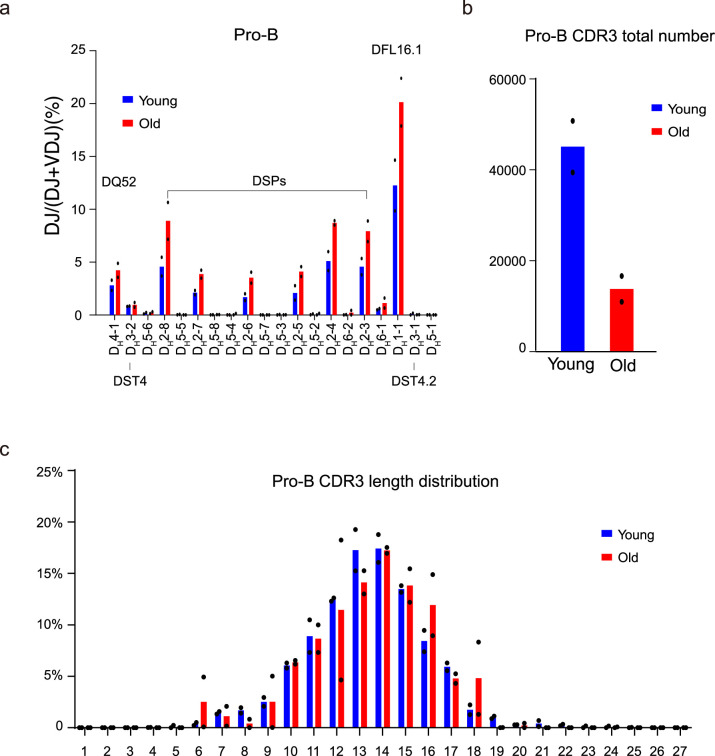
The contribution of three-dimensional genome organization to physiological ageing is not well known. Here we show that large-scale chromatin reorganization distinguishes young and old bone marrow progenitor (pro-) B cells. These changes result in increased interactions at the compartment level and reduced interactions within topologically associated domains (TADs). The gene encoding Ebf1, a key B cell regulator, switches from compartment A to B with age. Genetically reducing Ebf1 recapitulates some features of old pro-B cells. TADs that are most reduced with age contain genes important for B cell development, including the immunoglobulin heavy chain (Igh) locus. Weaker intra-TAD interactions at Igh correlate with altered variable (V), diversity (D) and joining (J) gene recombination. Our observations implicate three-dimensional chromatin reorganization as a major driver of pro-B cell phenotypes that impair B lymphopoiesis with age.


Conflict of interest statement

The authors declare no competing interests.

Figures

Fig. 1
Fig. 1. Age-associated chromatin compartment changes in murine bone marrow B cell progenitors.
a, Combined Hi-C contact linear genomic distances density plots from two replicates of young and old pro-B cells. Colour shading refers to compartments (pink), TADs and loops (green), and close interactions (yellow). b, Example of Hi-C contact heatmaps, visualized with Juicebox using Coverage (sqrt) normalization. Difference heatmap (right) shows regions with increased (red) and decreased interactions (blue) in old pro-B cells. c, PC1 of young and old pro-B cells from Hi-C compartment analysis. Numbers of significantly changed euchromatic (A) and heterochromatic (B) bins of 100 kb are indicated in each quadrant. Significantly changed bins were obtained using a two-pass MD method with a one-sided chi-squared test P < 0.01. d, Difference of aggregate H3K27ac and H3K27me3 (n = 2) signals within significantly switched bins identified in c. e, Differential expression (n = 4) for genes associated with each category identified in c from RNA-seq analysis. The top and bottom of each box (in d and e) represents the 75th and 25th percentile, respectively, with a line at the median. Whiskers extend by 1.5× the interquartile range. P values were determined by two-sided Wilcoxon signed-rank test. f, Chromatin state of Ebf1 locus in young and old pro-B cells. Top tracks show Hi-C compartment PC1, with orange indicating compartment A and blue indicating compartment B. Lower tracks show normalized ChIP–seq and RNA-seq tracks. Clint1 (right) serves as a control gene located in compartment A that is unaffected by age. g. Hi-C heatmaps of the Ebf1 locus. Interactions with greater than twofold change in old pro-B cells are marked by black circles/arcs (reduced) or the blue square/arc (increased). Numbers represent the ratio of Hi-C PETs in old pro-B cells compared with young pro-B cells. h, Nuclear positioning assayed by FISH. Representative nuclei from young and old pro-B cells and non-B cells from Rag2−/− mice are shown. Probe colours are as indicated. Dashed lines delineate the nuclear periphery. i, Distance between Ebf1 locus and nuclear periphery in pro-B cells and non-B cells (n = 100) is shown. The red line indicates the median value; P values based on unpaired two-sided t-tests. Source data
Fig. 2
Fig. 2. Reduced Ebf1 expression in pro-B cells partially mimics ageing phenotype.
a, Combined Hi-C contact linear genomic distances density plots from two replicates of Rag2-deficient Ebf1+/+ and Ebf1+/− pro-B cells. Genomic distances are shaded as follows: compartments (pink) TADs and loops (green) and close interactions (yellow). b, Similar TAD changes in old versus young and Ebf1+/− versus Ebf1+/+ pro-B cells (chromosomal region as indicated). Heatmaps in each kind of pro-B cells are shown with difference maps on the right. Blue and red colours represent reduced or increased interactions, respectively, in old or Ebf1+/− pro-B cells. c, Similar compartment switching in old versus young and Ebf1+/− versus Ebf1+/+ pro-B cells at Mmrn1 gene locus. Top tracks show Hi-C PC1, with orange indicating compartment A and blue indicating compartment B. Lower tracks show normalized RNA-seq tracks across the Mmrn1 locus. d, Similar loop changes in old versus young and Ebf1+/−versus Ebf1+/+ pro-B cells. Hi-C heatmaps for a region of chromosome 9 with increased interactions (blue arc) in old and Ebf1+/− pro-B cells. Numbers adjacent to the blue square represent the ratios of Hi-C PETs in old compared with young (top) pro-B cells and in Ebf1+/− compared with Ebf1+/+ pro-B cells (bottom). RNA-seq analysis in young/old and Ebf1+/+/Ebf1+/− pro-B cells are shown alongside. e, CellRadar (https://karlssong.github.io/cellradar/) plot derived from transcriptional changes identified in comparison of young and old (Rag2−/−) pro-B cells (n = 4) and Ebf1+/+ and Ebf1+/− pro-B cells (n = 2). DEGs, differentially expressed genes; FC, fold change; NK, nature killer cells; ProE, proerythroblast; CFUE, colony forming unit-erythroid; Pre CFUE, colony forming unit-erythroid restricted precursor; MkP, megakaryocyte progenitor; MkE, megakaryocyte-erythroid; ETP, early T cell precursor; CLP, common lymphoid progenitor; GMP, granulocyte-monocyte progenitor, pre GM, pre-granulocyte macrophage; LMPP, lympho-myeloid primed progenitor; ST-HSC, short-term hematopoietic stem cell; LT-HSC, long-term hematopoietic stem cell. f, Expression levels of key B cell genes in pro-B cells of indicated genotypes and young and old (Rag2−/−) pro-B cells measured by RNA-seq. Colours indicate z-score normalized gene expression levels. Source data
Fig. 3
Fig. 3. Age-associated changes in TADs in pro-B cells.
a, The scatter plot on the left displays a quantitative comparison of TAD strength derived from Hi-C data of young and old Rag2−/− pro-B cells. Each dot in the plot represents one TAD, and TAD strength is represented as the ES, calculated as indicated. TADs showing increased or decreased interactions with age are coloured blue (old specific) or red (young specific), respectively. Dot plot represents reduced TADs in old pro-B cells. TADs encompassing Igh, Ebf1 and Pax5 loci are indicated. Significantly changed TADs were obtained using a two-pass MD method with a one-sided chi-squared test, P < 0.01. b, Difference heatmap showing reduced TAD formation covering the Pax5 gene locus in aged pro-B cells. cf, Aggregation analysis of H3K27ac (c), H3K27me3 (d), CTCF (e) and Rad21 (f), ChIP–seq signal densities at significantly decreased (n = 240, young-specific group) and increased (n = 84, old-specific group) TADs identified in a. g, Aggregation analysis of Rad21 ChIP–seq signal densities around peak centre. Rep1 and Rep2 represent two biological experiments. h, Quantitative RT–PCR validation of RNA-seq data (n = 3). Data are normalized to Copb2 and presented as mean ± standard error of the mean, with each replicate shown as a dot. Unpaired two-sided t-test was used to determine P values. i, Distribution of expression levels for the genes located in significantly changed TADs (n = 4). The top and bottom of each box represents 75th and 25th percentile, respectively, with a line at the median. Whiskers extend by 1.5× the interquartile range. P values were determined by two-sided Wilcoxon signed-rank test. Source data
Fig. 4
Fig. 4. H3K27ac-mediated chromatin reorganization during ageing.
a, Changes in H3K27ac were identified from ChIP–seq in young and old pro-B cells (n = 2). Rep1 and Rep2 represent two biological experiments. H3K27ac peaks within 2 kb of the TSS are labelled as promoters (P), others are labelled as enhancers (E). Top, unchanged peaks (shared); middle, peaks that were reduced in old pro-B cells (young selective); and bottom, peaks that were increased in old pro-B cells (old selective). b, Age-associated H3K27ac peaks were annotated to genes; Venn diagram shows overlap between genes containing young- or old-selective H3K27ac peaks. c, Expression levels (n = 4) of genes containing each H3K27ac peak category. The ‘Other’ category includes genes that are expressed but not annotated to identified H3K27ac peaks. d, Genome browser tracks of genes containing young (Bcl11a and Foxo1) and old-selective (Cebpa) H3K27ac peaks. FC, fold change of indicated H3K27ac peak. P values were determined by one-sided Poisson test. e, Aggregation analysis of H3K27ac HiChIP data (n = 2) with H3K27ac peaks identified in a. The ES for each H3K27ac peak was calculated as shown. The right panels display the average ES for each category of H3K27ac peaks. f, H3K27ac HiChIP interaction (n = 2) differences for categories identified in part ‘a’ separated by location of H3K27ac at promoter or enhancer. g, Correlation between changes in H3K27ac ChIP–seq signal and H3K27ac HiChIP interaction strength for peaks identified in a. PCC, Pearson correlation coefficient. h, Heatmaps of H3K27ac HiChIP interactions in the Bcl11a locus in young (upper) and old (lower) pro-B cells. The pink arches represent interactions from the Bcl11a promoter. Strength of interactions are denoted by thickness of arches. Top tracks show H3K27ac peaks obtained from ChIP–seq (red) or HiChIP (purple). The top and bottom of each box (in c and f) represent 75th and 25th percentile, respectively, with a line at the median. Whiskers extend by 1.5× the interquartile range. P values were determined using two-sided Wilcoxon signed-rank test; asterisks signify P < 1 × 10−9 (Methods). Source data
Fig. 5
Fig. 5. Age-associated changes in chromatin structure at the Igh locus.
a, Schematic representation of the mouse Igh locus. Regulatory elements are displayed as ovals. Black and red triangles represent CBEs with opposite orientations. b, Difference Hi-C heatmap showing a part of chromosome 12; Igh TAD is boxed. c, Contact frequency heatmaps of the Igh TAD in young and old pro-B cells. A stripe from 3′ CBEs across the Igh locus is indicated by dashed box and zoomed in on the left side of each heatmap. Schematics on top represent the locus to scale. Coloured sections represent 3′ Igh domain (dark blue), proximal VH genes (green), middle VH genes (pink) and distal VH genes (yellow). A difference map for the same region is shown on the right. The red (RI), green (RII) and blue (RIII) bars above the difference map indicate locations of bacterial artificial chromosome (BAC) probes used for FISH assays in f and g. RPKM, reads per kilobase per million mapped reads. d, Age-dependent histone modifications and CTCF and Rad21 binding at the Igh locus. Tracks from replicate young and old pro-B cell samples are shown. e, Quantification of H3K27ac, Rad21, CTCF and H3K27me3 ChIP–seq (n = 2) signals in the 2 Mb region of the Igh locus that contains VH gene segments. Proximal, middle and distal refer to locations relative to the 3′ end of the locus (C-J-DH) in part d. ‘Relative signal’ represents read counts per million (CPM) of each region relative to total reads. Bar graph represents the mean of two replicate experiments, with each replicate shown as a dot. f,g, RI, II and III BAC probes (part b) were used in FISH with young and old Rag2−/− pro-B cells. Representative nuclei and probe colours are as indicated (f). Dot plots of spatial distances between indicated probes (n = 100) (g). Non-B cells represent Rag2−/− bone marrow cells depleted of CD19+ pro-B cells. Unpaired two-sided t-test was used for g, with P values indicated. Source data
Fig. 6
Fig. 6. Functional consequences of age-associated impairment of Igh locus contraction.
a,c, Contact frequency heatmaps of capture Hi-C (a) or Hi-C (c) showing the Igh TAD in young and old pro-B cells (a) or Ebf1+/+ and Ebf1+/− pro-B cells (c). Difference maps for the same region are shown on the right; regions with increased and decreased interactions in old or Ebf1+/− pro-B cells are coloured red and blue, respectively. Schematics on top represent the Igh locus to scale; colours represent different parts of the locus as indicated to the right of the figure. b,d, Virtual 4C tracks were derived from capture Hi-C in young and old (b) or Hi-C in Ebf1+/+ and Ebf1+/− (d) pro-B cells using 3′ CBEs as the bait. Specific interactions with Eμ and IGCR1 appear as peaks (left); widespread interactions with different parts of the VH regions are shown. e, Rearrangement frequencies (n = 2) of all VH gene segments in young and old pro-B cells from C57BL/6J mice. f, Pie graph showing differential proximal, middle and distal VH gene utilization in young and old pro-B cells. A one-sided chi-squared test was used to determine P value. g, Proportion of partial (DJH) and complete (VHDJH) Igh rearrangements in young and old pro-B cells from C57BL/6J mice (n = 2) are shown. h, Proportion of productive (those that can encode IgH protein) and non-productive VHDJH junctions in young and old pro-B cells from C57BL/6J mice (n = 2). Bar graph represents the mean of two replicate experiments, with each replicate shown as a dot for e, g and h. Source data
Extended Data Fig. 1
Extended Data Fig. 1. Pro-B cell number is reduced in aged mice.
(a) Representative flow cytometry plots showing the population of Rag2−/− pro-B cells from young and old bone marrow. Numbers indicate percentage of cells in the gates. Gating strategy was shown in Source Data. (b) Average total number of bone marrow cells from tibias and femurs of young and old Rag2−/− mice (n = 8). Data are presented as mean ± SEM. Unpaired two-sided t test was used, with P-values indicated. (c) Number of pro-B cells after CD19+ selection and CD19 + B220+ sorting from young and old Rag2−/− mice (n = 9). Each point represents an individual mouse. Data are presented as mean ± SEM. Unpaired two-sided t test was used, with P-values indicated. (d) An example locus transitioned from compartment B (young) to compartment A (old) with age. Top tracks show Hi-C PC1 of a segment of chromosome 9 that contains Ncam1 in pro-B cells at different ages; the region corresponding to the Ncam1 locus is expanded below. Normalized tracks for H3K27ac and H3K27me3 ChIP-Seq and RNA-Seq across the Ncam1 locus are shown with IGV. Arhgap20 (right) serves as a control gene located in compartment B that is unaffected by age. (e) Dot plots for distance between Foxo1 locus to the nuclear periphery (upper panel) or to the nearest γ-satellite signal (bottom panel). Median is shown in red line. N = 100. Unpaired two-sided t test was used, with P-values indicated. (f) Hi-C PC1 showing a segment of chromosome3 containing the Foxo1 locus at different ages. Source data
Extended Data Fig. 2
Extended Data Fig. 2. Ebf1 perturbation causes chromatin structure and expression changes in pro-B cells.
(a) Normalized tracks for RNA-Seq of Ebf1+/+ and Ebf1+/− pro-B cells across the Ebf1 locus are shown with IGV. “FC” represents fold change, and the Poisson test was applied with P values indicated (n = 2). (b) Average Hi-C contact plots (n = 2) derived from Ebf1+/+ and Ebf1+/− pro-B cells. Color shading refers to: compartments: pink, TADs and loops: green, and close interactions: yellow. (c) Experimental scheme for overexpressing Ebf1 in cultured pro-B cells. (d) Normalized tracks for RNA-Seq across the Ebf1 locus of different samples are shown with IGV. “FC” represents fold change, and the Poisson test was applied with P values indicated (n = 2). (e) Principal component analysis (PCA) plot depicting the distribution of RNA-Seq from different samples as indicated. (f) Schematic representation of differentially expressed gene counts across multiple comparisons. Source data
Extended Data Fig. 3
Extended Data Fig. 3. Most decreased TADs in aged pro-B cells.
(a) A chart showing information of top 5 decreased TADs. TAD size is limited to be less than 5 Mb. B cell associated genes are in blue. (b) An example showing one of the top decreased TAD containing Ebf1 locus. Young (left) and old (right) Hi-C contact frequency heat maps are in 5 kb resolution. Normalized tracks for CTCF (left) and Rad21 (right) ChIP-Seq across the TAD are shown with IGV. ES (enrichment score) and RPKM values of the TAD are annotated. (c) Normalized expression levels of key genes involved in either chromatin structure maintenance (Ctcf, Rad21, Nipbl and Wapl) or B cell development (Pax5, Ebf1, Bach2 and Bcl11a) in young and old pro-B cells (n = 4). Copb2 is shown as a control. Data are presented as mean ± SEM. Unpaired two-sided t test was used and P-values were indicated. (d) Normalized expression levels of key genes involved in chromatin structure maintaining in Ebf1+/+, Ebf1+/− and Ebf1+/−Pax5+/− pro-B cells (n = 2). Bar graph represents the mean of two replicate experiments, with each replicate shown as a dot. Source data
Extended Data Fig. 4
Extended Data Fig. 4. Wapl overexpression remodels the chromatin structure in the recombinase deficient pro-B cell line (D345).
(a) Flow cytometric analysis showing the D345 pro-B cell line with (left) or without (right) infection with Wapl-BFP lentivirus. The percentages of BFP+ and BFP- cells are indicated. BFP+ cells are sorted for experiments. (b) Normalized tracks for RNA-Seq across the Wapl locus are shown with IGV. “FC” represents fold change, and the Poisson test was applied with the P value indicated (n = 2). (c) Average Hi-C contact plots (n = 2) derived from BFP control and Wapl overexpressed D345 cells. Color shading refers to: compartments: pink, TADs and loops: green, and close interactions: yellow. (d) Quantitative comparison of TAD strength derived from Hi-C data of BFP control and Wapl overexpressed D345 cells. Similar analysis and the same cutoffs as in Fig. 3a were used. Representative genes from the top-ranked changed TADs are displayed. (e) Hi-C contact frequency heat maps (pooled from 2 biological replicates) showing the Igh TAD in BFP control and Wapl overexpressed D345 pro-B cells. A difference map (Wapl OE minus BFP control) for the same region is shown on the right; regions with increased and decreased interactions in old are colored red and blue, respectively. Schematics on top represent the Igh locus to scale; colors represent different parts of the locus as indicated to the right of the figure. (f) CellRadar (https://karlssong.github.io/cellradar/) plot derived from transcriptional changes identified in comparison of young and old pro-B cells (blue), Ebf1+/+ and Ebf1+/− pro-B cells (orange), and BFP control and Wapl overexpressed D345 cells. Differentially expressed genes (DEGs) with log2 fold change > 1 and P-value < 0.01 were used as input for young and old pro-B cells (blue), and Ebf1+/+ and Ebf1+/− pro-B cells. DEGs with P-value < 0.01 were used as input for BFP control and Wapl overexpressed D345 cells because of the limited number of DEGs by a more stringent cutoff. Source data
Extended Data Fig. 5
Extended Data Fig. 5. H3K27ac mediated chromatin reorganization during aging.
(a) Measurement of H3K27ac levels in Rag2−/− young (blue) and old (red) pro-B cells via flow cytometry. The IgG isotype controls are shown in dotted lines. The dot plot on the bottom indicates the median fluorescence intensities (MFI) of H3K27ac levels in young and old pro-B cells. Data are presented as mean ± SEM. Unpaired two-sided t test was used, with the P-value indicated. (b) Age-selective p300 ChIP-Seq binding sites were identified in young and old pro-B cells. The analysis and cutoffs used were consistent with those in Fig. 4a. (c) Overlaps of young selective H3K27ac and p300 peaks.(d) Age-selective Brg1 ChIP-Seq binding sites were identified in young and old pro-B cells. The analysis and cutoffs used were consistent with those in Fig. 4a. (e) H3K27ac HiChIP heatmaps of the Ebf1 locus in young (upper) and old (lower) pro-B cells. The visualization elements are similar to that shown in Fig. 4h. Source data
Extended Data Fig. 6
Extended Data Fig. 6. DH utilization and CDR3 length distribution are not affected by age.
(a) Average utilization of DH gene segments in VHDJH and DJH joins in young and old C57BL/6J pro-B cells by VDJ-Seq (Hu et al.) using JH1 bait (n = 2). Clone names of DH gene segments are annotated. (b) Total CDR3 number in young and old C57BL/6J pro-B cells (n = 2). (c) CDR3 length distribution of productive VHDJH exons in young and old C57BL/6J pro-B cells by JH1 bait (n = 2). Bar graph represents the mean of two replicate experiments, with each replicate shown as a dot. Source data

References

    1. Sood V, Misteli T. The stochastic nature of genome organization and function. Curr. Opin. Genet. Dev. 2022;72:45–52. doi: 10.1016/j.gde.2021.10.004. - DOI - PMC - PubMed
    1. Lieberman-Aiden E, et al. Comprehensive mapping of long-range interactions reveals folding principles of the human genome. Science. 2009;326:289–293. doi: 10.1126/science.1181369. - DOI - PMC - PubMed
    1. Dixon JR, et al. Topological domains in mammalian genomes identified by analysis of chromatin interactions. Nature. 2012;485:376–380. doi: 10.1038/nature11082. - DOI - PMC - PubMed
    1. Nora EP, et al. Spatial partitioning of the regulatory landscape of the X-inactivation centre. Nature. 2012;485:381–385. doi: 10.1038/nature11049. - DOI - PMC - PubMed
    1. Rao SS, et al. A 3D map of the human genome at kilobase resolution reveals principles of chromatin looping. Cell. 2014;159:1665–1680. doi: 10.1016/j.cell.2014.11.021. - DOI - PMC - PubMed

Publication types

MeSH terms