. 2024 Aug;25(8):3263-3275.
doi: 10.1038/s44319-024-00176-9. Epub 2024 Jun 12.

The transcription factor PAX5 activates human LINE1 retrotransposons to induce cellular senescence

Affiliations

The transcription factor PAX5 activates human LINE1 retrotransposons to induce cellular senescence

Huanyin Tang et al. EMBO Rep. 2024 Aug.

Abstract

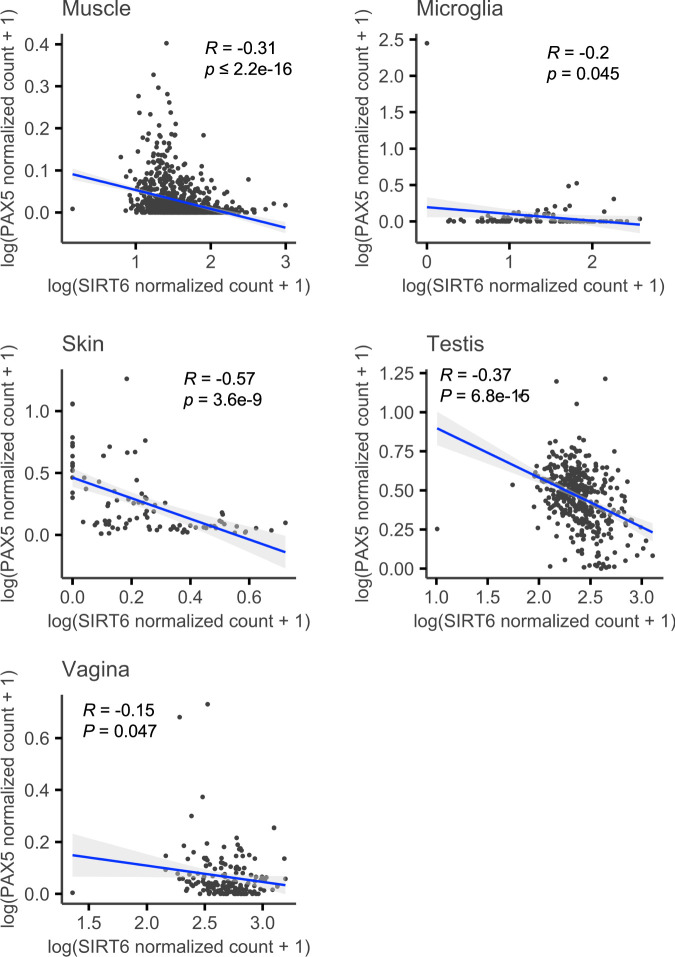
As a hallmark of senescent cells, the derepression of Long Interspersed Elements 1 (LINE1) transcription results in accumulated LINE1 cDNA, which triggers the secretion of the senescence-associated secretory phenotype (SASP) and paracrine senescence in a cGAS-STING pathway-dependent manner. However, transcription factors that govern senescence-associated LINE1 reactivation remain ill-defined. Here, we predict several transcription factors that bind to human LINE1 elements to regulate their transcription by analyzing the conserved binding motifs in the 5'-untranslated regions (UTR) of the commonly upregulated LINE1 elements in different types of senescent cells. Further analysis reveals that PAX5 directly binds to LINE1 5'-UTR and the binding is enhanced in senescent cells. The enrichment of PAX5 at the 5'-UTR promotes cellular senescence and SASP by activating LINE1. We also demonstrate that the longevity gene SIRT6 suppresses PAX5 transcription by directly binding to the PAX5 promoter, and overexpressing PAX5 abrogates the suppressive effect of SIRT6 on stress-dependent cellular senescence. Our work suggests that PAX5 could serve as a potential target for drug development aiming to suppress LINE1 activation and treat senescence-associated diseases.

Keywords: Cellular Senescence; LINE1; PAX5; SIRT6.


Conflict of interest statement

The authors declare no competing interests.

Figures

Figure 1
Figure 1. Prediction of transcription factor binding motifs enriched in commonly upregulated LINE1 variants in senescence.
(A) Heatmaps showing the expression of LINE1 subfamilies in cells in the state of stress-induced premature senescence (SIPS), replicative senescence (RS), and oncogene-induced senescence (OIS). (B) A Venn diagram showing commonly upregulated LINE1 variants in SIPS, RS, and OIS. (C) List of enriched candidate transcription factor binding motif identified from commonly upregulated LINE1 variants. (D) The positional distribution of the best matches to the motif in the LINE1 5’-UTR. (E) The distribution of the number of matches to the motif in the LINE1 5’-UTR.
Figure 2
Figure 2. PAX5 binds LINE1 5’-UTR and regulates LINE1 expression.
(A) Schematic representation of the LINE1 5’-UTR and luciferase fusion reporter. (B) Expression of senescence associated upregulated LINE1 binding transcription factor candidates. (C) Transcriptional activity analysis of LINE1 5’-UTR when senescence associated upregulated LINE1 binding transcription factor candidates overexpressed; activity was measured by relative luciferase activity (n = 3, biological replicates). (D) FIMO results indicated potential PAX5 binding sites within the LINE1 5’-UTR. (E) PAX5 ChIP-Seq signal intensity within the LINE1 5’-UTR in GM12878 cell line. (F) ChIP analysis displayed endogenous PAX5 enrichment at the designated LINE1 5’-UTR sites (n = 3, biological replicates). (G) Transcriptional activity analysis of either full-length LINE1 5’-UTR or LINE1 5’-UTR with PAX5 binding site mutations (Δ51-Δ62/Δ161-Δ172/Δ244-255/Δ250-261/Δ269-Δ280) in the presence of PAX5 overexpression (n = 3, biological replicates). Error bars denote standard deviation (SD). Statistical significance was accessed by two-tailed Student’s t test. ns, not significant; *P < 0.05; **P < 0.01; ***P < 0.001; ****P < 0.0001. Source data are available online for this figure.
Figure 3
Figure 3. PAX5 promotes cellular senescence via LINE1 activation.
(A, B) HCA2-hTERT cells were exposed to 10 Gy X-ray irradiation and the relative PAX5 mRNA (A) and protein (B) expression were quantified at day 10 post-irradiation (n = 3, biological replicates). (C) IMR90-hTERT cells were exposed to 8 or 10 Gy X-ray irradiation, and the relative PAX5 protein expression was quantified by Western blot at day 10 or 14 post-irradiation. (D) Comparison of PAX5 protein expression levels between adipose stem cells isolated from young and old donors (n = 3, biological replicates). (E) ChIP analysis of endogenous PAX5 enrichment at the indicated LINE1 5’-UTR region in HCA2-hTERT cells collected on day 10 post 10 Gy X-ray irradiation (n = 3, biological replicates). (F) Relative LINE1 transcription level was quantified by RT-qPCR in PAX5-overexpressing stable line treated with 10 Gy X-ray irradiation and collected at day 10 post-irradiation (n = 3, biological replicates). (GI) PAX5-overexpressing cells were treated with 10 Gy X-ray irradiation, and cells were harvested on day 10 post-irradiation. (G) Cellular senescence was assessed by quantifying the expression of the senescence marker p21 using Western blot. (H) β-gal+ cells were quantified using SA-β-gal staining (n = at least 10, biological replicates). (I) Transcript expression of representative SASP genes, IL1β and IL6, was quantified by RT-qPCR (n = 3, biological replicates). (J) PAX5-overexpressing cells exposed to 10 Gy X-ray irradiation were treated with DMSO or 25 μM 3TC for 10 days. Cellular senescence was assessed by quantifying β-gal+ cells using SA-β-gal staining (n = at least 7, biological replicates). For all boxplots, the minimum and maximum are typically 1.5 times the Interquartile Range (IQR) from the quartiles, the center value is the median, the box edges are the 25th (Q1) and 75th (Q3) percentiles, and the whiskers extend to the nearest non-outlier points within 1.5 times the IQR. Error bars denote SD. Statistical significance was accessed by two-tailed Student’s t test. ns, not significant; *P < 0.05; **P < 0.01; ***P < 0.001; ****P < 0.0001 (Scale bar: 100 μm). Source data are available online for this figure.
Figure 4
Figure 4. SIRT6 directly regulates PAX5 transcription.
(A, B) Quantification of PAX5 protein expression in SIRT6-depleted cells (A) by Western blot and transcript expression (B) by RT-qPCR (n = 3, biological replicates). (C) Evaluation of the transcriptional activity of the PAX5 promoter in SIRT6-depleted and SIRT6-reintroduced cells, quantified by luciferase activity using a PAX5 promoter and luciferase fusion reporter (n = 3, biological replicates). (D) Pearson correlation of DESeq2 normalized counts of SIRT6 and PAX5 of lung tissue of 86 donors ranging from 16 to 76 years old. (E) Genomic tracks display ChIP-Seq data for SIRT6 surrounding the PAX5 promoter region in H1-ESC cells. (F) ChIP analysis showed endogenous SIRT6 enrichment in PAX5 promoter in HCA2-hTERT cells (n = 3, biological replicates). (G) Genomic tracks display ChIP-Seq data for H3K27ac surrounding the PAX5 promoter region in OIS IMR90 cells. (H) ChIP analysis of SIRT6 enrichment at PAX5 promoter in HCA2-hTERT cells collected on day 10 post 10 Gy X-ray irradiation (n = 3, biological replicates). (I) Relative PAX5 transcript expression, quantified by RT-qPCR, in SIRT6-overexpressing cells treated with 10 Gy X-ray irradiation and collected on day 14 post-irradiation (n = 3, biological replicates). (J) Analysis of the transcriptional activity of the LINE1 5’-UTR in response to SIRT6 and/or PAX5 overexpression, quantified by luciferase activity using a LINE1 5’-UTR and luciferase fusion reporter (n = 3, biological replicates). (K) PAX5 or/and SIRT6 overexpressed cells were exposed to 10 Gy X-ray irradiation and collected at day 10 post-irradiation. Cellular senescence was accessed by quantifying β-gal+ cells using SA-β-gal staining (n = 12, biological replicates). For the boxplot, the minimum and maximum are typically 1.5 times the Interquartile Range (IQR) from the quartiles, the center value is the median, the box edges are the 25th (Q1) and 75th (Q3) percentiles, and the whiskers extend to the nearest non-outlier points within 1.5 times the IQR. Error bars denote SD. Statistical significance was accessed by two-tailed Student’s t test. ns, not significant; *P < 0.05; **P < 0.01; ***P < 0.001; ****P < 0.0001 (Scale bar: 100 μm). Source data are available online for this figure.
Figure EV1
Figure EV1. SIRT6 expression is negatively correlated with PAX5 in multiple tissues.
Pearson correlation of DESeq2 normalized counts of SIRT6 and PAX5 of muscle (GTEx, n = 881), microglia (GSE99074, n = 71), skin (GSE85861, n = 91), testis (GTEx, n = 410) and vagina (GTEx, n = 173) tissue.

Similar articles

Cited by

References

    1. Acosta JC, Banito A, Wuestefeld T, Georgilis A, Janich P, Morton JP, Athineos D, Kang T-W, Lasitschka F, Andrulis M et al (2013) A complex secretory program orchestrated by the inflammasome controls paracrine senescence. Nat Cell Biol 15:978–990 10.1038/ncb2784 - DOI - PMC - PubMed
    1. Athanikar JN, Badge RM, Moran JV (2004) A YY1-binding site is required for accurate human LINE-1 transcription initiation. Nucleic Acids Res 32:3846–3855 10.1093/nar/gkh698 - DOI - PMC - PubMed
    1. Becker KG, Swergold GD, Ozato K, Thayer RE (1993) Binding of the ubiquitous nuclear transcription factor YY1 to a cis regulatory sequence in the human LINE-1 transposable element. Hum Mol Genet 2:1697–702 10.1093/hmg/2.10.1697 - DOI - PubMed
    1. Bi S, Liu Z, Wu Z, Wang Z, Liu X, Wang S, Ren J, Yao Y, Zhang W, Song M et al (2020) SIRT7 antagonizes human stem cell aging as a heterochromatin stabilizer. Protein Cell 11:483–504 10.1007/s13238-020-00728-4 - DOI - PMC - PubMed
    1. Bulut-Karslioglu A, De La Rosa-Velázquez IA, Ramirez F, Barenboim M, Onishi-Seebacher M, Arand J, Galán C, Winter GE, Engist B, Gerle B et al (2014) Suv39h-dependent H3K9me3 marks intact retrotransposons and silences LINE elements in mouse embryonic stem cells. Mol Cell 55:277–290 10.1016/j.molcel.2014.05.029 - DOI - PubMed

MeSH terms

LinkOut - more resources