. 2024 Jun;6(6):1178-1196.
doi: 10.1038/s42255-024-01043-6. Epub 2024 Jun 12.

An unbiased ranking of murine dietary models based on their proximity to human metabolic dysfunction-associated steatotic liver disease (MASLD)

Michele Vacca #  1   2   3 Ioannis Kamzolas #  4   5 Lea Mørch Harder #  6 Fiona Oakley  7 Christian Trautwein  8 Maximilian Hatting  8 Trenton Ross  9 Barbara Bernardo  9 Anouk Oldenburger  10 Sara Toftegaard Hjuler  6 Iwona Ksiazek  11 Daniel Lindén  12   13 Detlef Schuppan  14 Sergio Rodriguez-Cuenca  4 Maria Manuela Tonini  15 Tamara R Castañeda  16 Aimo Kannt  17   18 Cecília M P Rodrigues  19 Simon Cockell  20 Olivier Govaere  21 Ann K Daly  21 Michael Allison  22 Kristian Honnens de Lichtenberg  6 Yong Ook Kim  14 Anna Lindblom  12 Stephanie Oldham  23 Anne-Christine Andréasson  24 Franklin Schlerman  25 Jonathon Marioneaux  26 Arun Sanyal  27 Marta B Afonso  19 Ramy Younes  21   28 Yuichiro Amano  29 Scott L Friedman  30 Shuang Wang  30 Dipankar Bhattacharya  30 Eric Simon  31 Valérie Paradis  32 Alastair Burt  21   33 Ioanna Maria Grypari  34 Susan Davies  35 Ann Driessen  36   37 Hiroaki Yashiro  38 Susanne Pors  39 Maja Worm Andersen  39 Michael Feigh  39 Carla Yunis  40 Pierre Bedossa  21   41 Michelle Stewart  42 Heather L Cater  42 Sara Wells  42 Jörn M Schattenberg  43 Quentin M Anstee  21   33 LITMUS InvestigatorsDina Tiniakos  44   45 James W Perfield  46 Evangelia Petsalaki  47 Peter Davidsen  48   49 Antonio Vidal-Puig  50   51
Collaborators, Affiliations

An unbiased ranking of murine dietary models based on their proximity to human metabolic dysfunction-associated steatotic liver disease (MASLD)

Michele Vacca et al. Nat Metab. 2024 Jun.

Abstract

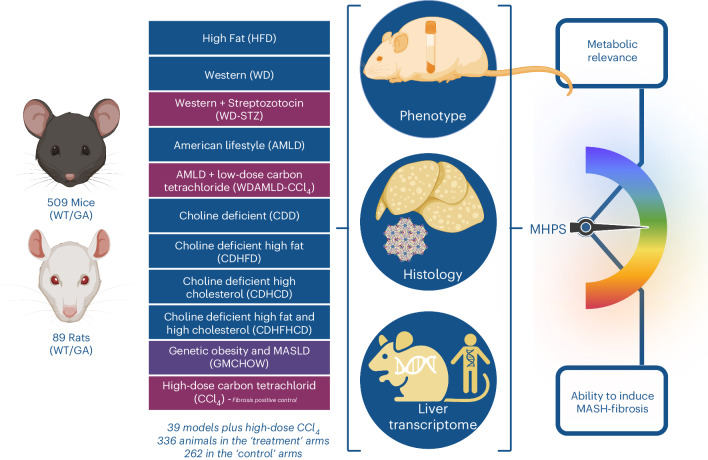
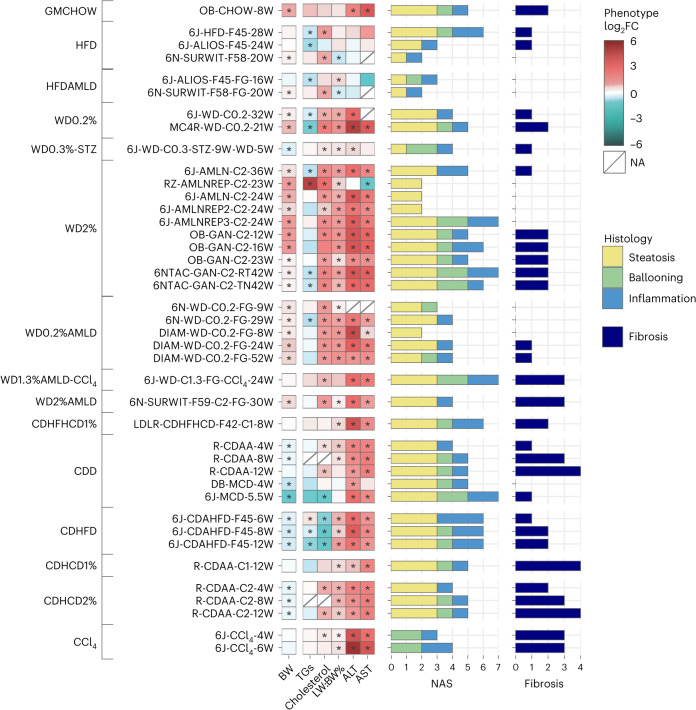
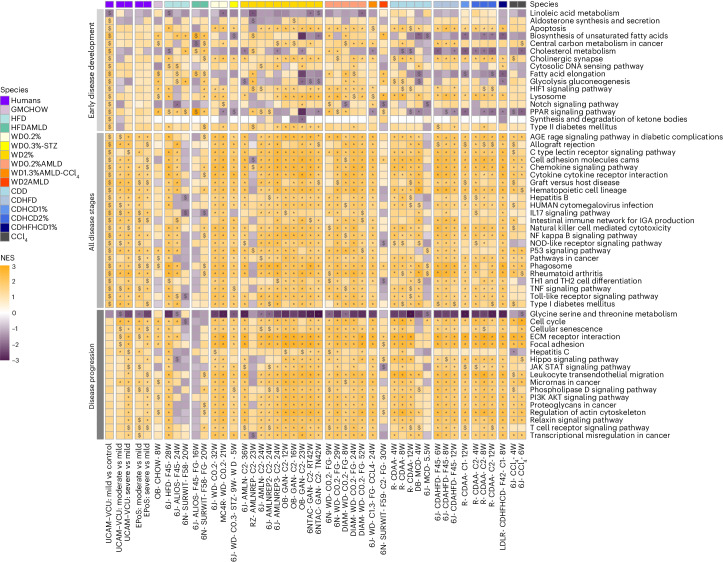
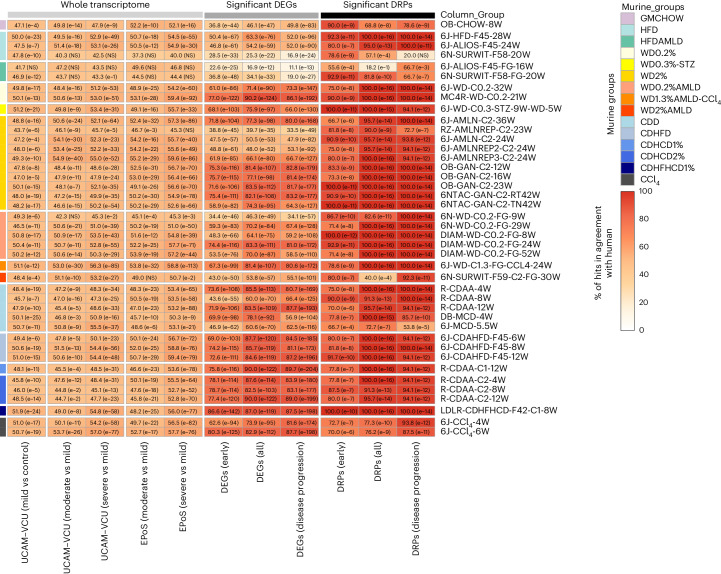
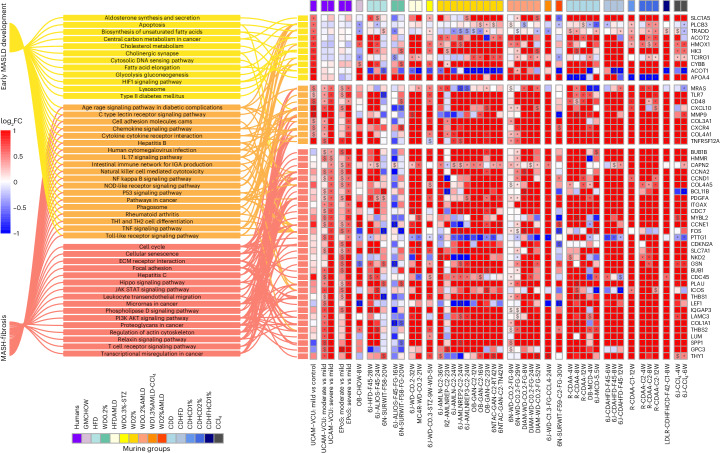
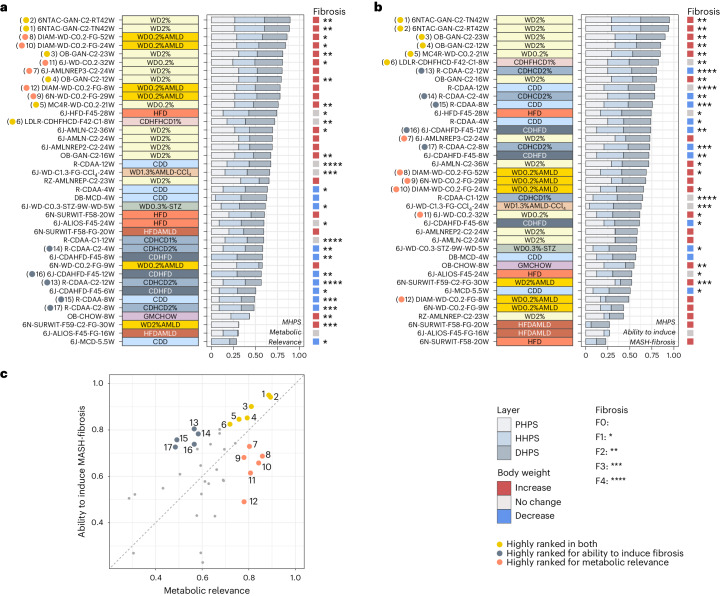
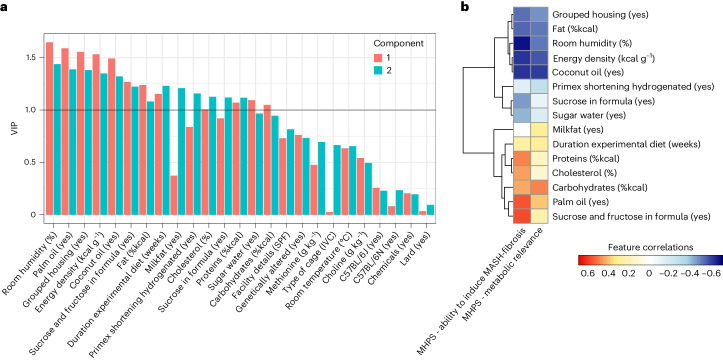
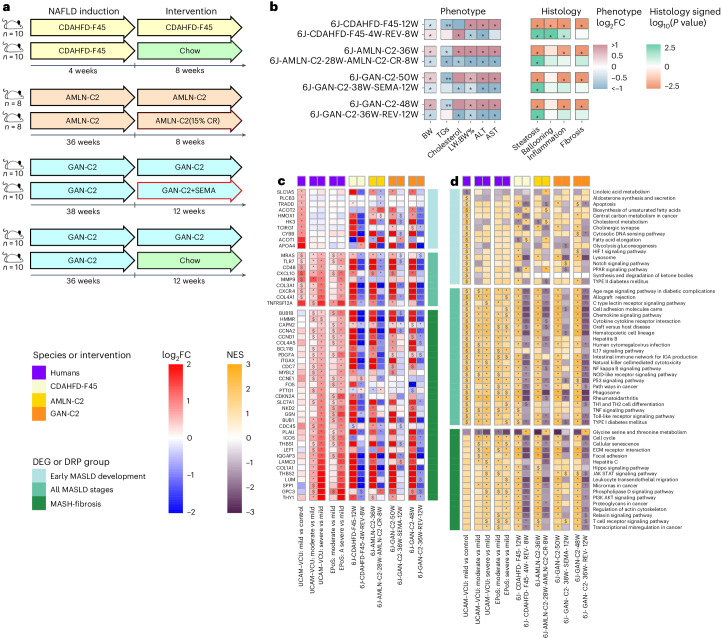
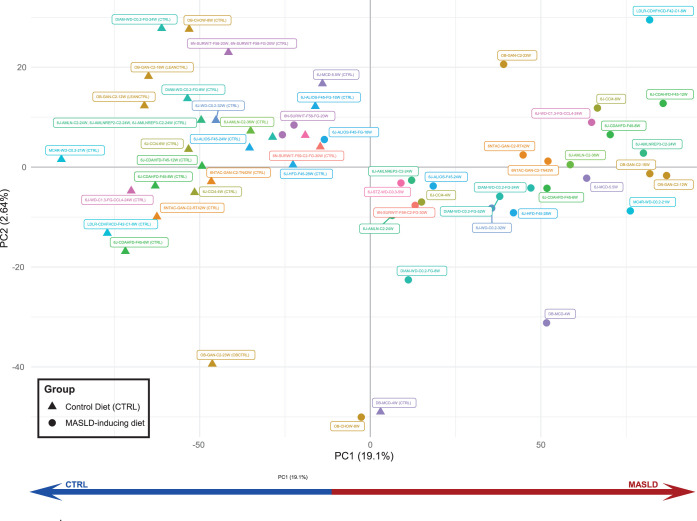
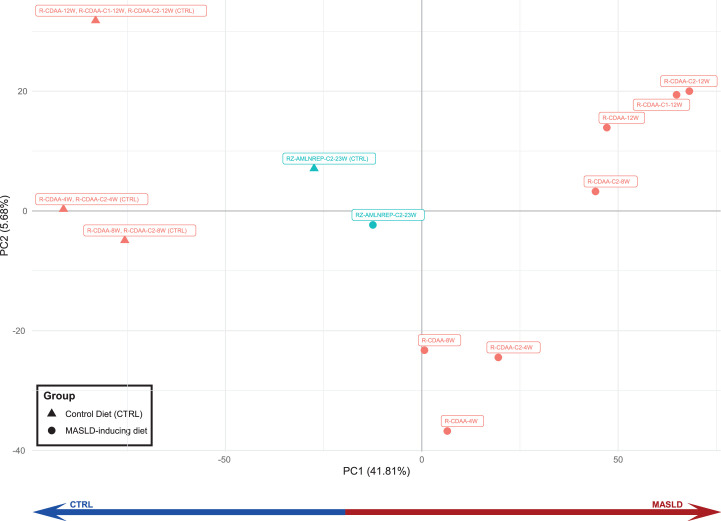
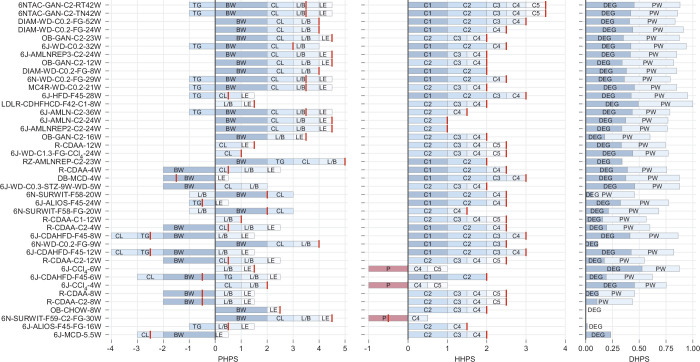
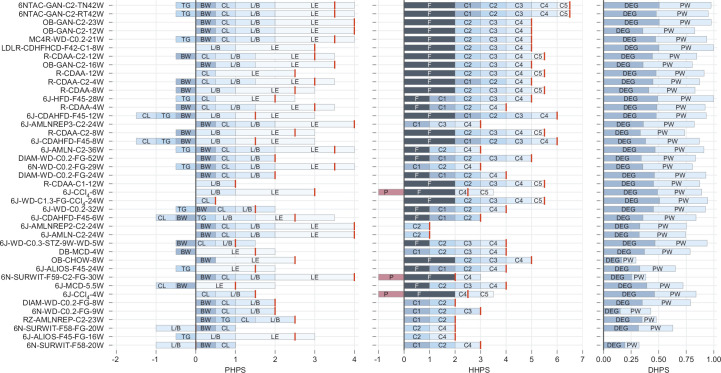
Metabolic dysfunction-associated steatotic liver disease (MASLD), previously known as non-alcoholic fatty liver disease, encompasses steatosis and metabolic dysfunction-associated steatohepatitis (MASH), leading to cirrhosis and hepatocellular carcinoma. Preclinical MASLD research is mainly performed in rodents; however, the model that best recapitulates human disease is yet to be defined. We conducted a wide-ranging retrospective review (metabolic phenotype, liver histopathology, transcriptome benchmarked against humans) of murine models (mostly male) and ranked them using an unbiased MASLD 'human proximity score' to define their metabolic relevance and ability to induce MASH-fibrosis. Here, we show that Western diets align closely with human MASH; high cholesterol content, extended study duration and/or genetic manipulation of disease-promoting pathways are required to intensify liver damage and accelerate significant (F2+) fibrosis development. Choline-deficient models rapidly induce MASH-fibrosis while showing relatively poor translatability. Our ranking of commonly used MASLD models, based on their proximity to human MASLD, helps with the selection of appropriate in vivo models to accelerate preclinical research.


Conflict of interest statement

M.V. consults for and receives research funding from Boehringer Ingelheim. J.W.P. is an Eli Lilly and Company employee and may own company stock or possess stock options. A.O. is an employee of Boehringer Ingelheim Pharma. K.G., C.Y., B.B., F.S. and T.R. are Pfizer employees and may own company stock or possess stock options. S.P., M.W.A. and M.F. are employees and own company stocks at Gubra. D.L., A.L., S.O. and A.C.A. are employees of AstraZeneca and may own company stock or possess stock options. F.O. is a director, shareholder and employee of Fibrofind Limited and a director and shareholder in Fibrofind IP Limited. All other authors report they have no conflicts of interest.

Figures

Fig. 1
Fig. 1. Study design.
In this study, we collected retrospective information from 598 animals (509 WT/GA mice, 89 WT/GA rats): 336 animals subjected to treatment (MASLD-inducing conditions: 315 animals; or CCl4: 21 animals) and 262 animals as controls for MASLD-inducing conditions (247 animals) or CCl4 (15 animals), returning 39 models (that is, study designs) aimed at modeling MASLD, and two time points for CCl4 (positive controls of MASLD-independent fibrosis). Details of the study designs (numerosity, species, background, genetic manipulation, diet, time point and room temperature) are provided in Supplementary Table 1. For all the studies, phenotypic information (Supplementary Table 5), centralized histopathology assessment (Supplementary Table 6) and liver transcriptomics (Supplementary Table 4) were available. These data were integrated into an unbiased binary score (MHPS) ranking the models in terms of their metabolic relevance and ability to induce MASH-fibrosis. Created with BioRender (agreement number GG26BHMS6Y).
Fig. 2
Fig. 2. Phenotypic and histologic characterization of the models.
Phenotypic changes observed in the MASLD models compared to their matched controls were profiled as the log2 fold change (log2FC) across measures of BW, blood triglycerides (TGs) and cholesterol, LW:BW% ratio, and ALT and AST. The red–blue color gradient indicates the level of increase–decrease of the measure in the MASLD models compared to their controls, while an asterisk indicates a significant change at P < 0.05 (two-sided Mann–Whitney U-test). The two panels of horizontal bars give an overview of the complete histological profiles, in which the total length indicates the activity score (CRN NAS) and fibrosis. In addition, NAS components (steatosis, ballooning and inflammation) are represented by the stacked bar (yellow, green and blue, respectively) lengths. All models are grouped according to their macro-categories (detailed by the leftmost annotations). Source data
Fig. 3
Fig. 3. DRPs in human and murine MASLD.
Selection of KEGG-affected pathways characterizing the ‘early disease development’, ‘all disease stages’ and ‘disease progression’ groups. The ‘early disease development’ group includes statistically significant (P < 0.05) modulated pathways in ‘mild vs controls’ but not in ‘moderate–severe vs mild’ human disease stages comparisons. The ‘all disease stages’ group includes statistically significant and homogeneously modulated pathways at all human disease stages (‘mild vs controls’ and ‘moderate–severe vs mild’ in both UCAM–VCU and EPoS); the ‘disease progression’ group includes homogeneously modulated and statistically significant pathways in ‘moderate–severe vs mild’ comparisons in both UCAM–VCU and EPoS but not in ‘mild vs controls’ comparisons. FGSEA calculated a normalized enrichment score (NES; the enrichment score normalized to mean enrichment of random samples of the same size) for each pathway and determined statistical significance using permutation testing (two-sided), adjusting for multiple comparisons to control the false discovery rate (FDR). The human and murine datasets are represented in a color-scale matrix showing the NES. * and $ symbols denote statistical significance ($, P < 0.05; *, FDR < 0.05). All models are grouped according to their macro-categories, as indicated by the panel on the top of the heatmap. Source data
Fig. 4
Fig. 4. Agreement of murine DEGs and DRPs with human MASLD.
Heatmap showing the agreement between murine MASLD models and human data based on the list of significant DEGs, DRPs, or the whole transcriptome. The percentage (%) of agreement between murine and human datasets defines the proportion of DEGs and DRPs statistically modulated and in the same direction compared to the human reference datasets (defined for ‘early disease development’, ‘all disease stages’ and ‘disease progression’ comparisons) or the proportion of DEGs statistically modulated and in the same direction compared to the human disease stage comparisons (defined for the whole transcriptome). All models are grouped according to their macro-categories as indicated in the graphic legend of the figure. Data are represented in a color-scale matrix showing the percentage of agreement and refer to DEGs (Supplementary Table 4; whole dataset or genes defined for ‘early disease development’, ‘all disease stages’ and ‘disease progression’, respectively) and DRPs (Fig. 3). In parenthesis, we show the results of the hypergeometric test (one-sided) performed on the same comparison groups, indicating the statistical significance (NS, non-significant (P > 0.05)). Source data
Fig. 5
Fig. 5. Highly performing genes in human and murine MASLD.
Selection of statistically significant DEGs (complete list in Supplementary Table 4) enriching statistically significant modulated pathways (complete list in Fig. 3), thus being highly biologically relevant genes associated with the different stages of MASLD development or progression. To assess the statistical significance between the compared groups, a Wald test statistic (two-sided hypothesis testing) was deployed to compare the coefficients of explanatory variables in a regression model, representing the gene expression differences among the compared groups. The human and murine datasets are represented in a color-scale matrix showing the log2FC. * and $ symbols denote statistical significance ($, P < 0.05; *, adjusted P < 0.05 (Benjamini–Hochberg correction)). As the graphic legend indicates, all models were grouped according to their macro-categories. Source data
Fig. 6
Fig. 6. The MHPS—metabolic relevance and progressive MASLD.
a,b, Comparison of the MASLD models, performed based on the MHPS that incorporates the PHPS (details in Supplementary Table 5), the HHPS (details in Supplementary Table 6) and the DHPS (see Supplementary Fig. 4). The average of these normalized scores (MHPS) ranks the murine models (from high to low) based on their metabolic relevance (a) or their ability to induce MASH-fibrosis (b). A detailed description of the different components is provided in Extended Data Figs. 3 and 4, respectively. For both a and b, the total length of the horizontal bars indicates the MHPS, while the length of the stacks within each bar indicates the relative contribution from the three evidence layers: PHPS, HHPS and DHPS. A reference panel to the right indicates BW (significant increases in red; decreases in blue) and fibrosis score (*). Macro-categories are indicated by the color panel to the left of the plots. c, Correlation among the two MHPS outputs (‘metabolic relevance’ vs ‘ability to induce MASH-fibrosis). Specific models are highlighted based on their performance within the two rankings. Yellow dots represent models that score high with both rankings and represent the best approximation to human MASH. Red dots are models that score highly for metabolic relevance but are less relevant for MASH-fibrosis. Grey dots are models that score highly for MASH-fibrosis but have less metabolic relevance. Panels a and b provide a specific reference to the position in the scatter. Source data
Fig. 7
Fig. 7. Key experimental components contributing to MHPS ‘metabolic relevance’ and ‘ability to induce MASH-fibrosis’ outputs.
Relationship between study design parameters and the MHPS of metabolic relevance and ability to induce MASH-fibrosis evaluated by PLSR. a, VIP for each study parameter (among those detailed in Supplementary Table 1) for the two components of the model. Parameters contributing the most to the PLSR model are characterized by having VIPs > 1 (black solid line) in any of the two components of the model. b, Clustered heatmap of the most influential study parameters (VIP > 1), indicating their correlation with the MHPS metabolic relevance and ability to induce MASH-fibrosis (color-scale matrix showing a positive correlation represented in red; negative correlation represented in blue). Source data
Fig. 8
Fig. 8. Effects of treatments in a selection of WD and choline-deficient models.
Response of the best-ranked diet (GAN-C2), another WD (AMLN-C2) and a CDHFD (CDAHFD-F45) to treatments mimicking lifestyle intervention (CR, caloric restriction; REV, chow reversal) and semaglutide pharmacological treatment (SEMA, 30 nmol per kg per day). a, Simplified study designs (details in Supplementary Table 7). b, Effect on the phenotype and histology. Phenotypic changes observed in the treatment or dietary models compared to their matched dietary models or controls, respectively, were profiled as log2FC across measures of BW, blood TGs and cholesterol, LW:BW%, and ALT and AST. The red–blue color gradient indicates the level of increase–decrease of the measure in the models compared to their respective controls; * indicates statistical significance (P < 0.05; two-sided Mann–Whitney U-test). For the histological changes, the Mann–Whitney U-test was used to calculate P values for the differences in the ordinal scores (P < 0.05 are shown with *). The color scale indicates the signed P value: −log10(P value) for up-regulation and +log10(P value) for down-regulation. c, Effect of treatments on a selection of biologically relevant DEGs as described in Fig. 5. The human and murine datasets are represented in a color-scale matrix showing the log2FC. * and $ symbols denote statistical significance (two-sided Wald test statistic and adjustment for multiple testing using the Benjamini–Hochberg correction; $: P < 0.05; *: adjusted P < 0.05). d, Effect of treatments on pathways as described in Fig. 3. FGSEA calculated a NES for each pathway and determined statistical significance using permutation testing (two-sided), adjusting for multiple comparisons to control the FDR. The human and murine datasets are represented in a color-scale matrix showing the NES. $, P < 0.05; *, FDR < 0.05). Source data
Extended Data Fig. 1
Extended Data Fig. 1. PCA plot of RNASeq data comparing the different mouse MASLD models.
The plot uses the normalised batch-corrected gene expression data. Each point represents a mouse model. The Controls (triangles) are clearly separated from the MASLD models (circles) according to the first principal component (PC1). Source data
Extended Data Fig. 2
Extended Data Fig. 2. PCA plot of RNASeq data comparing the different rat MASLD models.
The plot uses the normalised batch-corrected gene expression data. Each point represents a rat model. The Controls (triangles) are separated from the MASLD models (circles) according to the first principal component (PC1). Source data
Extended Data Fig. 3
Extended Data Fig. 3. Details of the MHPS components (PHPS, HHPS, DHPS) – Metabolic Relevance.
Bar plots show the detailed composition of the MHPS components (PHPS, HHPS, and DHPS) utilised for the output focusing on metabolic relevance. Models are ordered globally according to the MHPS, where each barplot gives an overview of the total PHPS, HHPS or DHPS, the associated features, and their corresponding scores (see Supplementary Tables 5 and 6 and Supplementary Fig. 4 for an overview of the scoring strategies). For each model, the total scores of PHPS and HHPS are represented by red vertical lines to overcome the fact that some features are scored negatively. For PHPS and HHPS, the length of the stacked bars represents the scores’ absolute values (before normalising to the interval 0-1). DHPS directly shows the normalised score. Feature scores included are abbreviated as follows: PHPS: BW = Body weight, TG = Triglycerides, CL = Cholesterol, L/B = Liver Weight/Body weight (%), LE = Liver enzyme levels of ALT & AST; HHPS: C1 = Topography of histological lesions, C2 = Type of steatosis, C3 = Hepatocyte ballooning, C4 = Lobular inflammation, C5 = Mallory-Denk bodies; DHPS: DEG = Differentially Expressed Genes, DRP = Differentially Regulated Pathways. Source data
Extended Data Fig. 4
Extended Data Fig. 4. Details of the MHPS components (PHPS, HHPS, DHPS) – Ability to induce MASH-Fibrosis.
Bar plots show the detailed composition of the MHPS components (PHPS, HHPS, and DHPS) for the output focusing on the ability to induce MASH-Fibrosis. Models are ordered globally according to the MHPS, where each barplot gives an overview of the total PHPS, HHPS or DHPS, associated features, and corresponding scores (see Supplementary Tables 5 and 6 and Supplementary Fig. 4 for an overview of the scoring strategies). For each model, the total scores of PHPS and HHPS are represented by red vertical lines to overcome the fact that some features are scored negatively. For PHPS and HHPS, the length of the stacked bars represents absolute scores' absolute values (before normalising to the interval 0-1). DHPS shows the normalised score directly. Feature scores included are abbreviated as follows: PHPS: BW = Body weight, TG = Triglycerides, CL = Cholesterol, L/B = Liver Weight/Body weight (%), LE = Liver enzyme levels of ALT & AST; HHPS: C1 = Topography of histological lesions, C2 = Type of steatosis, C3 = Hepatocyte ballooning, C4 = Lobular inflammation, C5 = Mallory-Denk bodies, F(C6) = Fibrosis; and for DHPS: DEG = Differentially Expressed Genes, DRP = Differentially Regulated Pathways. Source data
Extended Data Fig. 5
Extended Data Fig. 5. Representative images of MASLD histopathology features in the 6NTAC-GAN-C2-TN42W model.
a. Panlobular distribution of steatosis, grade 3, H&E stain, x50; b. Ballooned hepatocyte (arrow), H&E stain, x200; c. Necroinflammatory focus (arrowhead), H&E stain, x200; d. Periportal and extensive sinusoidal fibrosis, stage 2, Sirius red stain, x50 (THV terminal hepatic venule, PT portal tract).
Extended Data Fig. 6
Extended Data Fig. 6. Representative images of MASLD histopathology features in the 6NTAC-GAN-C2-RT42W model.
a. Panlobular distribution of steatosis, grade 3, H&E stain, x50; b. Necroinflammatory foci (arrowheads), H&E stain, x200; c. Ballooned Hepatocyte (arrow), H&E stain, x200; d. Periportal and perisinusoidal fibrosis, stage 2, Sirius red stain, x50 (THV terminal hepatic venule, PT portal tract).
Extended Data Fig. 7
Extended Data Fig. 7. Representative images of MASLD histopathology features in the AZ-OB-GAN-23W model.
a. Panlobular distribution of steatosis, grade 3, H&E stain, x50; b. Non-classical ballooned hepatocyte (arrow) and necroinflammatory foci (arrowheads), H&E stain, x200; c. Periportal and perisinusoidal fibrosis, stage 2, Sirius red stain, x50 (THV terminal hepatic venule, PT portal tract).
Extended Data Fig. 8
Extended Data Fig. 8. Representative images of MASLD histopathology features in the OB-GAN-C2-12W model.
a. Panlobular distribution of steatosis, grade 3, H&E stain, x50; b. Necroinflammatory focus (arrowhead), H&E stain, x200; c. Ballooned hepatocyte (arrow), H&E stain, x200; d. Periportal and perisinusoidal fibrosis, stage 2, Sirius red stain, x50 (THV terminal hepatic venule, PT portal tract).
Extended Data Fig. 9
Extended Data Fig. 9. Representative images of MASLD histopathology features in the MC4R-WD-C0.2-21W model.
a. Panlobular distribution of steatosis, grade 3, H&E stain, x50; b. Necroinflammatory foci (arrowheads), H&E stain, x200; c. Ballooned hepatocytes (arrows), H&E stain, x200; d. Periportal and perisinusoidal fibrosis, stage 2, Sirius red fast green stain, x50 (THV terminal hepatic venule, PT portal tract).
Extended Data Fig. 10
Extended Data Fig. 10. Representative images of MASLD histopathology features in the LDLR-CDHFHCD-F42-C1-8W model.
a. Panlobular distribution of steatosis, grade 3, H&E stain, x50; b. Periportal and perisinusoidal fibrosis, stage 2, Sirius red stain, x50; c) Necroinflammatory foci (arrowheads), H&E stain, x200; d. Ballooned hepatocyte (arrow), H&E stain, x200 THV terminal hepatic venule, PT portal tract).

Similar articles

Cited by

  • No single perfect mouse model of MASH.
    Goodman RP. Goodman RP. Nat Metab. 2024 Jun;6(6):996-997. doi: 10.1038/s42255-024-01052-5. Nat Metab. 2024. PMID: 38867021 No abstract available.
  • Molecular Regulation and Therapeutic Targeting of VLDL Production in Cardiometabolic Disease.
    Burks KH, Stitziel NO, Davidson NO. Burks KH, et al. Cell Mol Gastroenterol Hepatol. 2025;19(1):101409. doi: 10.1016/j.jcmgh.2024.101409. Epub 2024 Oct 12. Cell Mol Gastroenterol Hepatol. 2025. PMID: 39406347 Free PMC article. Review.
  • Liver gene expression and its rewiring in hepatic steatosis are controlled by PI3Kα-dependent hepatocyte signaling.
    Régnier M, Polizzi A, Fougeray T, Fougerat A, Perrier P, Anderson K, Lippi Y, Smati S, Lukowicz C, Lasserre F, Fouche E, Huillet M, Rives C, Tramunt B, Naylies C, Garcia G, Rousseau-Bacquié E, Bertrand-Michel J, Canlet C, Chevolleau-Mege S, Debrauwer L, Heymes C, Burcelin R, Levade T, Gourdy P, Wahli W, Blum Y, Gamet-Payrastre L, Ellero-Simatos S, Guillermet-Guibert J, Hawkins P, Stephens L, Postic C, Montagner A, Loiseau N, Guillou H. Régnier M, et al. PLoS Biol. 2025 Apr 14;23(4):e3003112. doi: 10.1371/journal.pbio.3003112. eCollection 2025 Apr. PLoS Biol. 2025. PMID: 40228209 Free PMC article.
  • Experimental Models to Investigate PNPLA3 in Liver Steatosis.
    Ramandi A, Diehl AM, Sanyal AJ, de Jong YP. Ramandi A, et al. Liver Int. 2025 May;45(5):e70091. doi: 10.1111/liv.70091. Liver Int. 2025. PMID: 40231787 Free PMC article. Review.
  • Advances in Extracellular Matrix-Associated Diagnostics and Therapeutics.
    Karsdal M, Cox TR, Parker AL, Willumsen N, Sand JMB, Jenkins G, Hansen HH, Oldenburger A, Geillinger-Kaestle KE, Larsen AT, Black D, Genovese F, Eckersley A, Heinz A, Nyström A, Holm Nielsen S, Bennink L, Johannsson L, Bay-Jensen AC, Orange DE, Friedman S, Røpke M, Fiore V, Schuppan D, Rieder F, Simona B, Borthwick L, Skarsfeldt M, Wennbo H, Thakker P, Stoffel R, Clarke GW, Kalluri R, Ruane D, Zannad F, Mortensen JH, Sinkeviciute D, Sundberg F, Coseno M, Thudium C, Croft AP, Khanna D, Cooreman M, Broermann A, Leeming DJ, Mobasheri A, Ricard-Blum S. Karsdal M, et al. J Clin Med. 2025 Mar 10;14(6):1856. doi: 10.3390/jcm14061856. J Clin Med. 2025. PMID: 40142664 Free PMC article. Review.

References

    1. Younossi Z, et al. Global burden of NAFLD and NASH: trends, predictions, risk factors and prevention. Nat. Rev. Gastroenterol. Hepatol. 2018;15:11–20. doi: 10.1038/nrgastro.2017.109. - DOI - PubMed
    1. Poirier P, et al. Obesity and cardiovascular disease: pathophysiology, evaluation, and effect of weight loss: an update of the 1997 American Heart Association Scientific Statement on Obesity and Heart Disease from the Obesity Committee of the Council on Nutrition, Physical Activity, and Metabolism. Circulation. 2006;113:898–918. doi: 10.1161/CIRCULATIONAHA.106.171016. - DOI - PubMed
    1. Flegal KM, Kit BK, Orpana H, Graubard BI. Association of all-cause mortality with overweight and obesity using standard body mass index categories: a systematic review and meta-analysis. JAMA. 2013;309:71–82. doi: 10.1001/jama.2012.113905. - DOI - PMC - PubMed
    1. Rinella ME, et al. A multisociety Delphi consensus statement on new fatty liver disease nomenclature. Hepatology. 2023;78:1966–1986. doi: 10.1097/HEP.0000000000000520. - DOI - PMC - PubMed
    1. Tiniakos DG, Vos MB, Brunt EM. Nonalcoholic fatty liver disease: pathology and pathogenesis. Annu. Rev. Pathol. 2010;5:145–171. doi: 10.1146/annurev-pathol-121808-102132. - DOI - PubMed

Grants and funding