. 2024 Jul;631(8019):98-105.
doi: 10.1038/s41586-024-07547-1. Epub 2024 Jun 12.

Global variability in atmospheric new particle formation mechanisms

Affiliations

Global variability in atmospheric new particle formation mechanisms

Bin Zhao et al. Nature. 2024 Jul.

Abstract

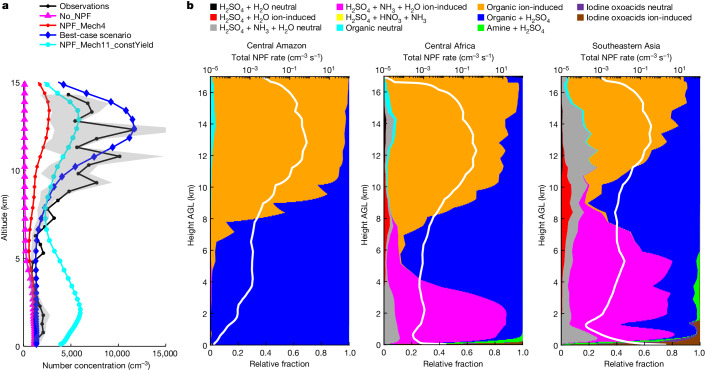
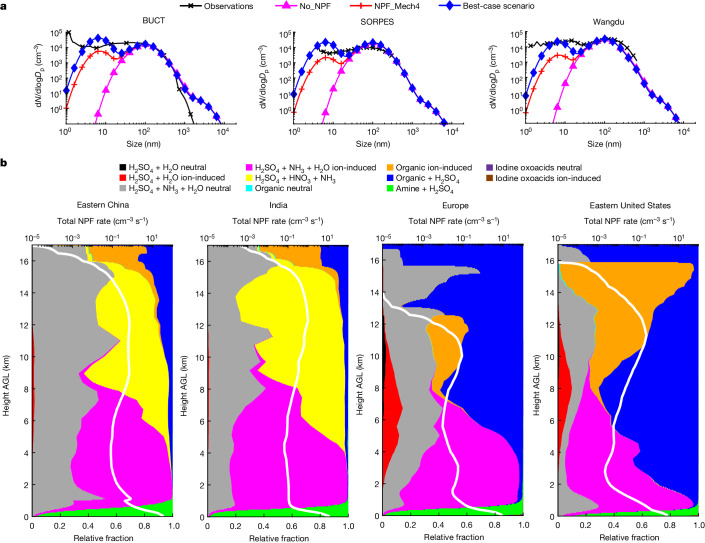
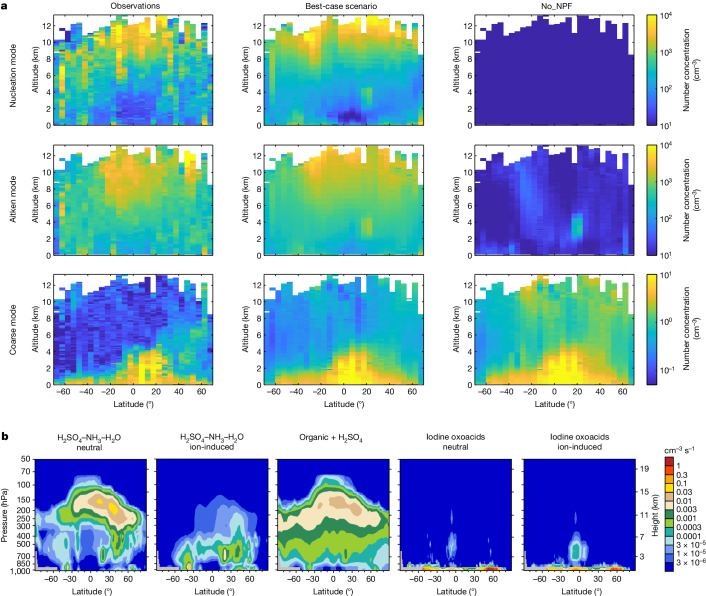
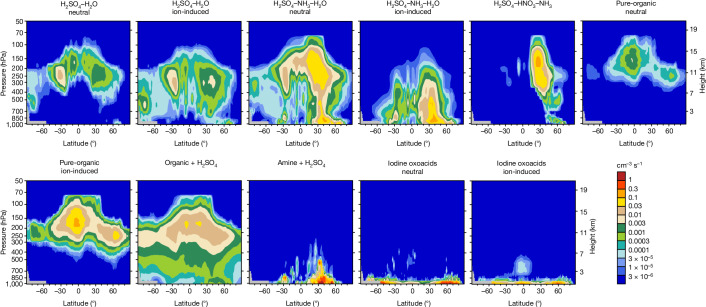
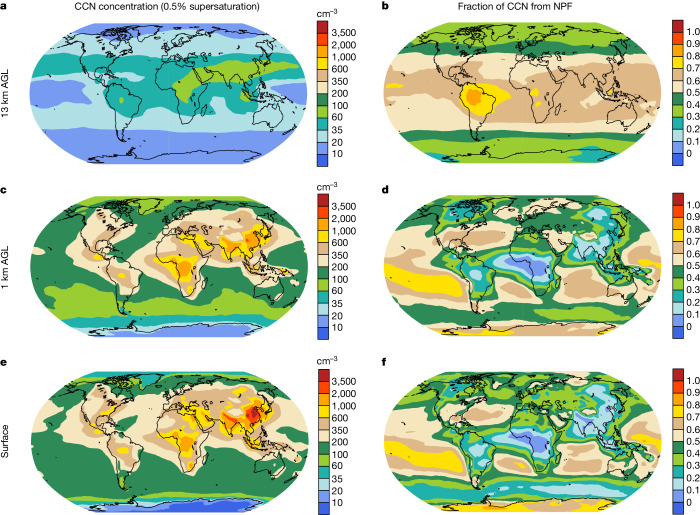
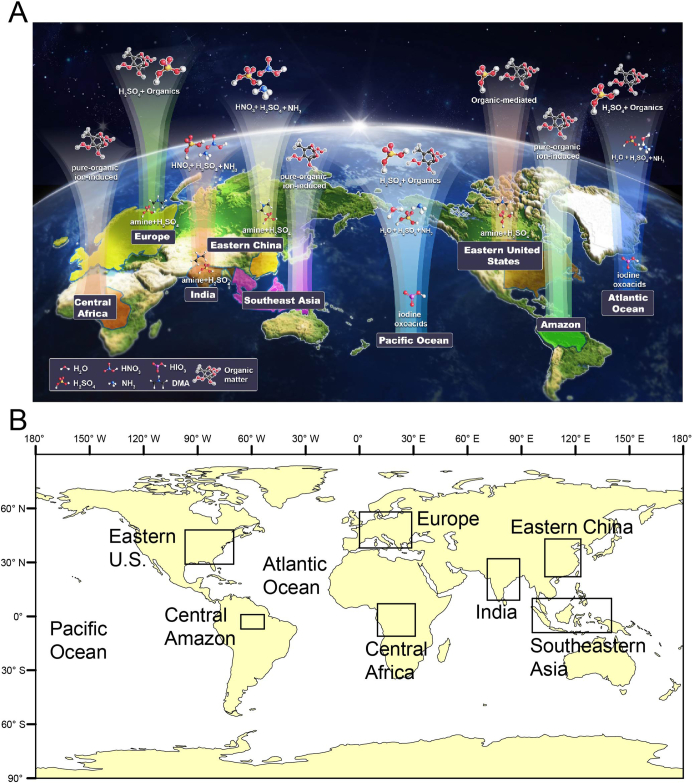
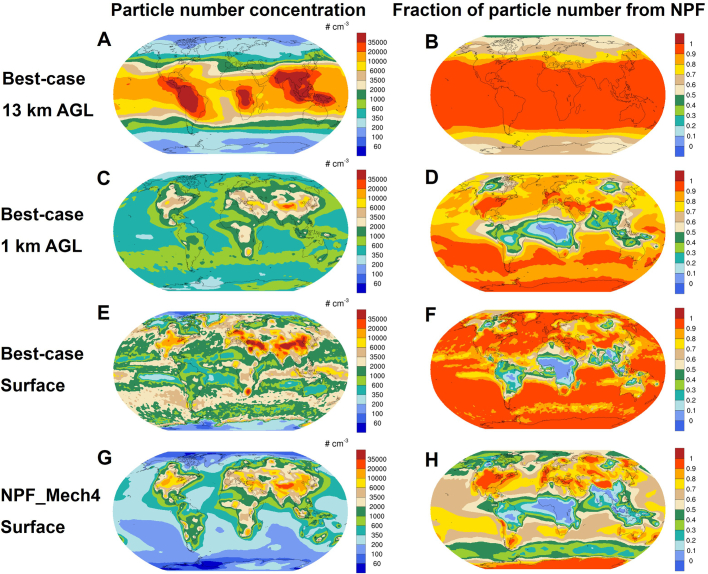
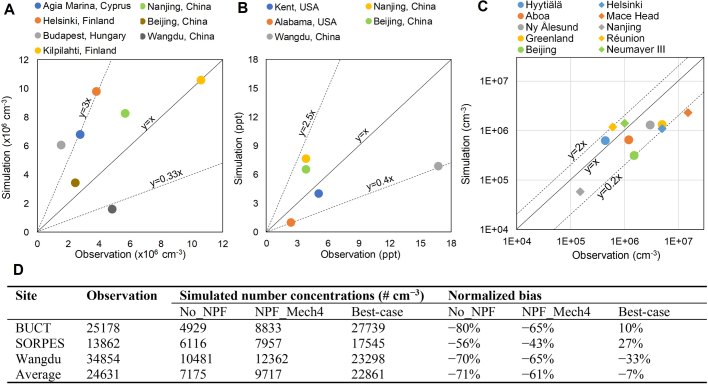
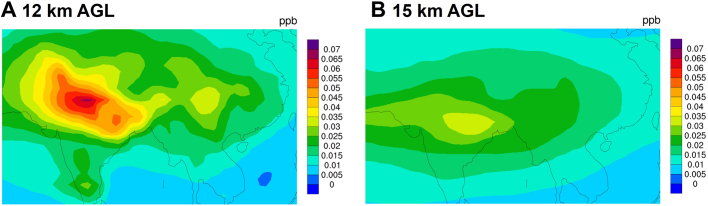
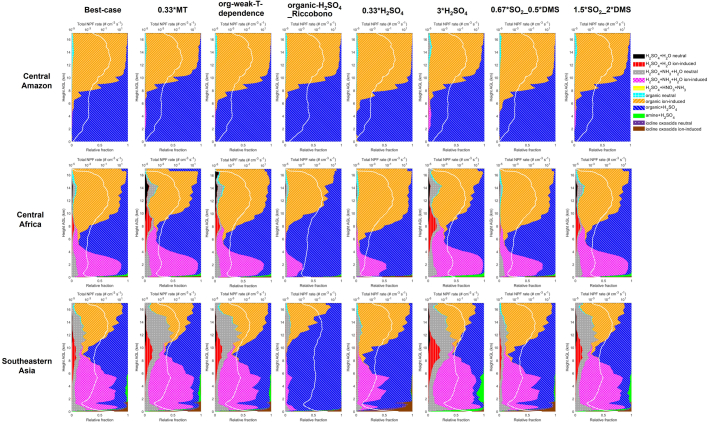
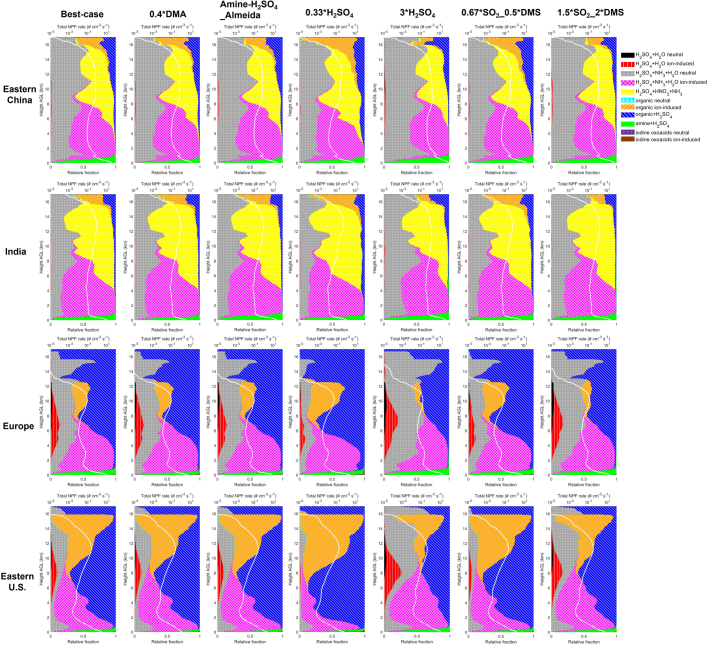
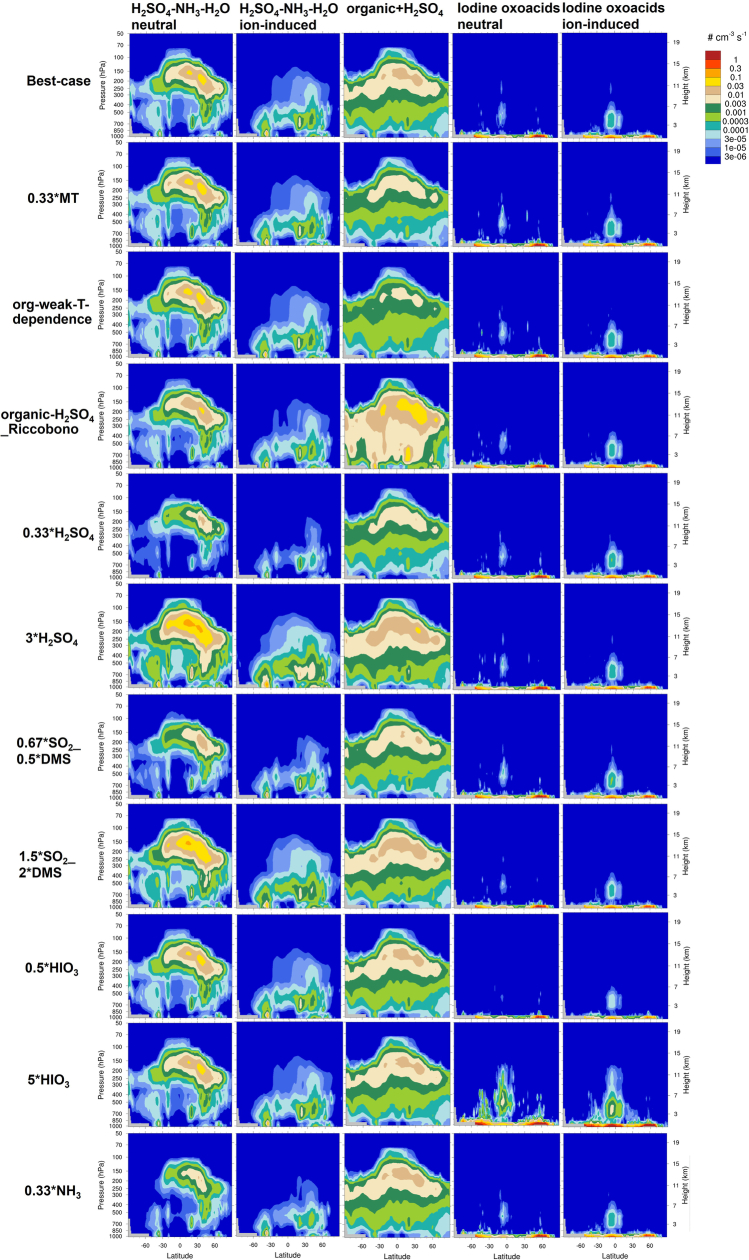
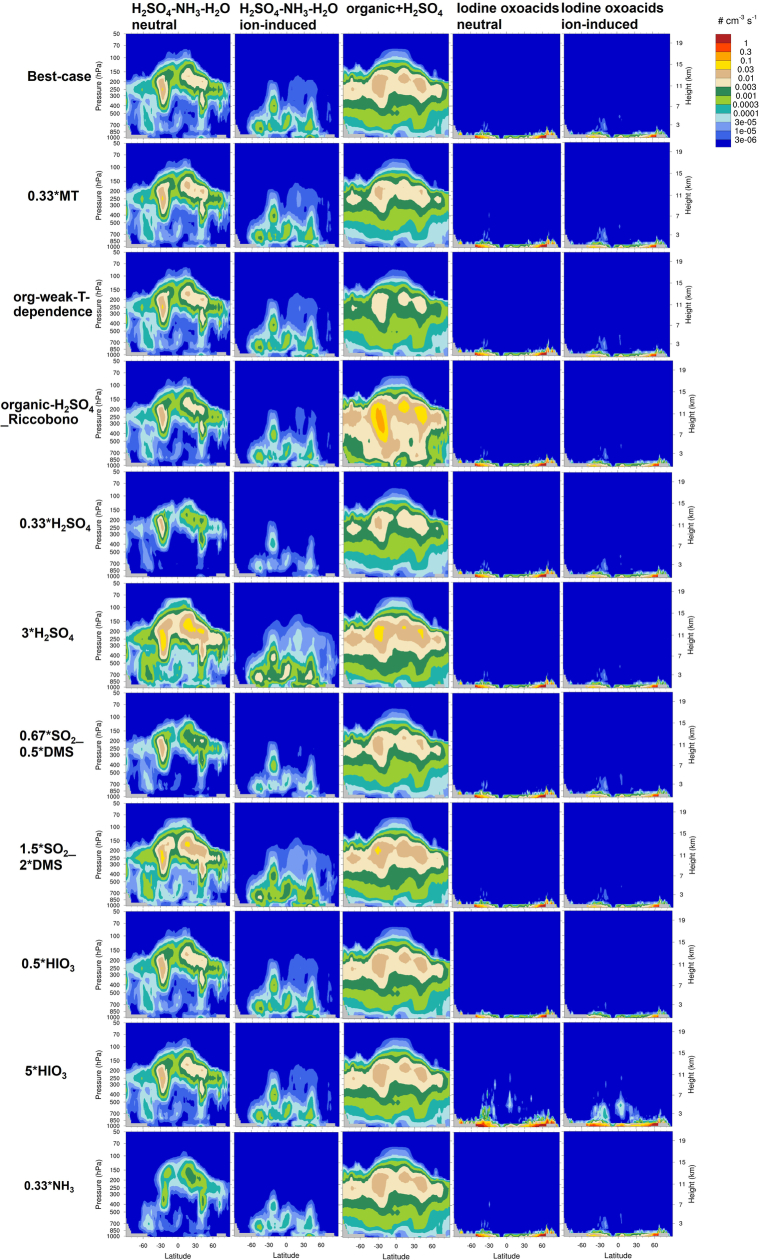
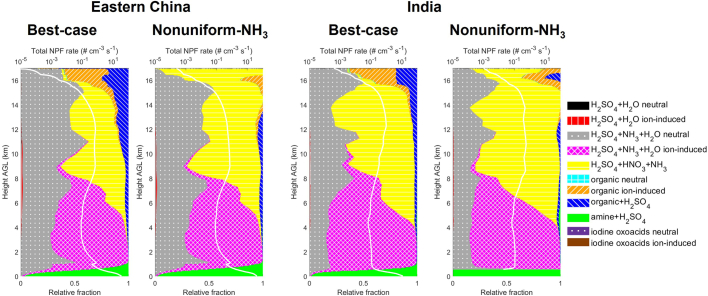
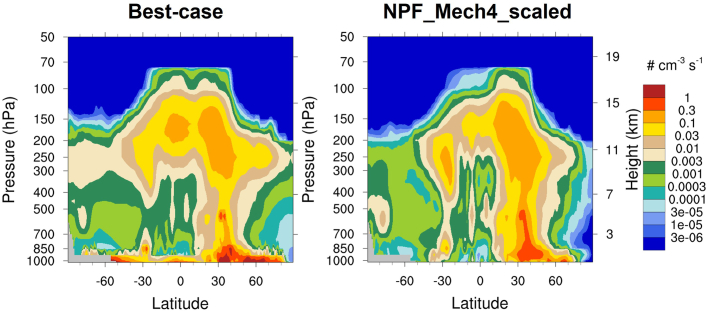
A key challenge in aerosol pollution studies and climate change assessment is to understand how atmospheric aerosol particles are initially formed1,2. Although new particle formation (NPF) mechanisms have been described at specific sites3-6, in most regions, such mechanisms remain uncertain to a large extent because of the limited ability of atmospheric models to simulate critical NPF processes1,7. Here we synthesize molecular-level experiments to develop comprehensive representations of 11 NPF mechanisms and the complex chemical transformation of precursor gases in a fully coupled global climate model. Combined simulations and observations show that the dominant NPF mechanisms are distinct worldwide and vary with region and altitude. Previously neglected or underrepresented mechanisms involving organics, amines, iodine oxoacids and HNO3 probably dominate NPF in most regions with high concentrations of aerosols or large aerosol radiative forcing; such regions include oceanic and human-polluted continental boundary layers, as well as the upper troposphere over rainforests and Asian monsoon regions. These underrepresented mechanisms also play notable roles in other areas, such as the upper troposphere of the Pacific and Atlantic oceans. Accordingly, NPF accounts for different fractions (10-80%) of the nuclei on which cloud forms at 0.5% supersaturation over various regions in the lower troposphere. The comprehensive simulation of global NPF mechanisms can help improve estimation and source attribution of the climate effects of aerosols.


Conflict of interest statement

The authors declare no competing interests.

Figures

Fig. 1
Fig. 1. Mechanisms of NPF and constraints from observations over rainforests.
a, Comparison of simulated particle number concentrations with aircraft measurements obtained over the Amazon during the ACRIDICON-CHUVA campaign in September 2014. Both simulations and observations are for particles >10 nm near the surface and 20 nm above the altitude of 13.8 km, with smooth transition between. The lines represent mean concentrations within each vertical bin and the shaded areas represent the 25th to 75th percentiles of the observations. All particle number concentrations are normalized to standard temperature and pressure (273.15 K and 101.325 kPa). Definitions of the model scenarios are given in the main text and Supplementary Table 1. b, NPF rates as a function of height AGL over the Central Amazon, Central Africa and Southeastern Asia. White lines represent the total NPF rates of all mechanisms at a diameter of 1.7 nm (J1.7, on a log scale) and the coloured areas represent the relative contributions of different mechanisms, both averaged in 2016 over the regions specified in Extended Data Fig. 1b. Source Data
Fig. 2
Fig. 2. Mechanisms of NPF and constraints from observations over anthropogenically polluted regions.
a, Comparison of simulated particle number size distributions with observations obtained at three sites in China: BUCT (Beijing University of Chemical Technology), Beijing; SORPES (Station for Observing Regional Processes of the Earth System), Nanjing; Wangdu, Hebei. All particle number size distributions are normalized to standard temperature and pressure. Definitions of the model scenarios are given in the main text and Supplementary Table 1. We do not expect the model to exactly capture the shape of the ultrafine number size distribution because the model uses a mode approach to represent particle size. b, NPF rates as a function of height AGL over Eastern China, India, Europe and the Eastern United States. White lines represent the total NPF rates at a diameter of 1.7 nm (J1.7, on a log scale) and the coloured areas represent the relative contributions of different mechanisms, both averaged in 2016 over the regions specified in Extended Data Fig. 1b. Source Data
Fig. 3
Fig. 3. Mechanisms of NPF and constraints from observations over oceans.
a, Comparison of simulated number concentrations of nucleation-mode, Aitken-mode and coarse-mode particles with aircraft observations obtained over the Pacific and Atlantic oceans. The observations were obtained during the ATom campaign in July–August 2016, January–February 2017, September–October 2017 and April–May 2018. Simulation results are matched to individual observational data based on time and location. Model–observation pairs are grouped into two-dimensional bins defined by latitude (every 5°) and altitude (every 100 m) and the average particle number concentrations in each bin are calculated and plotted. All particle number concentrations are normalized to standard temperature and pressure. b, Zonal mean NPF rates of individual mechanisms over the Pacific Ocean (170° E–150° W) in 2016. Only five NPF mechanisms are shown because the other six mechanisms are negligible in these regions. NPF rates over the Atlantic Ocean are shown in Extended Data Fig. 8 (first row). Source Data
Fig. 4
Fig. 4. Zonal mean NPF rates globally in 2016.
Each panel displays the rate of an individual NPF mechanism. Source Data
Fig. 5
Fig. 5. CCN concentrations and fractions of CCN caused by NPF at different vertical levels in 2016.
a,c,e, Spatial distribution of CCN concentrations at 0.5% supersaturation (CCN0.5%) at 13 km AGL (a), 1 km AGL (approximately at the low-cloud level) (c) and surface level (e). b,d,e, Fractions of CCN0.5% caused by NPF at 13 km AGL (b), 1 km AGL (d) and surface level (f). All concentrations are normalized to standard temperature and pressure. Maps were created using the NCAR Command Language (version 6.6.2), 10.5065/D6WD3XH5. Source Data
Extended Data Fig. 1
Extended Data Fig. 1. Schematic of regionally leading NPF mechanisms and spatial extent for quantitative analyses.
a, Schematic of the leading NPF mechanisms in the boundary layer and upper troposphere of the regions of interest. Note, in the upper troposphere above the Pacific and Atlantic oceans, organic–H2SO4 nucleation and H2SO4–NH3–H2O neutral nucleation are identified as two primary NPF mechanisms. b, Spatial extent of the regions of interest used in our quantitative analyses. Panel b was created with ArcGIS 10 using free map data made by Natural Earth (https://www.naturalearthdata.com/).
Extended Data Fig. 2
Extended Data Fig. 2. Number concentrations of particles across the entire size range and the fractions caused by NPF at different vertical levels in 2016.
a,c,e, Spatial distribution of particle number concentrations at 13 km AGL (a), 1 km AGL (approximately at the low-cloud level) (c) and surface level from the best-case simulation (e). b,d,f, Fractions of particle number concentrations from NPF at 13 km AGL (b), 1 km AGL (d) and surface level, based on the difference between the best-case and No_NPF scenarios (f). g, Spatial distribution of particle number concentrations at surface level from the NPF_Mech4 scenario. h, Fractions of particle number concentrations from NPF at surface level, based on the difference between the NPF_Mech4 and No_NPF scenarios. Definitions of the scenarios are presented in Methods and Supplementary Table 1. Particle number concentrations cover the entire size range (note that field observations are mostly made for particles larger than a certain cutoff size) and are normalized to standard temperature and pressure (273.15 K and 101.325 kPa). The zonal mean particle number concentrations and the fractions caused by NPF are presented in Supplementary Fig. 12. Maps were created using the NCAR Command Language (version 6.6.2), https://doi.org/10.5065/D6WD3XH5.
Extended Data Fig. 3
Extended Data Fig. 3. Further evaluation of model performance at observational sites over oceanic and human-polluted continental regions.
Comparison of simulated H2SO4 (a) and DMA (b) concentrations with observations in anthropogenically polluted regions. We list the time ranges and sources of the observational data as follows. a, H2SO4: Agia Marina, Cyprus, February 2018, Dada et al.; Helsinki, Finland, July 2019, Dada et al.; Budapest, Hungary, March–April 2018, Dada et al.; Kilpilahti, Finland, June 2012, Dada et al.; Nanjing, China, January, April, July, November 2018, Yang et al.; Beijing, China, January–April and October–December 2018, Deng et al.; Wangdu, China, December 2018 and January 2019, Wang et al.. b, DMA: Kent, USA, November 2011 and August–September 2013, You et al.; Alabama, USA, June 2013, You et al.; Wangdu, China, December 2018 and January 2019, Wang et al.; Nanjing, China, August–September 2012, Zheng et al.; Beijing, China, January–March and October–December 2018, Cai et al.. c, Comparison of simulated HIO3 concentrations with observations at ten oceanic or coastal sites worldwide. Simulated concentrations are averaged over the nine model grids encompassing an observational site. Locations of the sites and time periods of observations are summarized in He et al.. d, Statistics of simulated and observed number concentrations of ultrafine particles (diameter <100 nm) at three observational sites in China.
Extended Data Fig. 4
Extended Data Fig. 4. Simulated NH3 concentrations in the upper troposphere over the Asian monsoon region in June–August 2016.
Concentrations at 12 and 15 km AGL are shown to facilitate comparison with satellite observations reported by Höpfner et al. (their Fig. 5) and Höpfner et al. (their Supplementary Fig. 5).
Extended Data Fig. 5
Extended Data Fig. 5. NPF rates as a function of height AGL over rainforests under the best-case and sensitivity scenarios.
White lines represent the total NPF rates of all mechanisms at a diameter of 1.7 nm (J1.7, on a log scale) and the coloured areas represent the relative contributions of different mechanisms, both averaged in 2016 over the regions specified in Extended Data Fig. 1b. Definitions of the sensitivity experiments are presented in Methods and Supplementary Table 1.
Extended Data Fig. 6
Extended Data Fig. 6. NPF rates as a function of height AGL over anthropogenically polluted regions under the best-case and sensitivity scenarios.
White lines represent the total NPF rates of all mechanisms at a diameter of 1.7 nm (J1.7, on a log scale) and the coloured areas represent the relative contributions of different mechanisms, both averaged in 2016 over the regions specified in Extended Data Fig. 1b. Definitions of the sensitivity experiments are presented in Methods and Supplementary Table 1.
Extended Data Fig. 7
Extended Data Fig. 7. Zonal mean NPF rates of individual mechanisms over the Pacific Ocean (170° E–150° W) under the best-case and sensitivity scenarios in 2016.
Only five NPF mechanisms are shown because the other mechanisms are negligible in these regions. Definitions of the sensitivity experiments are presented in Methods and Supplementary Table 1.
Extended Data Fig. 8
Extended Data Fig. 8. Same as Extended Data Fig. 7 but for the Atlantic Ocean (20° W–40° W)
.
Extended Data Fig. 9
Extended Data Fig. 9. NPF rates as a function of height AGL over Eastern China and India, which are parts of the Asian monsoon region, under the best-case scenario and a sensitivity scenario that assumes that NH3 concentration accumulates in a small fraction of a model grid.
White lines represent the total NPF rates of all mechanisms at a diameter of 1.7 nm (J1.7, on a log scale) and the coloured areas represent the relative contributions of different mechanisms, both averaged in 2016 over the regions specified in Extended Data Fig. 1b. For a scenario intermediate between the best-case simulation and the above sensitivity simulation, the contribution of H2SO4–HNO3–NH3 nucleation could be even higher, because the limitation of H2SO4 availability may not be as strong as in the above sensitivity simulation.
Extended Data Fig. 10
Extended Data Fig. 10. Comparison between simulated zonal mean NPF rates in two scenarios.
a, Best-case simulation including 11 nucleation mechanisms. b, A sensitivity simulation that includes only four traditional nucleation mechanisms (neutral and ion-induced H2SO4–H2O nucleation and H2SO4–NH3–H2O nucleation) but scales the NPF rates of these mechanisms to match the globally averaged NPF rate of the best-case simulation.

References

    1. Lee S-H, et al. New particle formation in the atmosphere: from molecular clusters to global climate. J. Geophys. Res. Atmos. 2019;124:7098–7146.
    1. Kulmala M, et al. Is reducing new particle formation a plausible solution to mitigate particulate air pollution in Beijing and other Chinese megacities? Faraday Discuss. 2021;226:334–347. - PubMed
    1. Yao L, et al. Atmospheric new particle formation from sulfuric acid and amines in a Chinese megacity. Science. 2018;361:278–281. - PubMed
    1. Cai R, et al. Sulfuric acid-amine nucleation in urban Beijing. Atmos. Chem. Phys. 2021;21:2457–2468.
    1. Baccarini A, et al. Frequent new particle formation over the high Arctic pack ice by enhanced iodine emissions. Nat. Commun. 2020;11:4924. - PMC - PubMed

LinkOut - more resources