Randomized Controlled Trial
. 2024 Jun;630(8018):920-925.
doi: 10.1038/s41586-024-07500-2. Epub 2024 Jun 12.

Hybrid working from home improves retention without damaging performance

Affiliations
Randomized Controlled Trial

Hybrid working from home improves retention without damaging performance

Nicholas Bloom et al. Nature. 2024 Jun.

Abstract

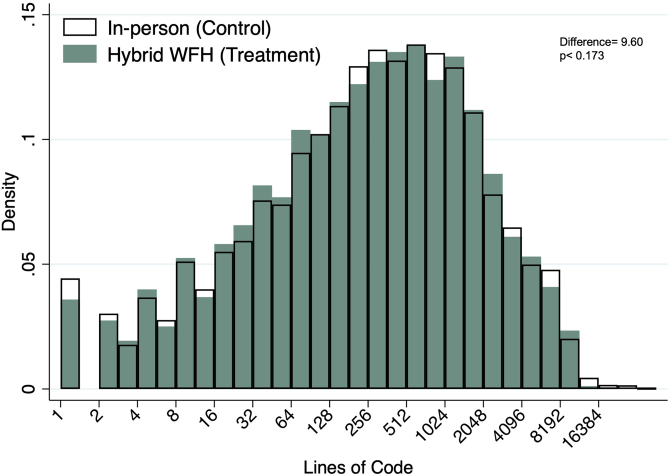
Working from home has become standard for employees with a university degree. The most common scheme, which has been adopted by around 100 million employees in Europe and North America, is a hybrid schedule, in which individuals spend a mix of days at home and at work each week1,2. However, the effects of hybrid working on employees and firms have been debated, and some executives argue that it damages productivity, innovation and career development3-5. Here we ran a six-month randomized control trial investigating the effects of hybrid working from home on 1,612 employees in a Chinese technology company in 2021-2022. We found that hybrid working improved job satisfaction and reduced quit rates by one-third. The reduction in quit rates was significant for non-managers, female employees and those with long commutes. Null equivalence tests showed that hybrid working did not affect performance grades over the next two years of reviews. We found no evidence for a difference in promotions over the next two years overall, or for any major employee subgroup. Finally, null equivalence tests showed that hybrid working had no effect on the lines of code written by computer-engineer employees. We also found that the 395 managers in the experiment revised their surveyed views about the effect of hybrid working on productivity, from a perceived negative effect (-2.6% on average) before the experiment to a perceived positive one (+1.0%) after the experiment. These results indicate that a hybrid schedule with two days a week working from home does not damage performance.


Conflict of interest statement

No funding was received from Trip.com. J.L. is the co-founder, former CEO and current chairman of Trip.com, with equity holdings in Trip.com. No other co-author has any financial relationship with Trip.com. Neither the results nor the paper was pre-screened by anyone. The experiment was registered with the American Economic Association on 16 August 2021 after the experiment had begun but before N.B. and R.H. had received any data. Only anonymous data were shared with the Stanford team.

Figures

Fig. 1
Fig. 1. Trip.com employees worked in modern open-plan offices, with teams seated together.
Pictures of Trip.com employees in the office during the experiment. The people in the experimental sample are typically in their mid-30s, and 65% are male. All of them have a university undergraduate degree and 32% have a postgraduate degree, usually in computer science, accounting or finance, at the master’s or PhD level. They have 6.4 years tenure on average and 48% of employees have children (Extended Data Table 1).
Fig. 2
Fig. 2. WFH cut attrition by 33% overall, and had a particularly strong effect for non-managers, women and those with longer commutes.
Data on 1,612 employees’ attrition until 23 January 2022. Top left, all employees. Only 1,259 employees filled out the baseline survey question on commuting length, so the commute-length (two ways) sample is for 1,259 employees. Sample sizes are 820 and 792 for control and treatment; 1,217 and 395 for non-managers and managers; 570 and 1,042 for women and men; and 648 and 611 for short and long commuters, respectively. Two-tailed t-tests for the attrition difference within each group between the control and treatment groups are (difference = 2.40, s.e. = 1.18, confidence interval (CI) = [0.0748, 4.72], P = 0.043) for all employees; (difference = 3.26, s.e. = 1.46, CI = [0.392, 6.12], P = 0.026) for non-managers; (difference = −0.169, s.e. = 1.73, CI = [−3.57, 3.23], P = 0.922) for managers; (difference = 5.01, s.e. = 2.08, CI = [0.915, 9.10], P = 0.017) for women; (difference = 0.997, s.e. = 1.43, CI = [−1.82, 3.81], P = 0.487) for men; (difference = 2.61, s.e. = 1.93, CI = [−1.19, 6.41], P = 0.178) for employees with median (90 min, two-way) or shorter commutes; and (difference = 3.11, s.e. = 1.66, CI = [−0.156, 6.37], P = 0.062) for above-median (90 min, two-way) commuters.
Fig. 3
Fig. 3. WFH had no significant effect on performance reviews over the next two years.
Results from performance reviews of 1,507 employees in July–December 2021, 1,355 employees in January–June 2022, 1,301 employees in July–December 2022 and 1,254 employees in January–June 2023. Samples are lower over time owing to employee attrition from the original experimental sample. Two-tailed t-tests for the performance difference within each period between the control and treatment groups, after assigning each letter grade a numeric value from 1 (D) to 5 (A), are (difference = 0.056, s.e. = 0.043, CI = [−0.029, 0.14], P = 0.198) for July–December 2021; (difference = 0.034, s.e. = 0.044, CI = [−0.0529, 0.122], P = 0.440) for January–June 2022; (difference = −0.019, s.e. = 0.046, CI = [−0.11, 0.072], P = 0.677) for July to December 2022; and (difference = 0.046, s.e. = 0.051, CI = [−0.054, 0.146], P = 0.369) for January–June 2023. The null equivalence tests are included in the ‘Null results’ section of the Methods.
Fig. 4
Fig. 4. WFH had no significant effect on promotions over the next two years.
Promotion outcomes for 1,522 employees in July–December 2021, 1,378 employees in January–June 2022, 1,314 employees in July–December 2022 and 1,283 employees in January–June 2023. Samples are lower over time owing to employee attrition from the original experimental sample. Two-tailed t-tests for the promotion difference within each period between the control and treatment groups are (difference = −0.86, s.e. = 1.34, CI = [−3.51, 1.74], P = 0.509) for July–December 2021 promotions; (difference = 0.12, s.e. = 0.85, CI = [−1.54, 1.78], P = 0.892) for January–June 2022 promotions; (difference = −0.51, s.e. = 1.12, CI = [−2.72, 1.70], P = 0.651) for July–December 2022 promotions; and (difference = −0.99, s.e. = 1.02, CI = [−2.99, 1.00], P = 0.328) for January–June 2023 promotions. The null equivalence tests are included in the ‘Null results’ section of the Methods.
Fig. 5
Fig. 5. Views on the effect of WFH on productivity improved after the experiment, particularly for managers.
Sample from 1,315 employees (314 managers, 1,001 non-managers) at the baseline and 1,345 employees (324 managers, 1,021 non-managers) at the end line. Two-tailed t-tests for the difference in productivity expectations between baseline and end line, after assigning a numeric value corresponding to the midpoint of the bucket, are (baseline mean = −0.058, end-line mean = 1.48, difference = −1.54, s.e. = 0.40, CI = [−2.33, −0.753], P < 0.001). Two-tailed t-tests for the baseline difference between the productivity expectations of managers and non-managers are (difference = −3.28, s.e. = 0.72, CI = [−4.69, −1.86], P < 0.001), and the t-tests for the end-line difference are (difference = −0.571, s.e. = 0.604, CI = [−1.76, 0.615], P = 0.345).
Extended Data Fig. 1
Extended Data Fig. 1. WFH had no effect on lines of code written.
The data coves the experimental period starting on 9 August 2021 for the first wave and 13 September for the second wave, running to 23 January 2022, for both waves. Lines of code submitted per day is available for 653 employees whose primary role was writing code, spanning a total of 95,494 days. Lines are those uploaded to trip.com on a daily basis. Data plotted on a log-2 scale for readability. Reported P value is calculated using a two-sided t-test on the number of code lines and the difference is for control minus treatment. When using log2(code lines) the difference has a P value of 0.750 (noting the sample is 27,605 days because of dropping 0 values). When using log2(1 + code lines) the difference has a P value of 0.0103, with treatment having the higher average values. The null equivalence tests are included in the ‘Null results’ section of the Methods.
Extended Data Fig. 2
Extended Data Fig. 2. Home (October 2021).
Employees set up basic working environments in their living rooms, studies, or kitchens, and bring back company laptops if necessary.
Extended Data Fig. 3
Extended Data Fig. 3. Take-up rate for WFH treatment and control by volunteer status.
Data for 1,612 employees from 9 August 2021 (volunteers) and 13 September (non-volunteers) to 23 January 2022. Public holidays, personal holidays and excused absence (for example, sick leave) are excluded. Take-up rate is percentage of Wednesday and Friday each week they WFH.
Extended Data Fig. 4
Extended Data Fig. 4. Trip.com revenues.
Trip.com revenues from 2000 to 2023.

References

    1. Working From Home Research: Survey of Workplace Attitudes and Arrangements; https://wfhresearch.com/ (2023).
    1. Aksoy, C. G. et al. Working from Home Around the Globe: 2023 Report. EconPol Policy Brief No. 53 (EconPol, 2023).
    1. McGlauflin, P. JPMorgan CEO Jamie Dimon chides managers who work from home: ‘I don’t know how you can be a leader and not be completely accessible to your people’. Fortune (11 July 2023).
    1. Kelly, J. Goldman Sachs tells employees to return to the office by July 14, as Wall Street pushes back on the work-from-home trend. Forbes (5 May 2021).
    1. Goswami, R. Elon Musk: Working from home is ‘morally wrong’ when service workers still have to show up. CNBC (16 May 2023).

Publication types