. 2024 Jun;630(8017):744-751.
doi: 10.1038/s41586-024-07490-1. Epub 2024 Jun 12.

Strand-resolved mutagenicity of DNA damage and repair

Collaborators, Affiliations

Strand-resolved mutagenicity of DNA damage and repair

Craig J Anderson et al. Nature. 2024 Jun.

Abstract

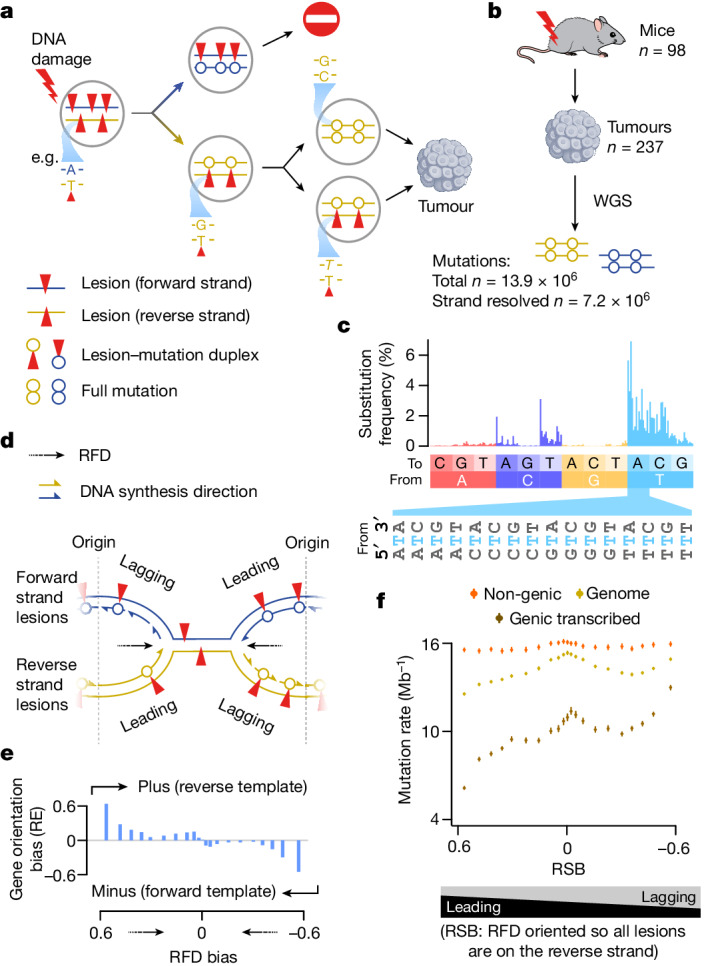
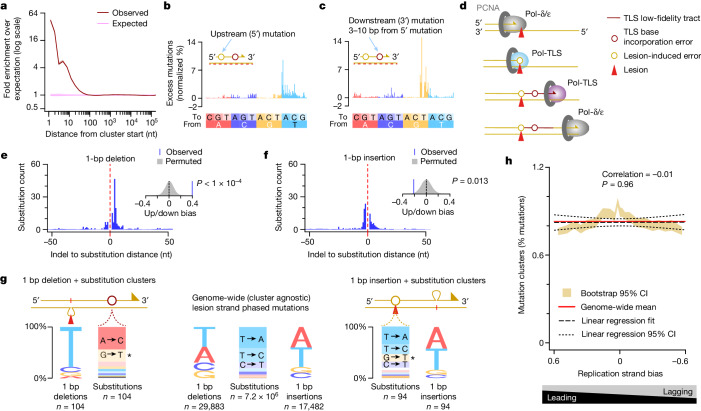
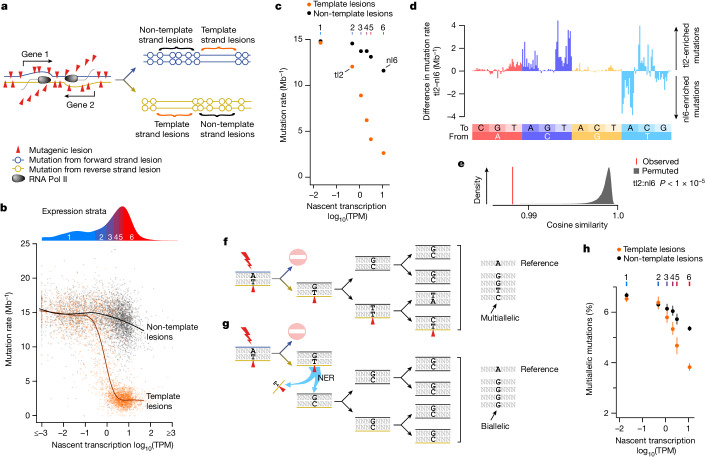
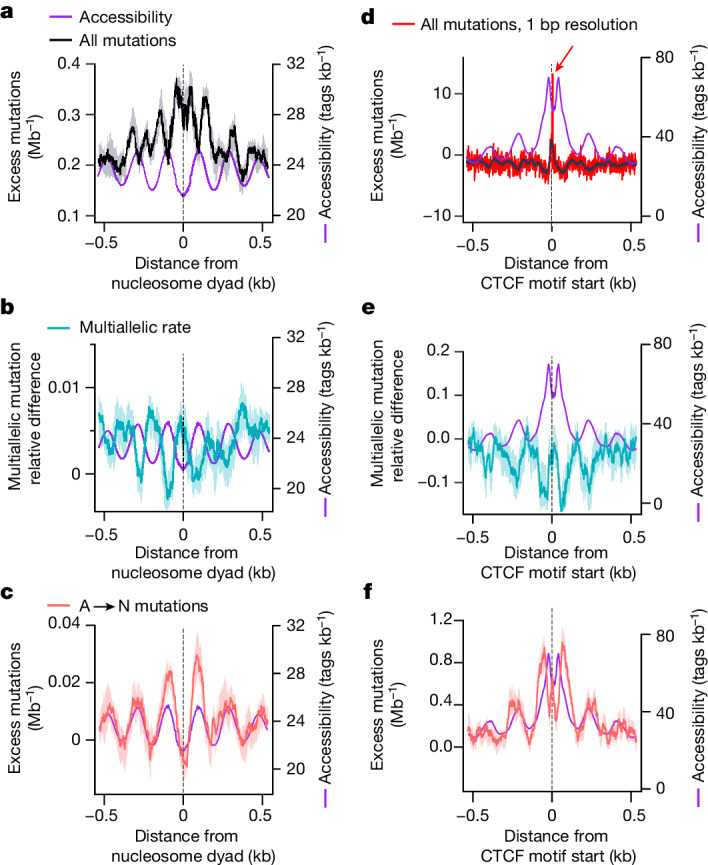
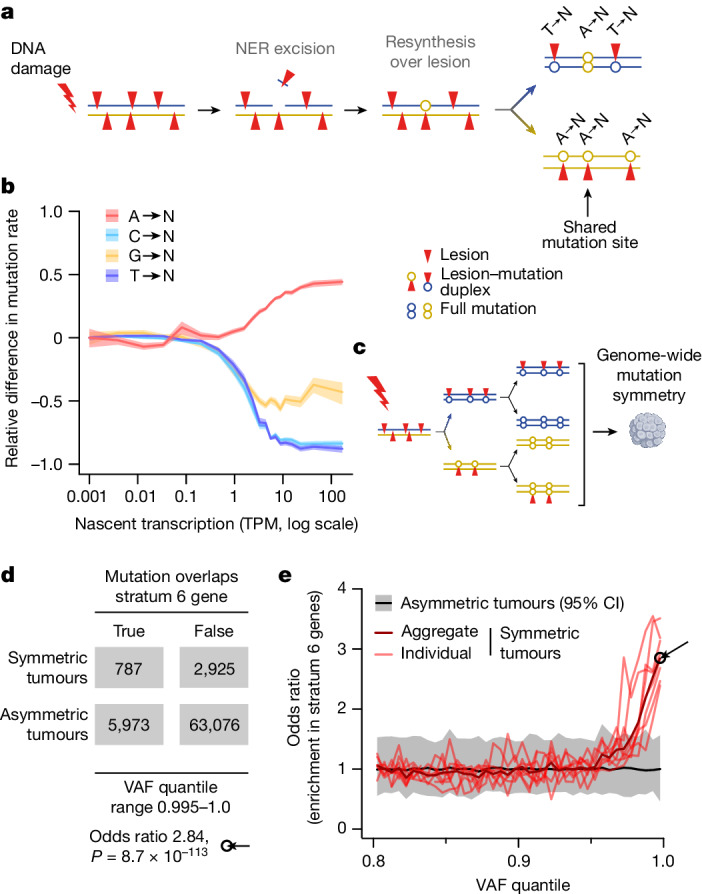
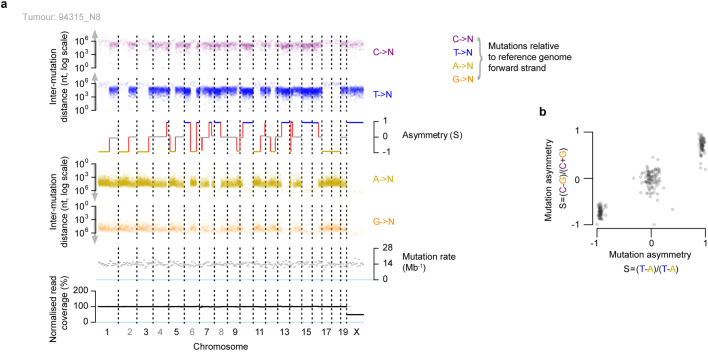
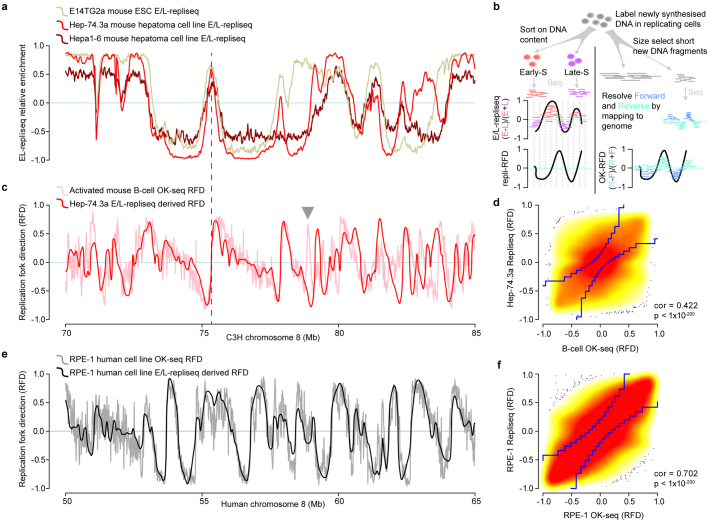
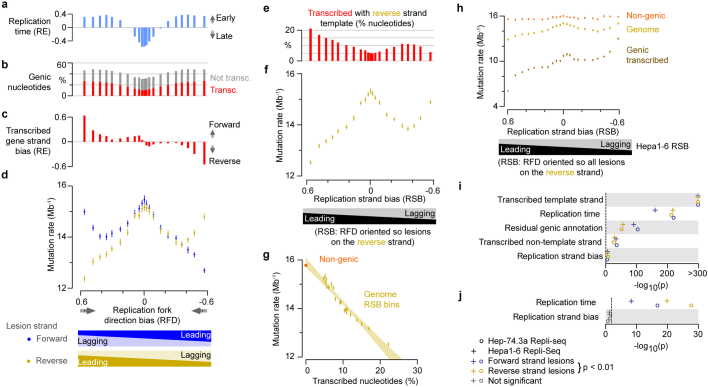
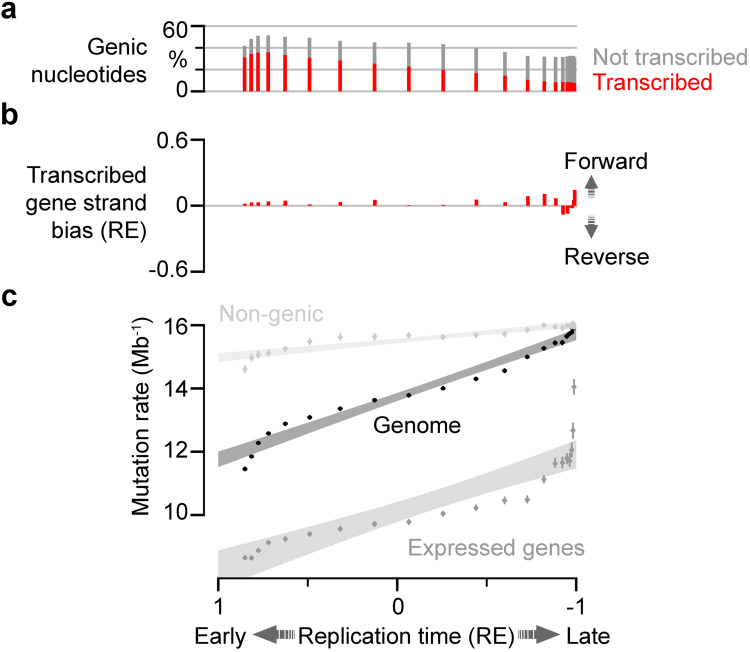
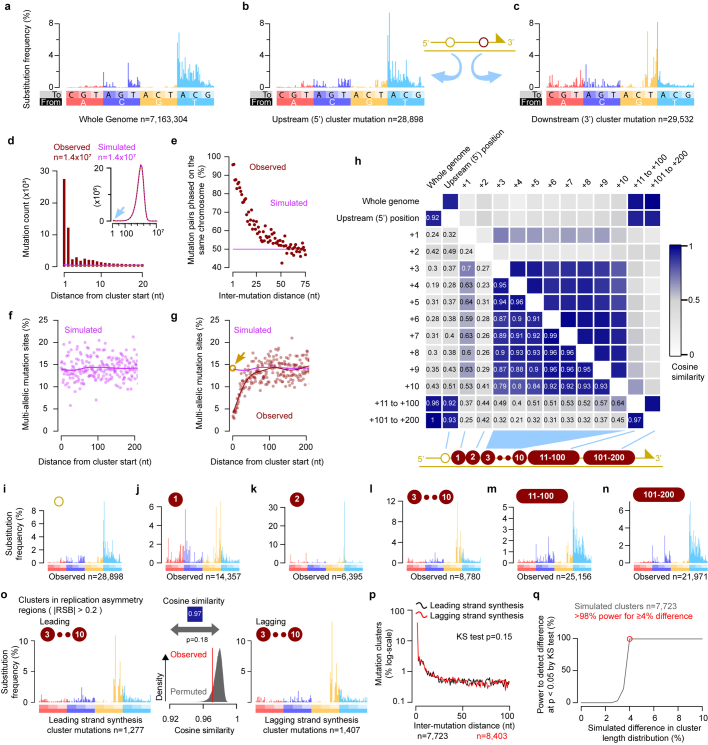
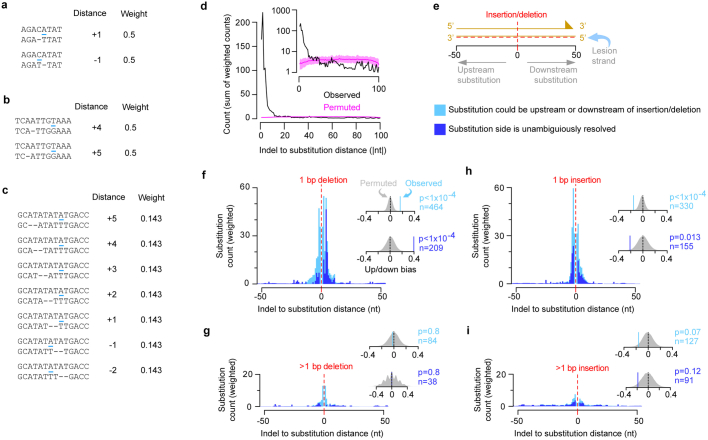
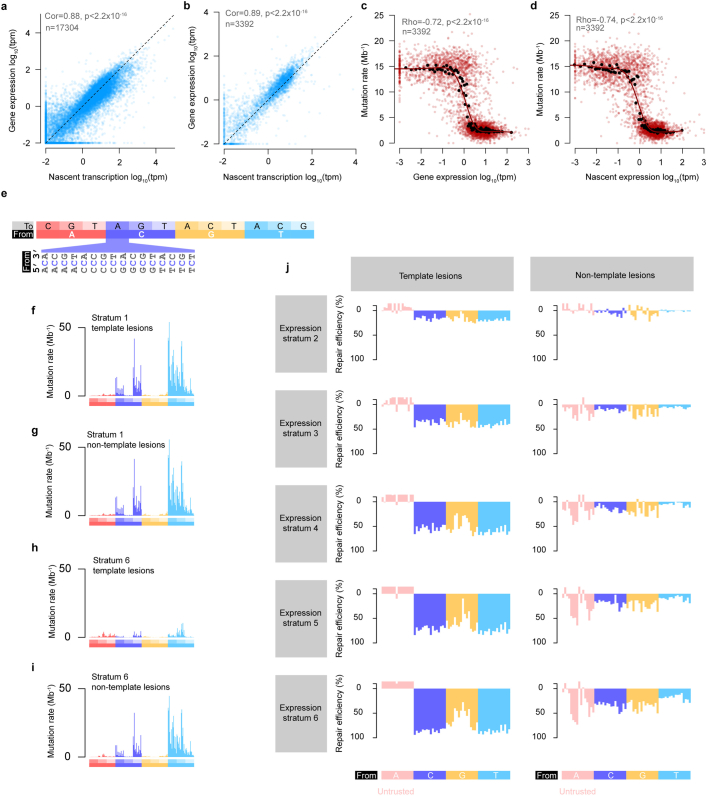
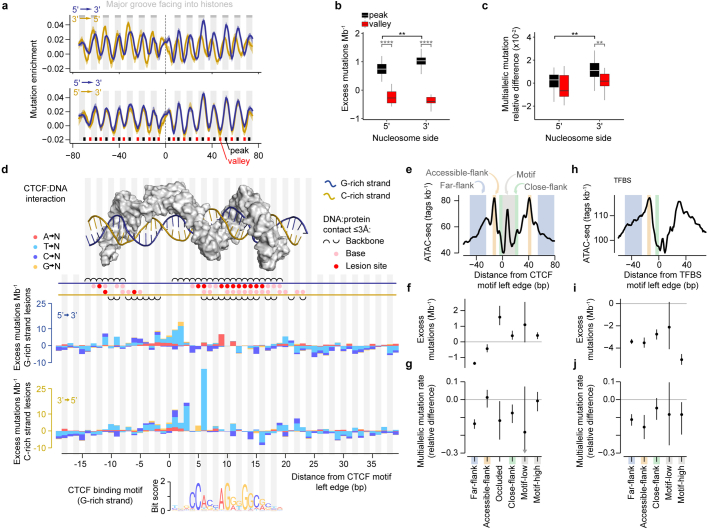
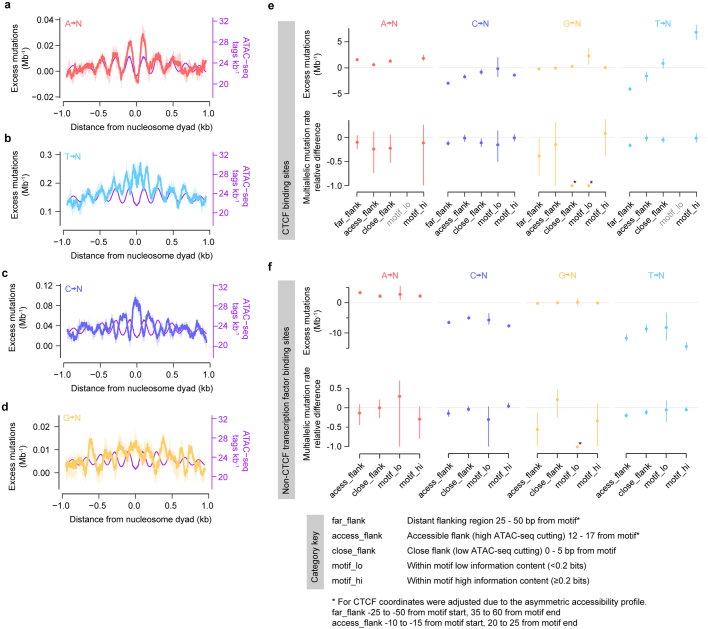
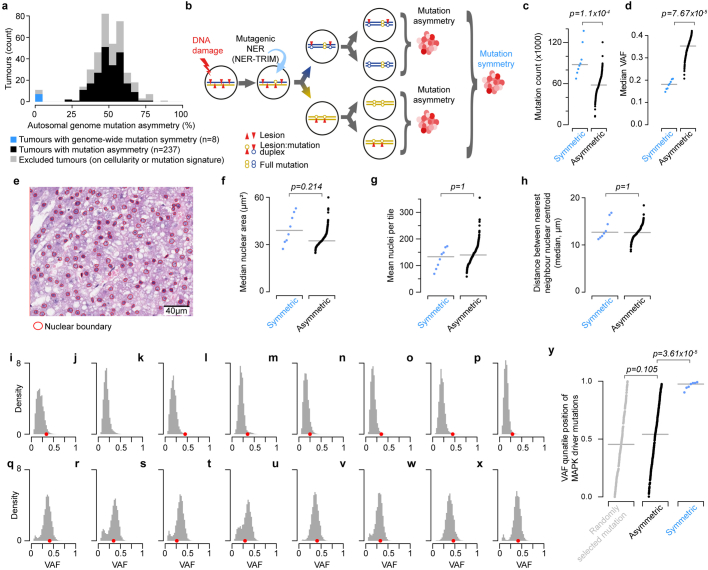
DNA base damage is a major source of oncogenic mutations1. Such damage can produce strand-phased mutation patterns and multiallelic variation through the process of lesion segregation2. Here we exploited these properties to reveal how strand-asymmetric processes, such as replication and transcription, shape DNA damage and repair. Despite distinct mechanisms of leading and lagging strand replication3,4, we observe identical fidelity and damage tolerance for both strands. For small alkylation adducts of DNA, our results support a model in which the same translesion polymerase is recruited on-the-fly to both replication strands, starkly contrasting the strand asymmetric tolerance of bulky UV-induced adducts5. The accumulation of multiple distinct mutations at the site of persistent lesions provides the means to quantify the relative efficiency of repair processes genome wide and at single-base resolution. At multiple scales, we show DNA damage-induced mutations are largely shaped by the influence of DNA accessibility on repair efficiency, rather than gradients of DNA damage. Finally, we reveal specific genomic conditions that can actively drive oncogenic mutagenesis by corrupting the fidelity of nucleotide excision repair. These results provide insight into how strand-asymmetric mechanisms underlie the formation, tolerance and repair of DNA damage, thereby shaping cancer genome evolution.


Conflict of interest statement

The authors declare no competing interests.

Figures

Fig. 1
Fig. 1. Apparent replication-associated mutational asymmetry can be explained by transcription coupled repair.
a, Schematic of DNA lesion segregation. Mutagen exposure induces lesions (red triangles) on both DNA strands (forward in blue; reverse in gold). Lesions that persist until replication serve as a reduced fidelity template. The two sister chromatids segregate into distinct daughter cells, so new mutations are not shared between daughter cells of the first division. Lesions that persist for multiple cell generations can generate multiallelic variation through repeated replication over the lesion (in italic). b, Summary of tumour generation and mutations called from whole-genome sequencing (WGS; Methods). c, Lesion strand resolved mutation spectra of all tumours (n = 237), representing the relative frequency of strand-specific single-base substitutions and their sequence context (192 categories). d, During the first DNA replication after DNA damage, template lesions (red triangles) are encountered by both the extending leading and the lagging strands. e, The relative enrichment (RE) of liver-expressed genes in the plus versus minus orientation (RE = (plus − minus)/(plus + minus)) across 21 quantile bins of replication fork directionality (RFD) bias (x axis). f, Mutation rates (y axis) for the whole genome (gold) stratified into 21 quantile bins of replication strand bias (RSB; x axis) show a higher mutation rate for the lagging strand than the leading strand replication on a lesion-containing template. This effect is enhanced in expressed genes (tan) and negligible in non-genic regions (orange). Whiskers show 95% bootstrap confidence intervals.
Fig. 2
Fig. 2. Translesion synthesis drives collateral mutagenesis on both the leading and the lagging strands.
a, Closely spaced mutations (brown) occur more frequently than expected based on permutation of mutations between tumours (pink; bootstrap 95% CI is shaded, too small to visualize). b, Residual mutation signature (after subtracting expected mutations) for cluster upstream mutations. Cluster orientation by the lesion-containing strand (red dashed line; Methods). c, Residual signature of downstream cluster mutations, plotted as per b. d, Schematic illustrating mutagenic translesion synthesis (TLS) (yellow circle) and collateral mutagenesis (brown circle). e, Substitutions are highly clustered downstream of 1 bp deletions. The inset shows the density plot for 10,000 random permutations of lesion strand assignment (grey) compared with the observed level of upstream/downstream bias. Only clusters where the substitution could be definitively assigned to an upstream or downstream location were considered. Two-sided P values were empirically derived from the permutations. nt, nucleotide. f, Single-base insertions are also clustered with substitutions, but biased to upstream of the insertion; plotted as per e. g, One-base pair deletions with a downstream substitution within 10 bp (left panel) show significant bias towards deletion of T (rather than A) from the lesion-containing strand compared with the rate genome wide (centre panel, two-sided Fisher’s exact test odds = 16.5, P = 1.04 × 10−16). Downstream substitutions are also highly distorted from the genome-wide profile (two-sided Chi-squared test P = 8.5 × 10−46). By contrast, insertion mutations and their proximal substitutions resemble the genome-wide profiles, with the notable additional contribution from the G→T substitutions (*) that also associate with both substitution and 1 bp deletion clusters. h, The rate of mutation clusters is not correlated with replication strand bias; consistently, approximately 0.8% of substitution mutations are found in clusters spanning 10 nt or fewer, indicating a similar rate of TLS for both the leading and the lagging strands.
Fig. 3
Fig. 3. Multiallelic variation demonstrates transcription-associated repair of the non-template DNA strand.
a, DNA lesions (red triangles) on the transcription template strand can cause RNA polymerase to stall and trigger transcription-coupled NER. Cells that inherit the template strand of active genes have a depletion of mutations through the gene body. b, Mutation rate (y axis) for individual genes relative to their nascent transcription rate (x axis) estimated from intronic reads. Mutation rates for each gene (n = 3,392) are calculated separately for template (orange) and non-template (black) strand lesions. The curves show best-fit splines. Genes are grouped into six expression strata (used in subsequent analyses), indicated by the density distribution (top). TPM, transcripts per million. c, Mutation rates for genes grouped into expression strata (1–6; top axis), calculated separately for template strand lesions (orange) and non-template strand lesions (black). Whiskers indicate 95% bootstrap confidence intervals (too small to resolve). Labels indicate data used in subsequent mutation spectra panels (d,e). d, Despite similar mutation rates, the mutation spectrum differs between non-template lesion stratum 6 (nl6) and template lesion stratum 2 (tl2). e, Permutation testing confirms that the mutation spectra differs between the transcription template and the non-template strand, even when overall mutation rates are similar. Comparison of tl2 and nl6 mutation spectra (red) and after gene-level permutation of categories. n = 105 permutations (grey). f, Lesions (red triangles) that persist for multiple cell generations can generate multiallelic variation through repeated replication over the lesion. g, Lesions rapidly removed by NER persist for fewer cell cycles, generating less multiallelic variation. h, The multiallelic rate (y axis) for template strand lesions (orange) is reduced with increasing transcription (x axis). The same is apparent for non-template lesions (black), indicating that enhanced repair of non-template lesions is also associated with greater transcription. Whiskers show bootstrap 95% confidence intervals.
Fig. 4
Fig. 4. Rapid repair of accessible DNA shapes the mutational landscape, but CTCF binding causes extreme local distortions.
a, Nucleosome occupancy shapes the mutational landscape,, with higher mutation rates (21 bp sliding window) over the nucleosomes (for example, x = 0), and lower rates in more-accessible linker regions (accessibility measured by ATAC-seq from P15 mouse liver, in purple with scale on the right axis and larger values corresponding to greater accessibility). Mutation and multiallelic rates are shown with shaded 95% bootstrap confidence intervals (also in subsequent panels). b, High rates of multiallelic variation are found at sites of low accessibility and high mutation rate, indicating that high rates of mutation represent slow repair. c, The rate of A→N mutations is the inverse of the overall mutation profile, with high rates of A→N corresponding to accessible regions and rapid repair. d, Mutation rates are dramatically elevated at CTCF-binding sites (21 bp sliding window, in black; single-base resolution, in red). e, High accessibility at CTCF sites again corresponds to low multiallelic variation and low mutation rates (d), with the exception of the mutation hotspot (red arrow), which does not show a corresponding increase in multiallelism, indicating that higher rates of damage cause these hotspots. f, Mutations of A→N closely track DNA accessibility.
Fig. 5
Fig. 5. Nucleotide excision repair is mutagenic when lesions on opposing strands are in close proximity.
a, Mechanism of NER translesion resynthesis-induced mutagenesis (NER-TRIM). Lesion-containing single-stranded DNA is excised and consequently a residual lesion in close proximity on the opposite strand would be used as a low-fidelity template for repair synthesis. This creates isolated mutations with opposite strand asymmetry to the genomic locality (for example, A→N within a T→N segment). Most lesion-induced mutations are not shared between daughter lineages, whereas those from NER-TRIM can be shared (black arrow). b, The rate of A→N mutations on the genic template strand increases with gene expression, mirroring the decrease in mutations from other bases due to TCR. The relative difference (y axis) in mutation rate for each nucleotide is (obs − exp)/(obs + exp); exp is the mutation rate for that nucleotide in non-expressed genes, and obs is the rate observed in the body of genes with the indicated expression level (x axis). Rates shown for lesions on the transcription template strand, with 95% confidence interval (shaded areas) from 100 bootstrap samples of genes. c, Schematic illustrating the generation of a mutationally symmetric tumour through the survival of both post-mutagenesis daughter genomes. NER-TRIM mutations in symmetric tumours will be characterized by abnormally high VAF as they will be shared by both contributing genomes (Extended Data Fig. 10b). d, Contingency table illustrating the enrichment of mutations with high VAF (0.995–1.0 quantile) in highly expressed genes of mutationally symmetric tumours (n = 8) compared with asymmetric tumours (n = 237). Statistical significance by two-tailed Fisher’s exact test. e, Symmetric tumours are highly enriched for high VAF mutations in highly expressed genes. Odds ratios (y axis) are as in d, for VAF quantile bins of 0.005 (x axis). The black arrow shows the odds ratio calculated in d.
Extended Data Fig. 1
Extended Data Fig. 1. Exemplar tumour genome demonstrating mutation asymmetry from lesion segregation.
a, Mutational summary of one DEN induced tumour; the tumour genome represented by the shared x-axis and chromosome boundaries marked with dashed vertical lines. Mutations are called relative to the forward strand of the reference genome and shown as coloured points stratified type (C → N, T → N, A → N, G → N). Y-axis positions show the genomic distance to the next mutation of the same type and plotted on a log10 scale. Mutations of type T → N and A → N are complements of each other and plotted on opposite sides of the asymmetry segmentation track with inverted y-axis orientations (y-axis arrows). The same for C → N versus G → N mutations. Genomic segmentation by T → N/A → N mutation asymmetry is plotted showing genomic segments where mutations have arisen from forward strand lesions (blue), reverse strand lesions (gold), or where one chromosome has forward and the other reverse strand lesions meaning that they cancel each other out (grey). Hemizygous X chromosomes are always mutationally asymmetric. The asymmetry score is calculated as S = (forward-reverse)/(forward+reverse) where forward and reverse are the sequence composition adjusted rates of T → N and A → N mutations. Both average total mutation rate and read coverage are typically uniform across the autosomal portion of the tumour genomes. b, The mutational asymmetry calculated from T → N/A → N mutations (x-axis) and C → N/G → N mutations (y-axis) in 5 Mb windows over the genome is closely correlated, consistent with the interpretation that most mutagenic adducts in these tumours are on T and C nucleotides and supported by reduced mutation rates when T and C are on the transcriptional template strand (Extended Data Fig. 7).
Extended Data Fig. 2
Extended Data Fig. 2. Quantifying replication fork directionality.
a, Replication time profile of an example 15 Mb of C3H genome chromosome 8 (x-axis, shared with panel c). Curves show early/late (EL) replication relative enrichment (E and L read counts normalised to their respective library read depth, then relative enrichment, RE = (E − L)/(E + L)) where more positive values indicate earlier replication and more negative values indicate later replication. Replication profiles shown for a mouse embryonic stem cell line (E14TG2a, tan) and mouse hepatocyte derived cell lines (Hep-74.3a, red; Hepa1-6, brown). Blue dash line indicates the centre of a strong replication origin region (schematic) and is projected into panel c for comparison. b, Schematic illustrating two alternate strategies to generate replication fork directionality measures (RFD). Left side, E/L-Repli-seq (top) can be used to derive Repli-seq based replication fork RFD (repli-RFD; bottom). On the right side, Okazaki fragment sequencing based RFD (OK-RFD). c, Smoothed derivatives of Hep-74.3a E/L-Repli-seq data (red, panel a) provides an RFD estimate. Comparison to OK-seq data from another differentiated cell type (pink, activated B-cells) shows overall good concordance but captures some replication profile differences between cells (grey triangle). d, Kernel density plot summarising the genome-wide correlation of B-cell derived OK-RFD (x-axis) and Hep-74.3a derived repli-RFD (y-axis), both at 10 kb resolution. Only high-concordance genomic intervals between blue stepped lines (21 quantile boundaries) were used for RFD based measures of liver tumour mutation rate. e, Validation of the E/L-Repli-seq to RFD measure in human RPE-1 cells where both OK-seq (grey) and E/L-Repli-seq (black) has been generated and used to calculate RFD. The curves are shown over a 15 Mb interval of human chromosome 8 and illustrate a high concordance of RFD profile. Although both traces are plotted at 10 kb resolution, the smoothing and processing required to calculate RFD from E/L-Repli-seq averages out some of the fine grained structure evident in the OK-seq derived profile. f, Kernel density plot summarising the OK-seq (x-axis) and E/L-Repli-seq (y-axis) RFD estimates for RPE-1 cells, as for panel d.
Extended Data Fig. 3
Extended Data Fig. 3. Transcription and replication time influence DNA damage induced mutation rate but replication strand bias has negligible impact.
a, Relative enrichment (RE) of early versus late replication time for 21 quantile bins of replication fork direction bias (RFD, x-axis shared with b-d). Relative enrichment calculated as RE = (early−late)/(early+late) using the number of nucleotides annotated as early or late replicating in each of the RFD bins. b, Percent of genic nucleotides in each quantile bin, stratified as transcribed (red, >1 transcript per million (TPM) in P15 mouse liver) or non-transcribed (grey). c, Relative enrichment of strand-biassed transcription across RFD bins (RE = (forward-reverse)/(forward+reverse)) calculated using the number of nucleotides contained within the transcription strand resolved genomic span of expressed genes (panel b). d, Mutation rate (nucleotide composition normalised) for RFD bins calculated separately for forward strand and reverse strand lesions, 95% C.I. (whiskers) from bootstrap sampling. e, Percentage of nucleotides that are transcribed (>1 TPM, P15 mouse liver) in each of the 21 quantile bins of replication strand bias (RSB, x-axis shared with f). RSB is the RFD metric but all data oriented so that lesions would be on the reverse strand. f, Mutation rates for the 21 RSB bins. g, Mutation rates (y-axis) points and RSB bins identical to panel f, but x-axis shows the percent of nucleotides with transcription over a lesion strand template, illustrating that transcription using a lesion containing strand is the main determinant of mutation rate. Linear modelling (shaded area 95% C.I.) and extrapolation of this correlation accurately predicts the observed mutation rate in non-genic regions (orange point). h, Mutation rates (y-axis) for the whole genome (gold) stratified into 21 quantile bins of RSB (x-axis). Equivalent analysis is shown for fractions of the genome contained within expressed genes (tan) and non-genic regions (orange). This is a repeat of the analysis shown in Fig. 1f confirming the results using Repli-seq data from a second independent hepatocyte cell line (Hepa1-6 (h), rather than Hep-74.3a (Fig. 1f) that is used except where otherwise stated). i, Multivariate regression modelling based on 10 kb consecutive genomic windows finds all five tested parameters make nominally significant (right of the dashed line), independent contributions to variation in mutation rate (calculated separately for forward strand and reverse strand lesions, blue and gold, respectively). The predominant contributions are transcription over a lesion containing template strand and to a lesser extent replication time. Residual genomic annotation (annotated genes not meeting the >1 TPM threshold for expression) is notably significant, indicating sub-threshold expression contributes to reducing the mutation rate. The results are highly reproducible, independently using either Hep-74.3a and Hepa1-6 Repli-seq measures (circles and crosses, respectively). j, Multi-regression analysis considering only 10 kb segments that are >5 kb from annotated genes, demonstrates significant replication time influences on mutation rate but that replication strand bias does not significantly influence the mutation rate. Forward strand lesions (blue) and reverse strand lesions (gold) calculated separately.
Extended Data Fig. 4
Extended Data Fig. 4. Replication time correlates with mutation rate partly independent of transcription.
a-c, The genome was partitioned into 21 quantile bins of replication time, relative enrichment (shared x-axis, RE = (early−late)/(early+late)) a, Percent of genic nucleotides in each quantile bin, stratified as transcribed (red, >1 transcript per million (TPM) in P15 mouse liver) or non-transcribed (grey). b, Relative enrichment of strand-biassed transcription across replication time bins (RE = (forward−reverse)/(forward+reverse)) calculated using the number of nucleotides contained within the transcription strand resolved genomic span of expressed genes (panel a). c, Mutation rates (y-axis) for the whole genome (black, 95% C.I. whiskers). A linear regression 95% C.I. shown as a corresponding shaded area. Equivalent analysis is also shown, restricted to only expressed genes (mid-grey) and non-genic regions (light-grey).
Extended Data Fig. 5
Extended Data Fig. 5. Tracts of low-fidelity replication downstream of lesion induced mutations.
a, Genome-wide mutation signature of DEN induced tumours. b, Signature of mutation cluster upstream (5′) position mutations, oriented so the lesion containing strand is the replication template. c, Signature of downstream mutations in the cluster (2.2% of clusters have two downstream mutations). d, Frequency distribution of the spacing between adjacent observed (dark-red) and simulated (pink) mutations for all tumours (n = 237). The simulated data were generated by sampling mutations across all other tumours to create proxy tumour datasets with identical mutation counts (see Methods). Main histogram shows only closest spaced mutations, inset graph shows full distribution of both observed and simulated, blue arrow indicates x-axis area expanded in main histogram. Excess clustering of observed mutations (blue arrow) accounts for only 0.8% of the total mutation burden. e, Clustered mutation pairs co-occur in the same sequencing read, confirming they are on the same DNA duplex. Expected (pink) is analogous to two heads or two tails from consecutive flips of a fair coin. f, Multiallelism is a hallmark of lesion templated mutations. The multiallelic rate (y-axis, fraction of mutation sites with multiallelic variation) for simulated data (pink spots). Curve shows best-fit spline (25 degrees of freedom) for the downstream mutations. g, As for (f) but showing observed data (red), demonstrating a pronounced and specific depletion of multiallelic variation immediately downstream of the cluster 5′ mutation (yellow circle and arrow). h, Heatmap summarising cosine similarity between mutation clusters with different inter-mutation spacing (schematic in lower panel). Upstream (5′) cluster mutations closely match the genome wide mutation spectrum. Mutations 3 to 10 nt downstream of the 5′ mutation share a common signature. i-n, Mutation signature profiles for clustered mutations; distance from the upstream mutation (number in brown circle) relate to schematic in h. Mutation counts in each category indicated below the plot. o, The mutation spectrum of downstream mutations closely matches between leading and lagging strand replication (strongly RSB regions, absolute RSB > 0.2). The observed cosine similarity between mutation spectra is robustly within the range expected by random permutation of mutations between leading and lagging strands (n = 105 permutations, two tailed empirical p = 0.18). p, The distribution of mutation cluster length also matches between leading (black) and lagging (red) strands (no significant difference; two sided Kolmogorov-Smirnov test p = 0.15). q, Simulations show >98% power to detect a ≥ 4% difference in the distribution of cluster lengths for strongly RSB regions of the genome.
Extended Data Fig. 6
Extended Data Fig. 6. DNA damage induces deletion mutations at damaged bases and collateral insertion mutagenesis.
a, A deletion or insertion mutation with a proximal substitution can often be explained by multiple equally scoring alignments. Two example sequences can be aligned with a single gap (dash) and substitution (blue line), in this case with two possible solutions. To avoid systematic biases in gap placement by alignment and mutation calling software, all equally optimal alignments are calculated, the distance between gap and substitution measured for each and count value distributed equally between possible solutions (weight). b, As (a) but gap and substitution position are not immediately adjacent. c, As (a) but demonstrating an example with seven equally scoring solutions where the substitution could be assigned to either upstream or downstream of the insertion/deletion. d, Frequency distribution of the distance between insertion or deletion (indel) mutations and their closest proximal substitution mutation (black curve), demonstrating a high degree of spatial clustering within 10 bp. The permuted expectation (pink) was calculated by measuring the distance to the nearest substitution in a permuted set of substitutions sampled from other tumours (Methods). Confidence intervals (95%, light pink) on the permuted set were calculated from 100 permuted sets of substitutions. Inset graph shows the same data plotted with the y-axis on a log10 scale. Counts for both observed and permuted are the sums of the weighted counts for each distance as illustrated in (a-c). e, Schematic to show how indel and substitution mutation clusters are oriented by the lesion containing strand in subsequent plots, and that the position of the insertion or deletion is set as x = 0. The subsequent plots (f-i) also show cases where all optimal alignments agree on the upstream/downstream placement of the substitution relative to the indel (dark blue, e.g. panel b) as distinct from where that assignment is ambiguous (light blue, e.g. panel c). f, Substitutions are strongly clustered around 1 bp deletions and biassed towards a downstream location. Inset shows the density plot for 10,000 permutations of the observed data where the assignment of the lesion strand was randomly permuted (grey) compared with the observed level of upstream/downstream bias (calculated as bias = (down−up)/(down+up)). Two-sided p-values were empirically derived from the permutations. g, Deletions >1 bp are rarely clustered with substitutions and do not show a significant upstream/downstream bias. h, Single base insertions are clustered with substitutions and are significantly biassed to upstream of the insertion. i, Longer insertions show similar clustering trends to 1 bp insertions but do not reach statistical significance.
Extended Data Fig. 7
Extended Data Fig. 7. Transcription and lesion repair have strand-specific, expression-dependent mutation signatures.
a, Mature transcript expression and nascent transcription (intron mapping RNA-seq reads) are highly correlated; one point per gene. b, As for panel a but restricted to the genes spanning in aggregate across tumours >2 million nucleotides of strand resolved tumour genome (n = 3,392). c, Mature transcript gene expression (x-axis) negatively correlates with composition normalised mutation rate (y-axis) where lesions are on the transcription template strand (one red point per gene). Red curve shows the best-fit spline (8 degrees of freedom) through the red points. Black points show gene expression measures for centile bins of gene expression. d, As for c, but x-axis shows nascent RNA estimates of transcription. P-values for panels a-d are too small to precisely calculate (p < 2.2 × 10⁻¹⁶). e, Nucleotide order used for 192 category mutation spectra in panels f-i. Expanded segment shows the flanking nucleotide context for C → A mutations; the same ordering of flanking nucleotides is used for all mutation types. f-i, Mutation rate spectra for non-expressed (stratum 1) genes are closely matched for template (f) and non-template (g) lesion strands. For highly expressed genes (stratum 6), the mutation rate is reduced for both strands and the spectrum differs between template strand (h) and non-template strand (i) lesions. j, The profile of lesion repair efficiency differs between template strand lesions and non-template strand lesions of expressed genes. Repair efficiency is calculated as the percent change in mutation rate for a trinucleotide sequence context (n = 64 categories) relative to the average for both strands in non-expressed genes (stratum 1). The y-axis is inverted to indicate reduction in mutation rate from increased repair. Transcription coupled repair shows similar efficiency for C and T lesions on the template strand. Transcription associated repair on the non-template strand shows preferential repair of C lesions compared to T lesions. Mutations from apparent A lesions (and to a lesser extent G lesions) are rare and, as shown in subsequent sections, should not be evaluated as lesions on the indicated nucleotide, but are included here for completeness (y-axis values < -10 truncated).
Extended Data Fig. 8
Extended Data Fig. 8. Mutation enrichment and depletion at transcription factor binding sites (TFBS).
a, The compositionally corrected mutation rate shows helical (10 bp) periodicity over nucleosomes. Separating the mutation rates by the lesion containing strand (blue, forward; gold, reverse) reveals two partially offset periodic profiles (top panel). Orientating both strands 5′ → 3′ demonstrates that the profiles are mirror images (bottom panel). Mutation rate peaks (black) correspond to regions where the DNA major groove faces into the histones, and valleys (red) where the major groove faces outward. Mutation enrichment is shown with shaded 95% bootstrap confidence intervals (blue, gold). b, For the lesion containing strand, mutation rates are significantly higher for the peaks on the 3′ side of the nucleosome dyad than on the 5′ side (significant p-values shown, two tailed Wilcoxon tests). c, Comparing the compositionally corrected multiallelic rates shows significantly increased multiallelic variation for the 3′ peaks (significant p-values shown, two tailed Wilcoxon test), indicating the increased mutation rate results from slower repair on the 3′ side of the dyad. d, The molecular structure of the CTCF:DNA interface (top) reflects the strand specific mutation profiles of CTCF binding sites (histograms, composition corrected). A composite crystal structure of CTCF zinc fingers 2-11 (grey surface) is shown binding DNA (blue & gold strands) and close protein:DNA contacts (≤3 Å) illustrated below the structure. At nucleotide positions with close contact between CTCF and atoms thought to acquire mutagenic lesions (red circles), the corresponding strand specific mutation rates are generally lower than genome-wide expectation (y ≤ 0; excepting apparent A → N mutations considered later). Mutation rates are high (y > 0) for nucleotide positions with backbone-only contacts or no close contacts but still occluded by CTCF. CTCF motif position 6 exhibits an exceptionally high T → N mutation rate that cannot be readily reconciled with the structure, but the strand specificity demonstrates it is a consequence of DEN exposure. e, The profile of DNA accessibility around CTCF binding sites, defines categories of sequence (shaded areas) considered subsequently. f, Mutation rates are higher than genome-wide expectation (y = 0) for CTCF binding motif nucleotides and their close flanks. g, This is not reflected in increased rates of multiallelic variation. CTCF occluded positions (positions -5 to 3 of the CTCF motif) show the greatest elevation of mutation rate but evidence of decreased multiallelic variation. Both high information content (motif-high, bit score>0.2) and low information content (motif-low, bit-score ≤0.2) motif positions have high mutation rates. h, DNA accessibility around non-CTCF transcription factor binding sites (TFBS) as in e. i,j, In contrast to the situation for CTCF, all TFBS categories of sites have suppressed mutation rate compared to genome-wide expectation, y = 0 (i), and suppression of multiallelic variation (j) indicates enhanced repair. However, high information content motif sites (motif-high) have exceptionally reduced mutation rate not similarly reflected by multiallelic variation, suggesting there may be reduced damage in addition to efficient repair at these sites.
Extended Data Fig. 9
Extended Data Fig. 9. Lesion induced mutation patterns at DNA:protein interaction sites.
a, Excess mutations resulting from A lesions in accessible DNA (relative to the genome-wide trinucleotide mutation rate) centred on the nucleosome dyad. DNA accessibility as measured by ATAC-seq (purple; higher values mean more accessible chromatin). Excess mutations are shown with shaded 95% bootstrap confidence intervals. b-d, Relative mutation rates as a, for apparent T lesions (b), C lesions (c), and G lesions (d); in each case, except A → N mutations, the mutation rate is lower in accessible DNA and higher in less-accessible DNA. e, Mutation rates and multiallelic rates for sequence categories (Methods) within, and adjacent to, CTCF binding sites, stratified by the identity of the inferred lesion containing nucleotide. Point estimate (circles) and bootstrap 95% confidence intervals (whiskers) are shown for the rate difference relative to genome-wide expectation (y = 0, mutations Mb−1 for mutation rates, relative difference metric for multiallelic variation). All rates are adjusted for trinucleotide composition. Instances where the motif_lo category has too few observed or expected mutations to calculate estimates (x-axis label grey) have no data point. Where the observed level of multiallelic variation is zero (asterisk) bootstrap confidence intervals cannot be calculated. f, Mutation rates and multiallelic variation for P15 liver expressed transcription factors; plots as in (e).
Extended Data Fig. 10
Extended Data Fig. 10. Mutagenic nucleotide excision repair.
a, Most DEN induced tumours show pronounced mutation asymmetry across approximately 50% of their genome. Asymmetric tumours meeting inclusion criteria (mutation signature and cellularity thresholds; black) are included in the preceding analyses of this study. In addition, here we include a subset of tumours that were excluded due to the absence of mutation asymmetry (n = 8, blue). b, The mutational symmetry of these tumours could be explained if both daughters of the originally mutagenised cell persist (schematic). Mutagenic NER in the first generation of the mutagenised cell could produce mutations at the same base pair in both daughter lineages; such mutations would have approximately double the variant allele frequency (VAF) of mutations confined to one daughter lineage. Whole genome duplication in the first generation of the mutagenised cell could also produce symmetric tumours. c, Tumours with symmetric mutation patterns have a significantly higher mutation load than those with asymmetric mutations, consistent with mutations from both mutagenised strands contributing to the tumour. Statistical analysis (p = 1.1 × 10⁻⁴) by two tailed Wilcoxon rank sum test. In panels c,d,f,g,h points are individual tumours, bar is median, statistical tests are based on n = 8 symmetric and n = 237 asymmetric tumours, all reported p-values are Bonferroni corrected (n = 5 tests). d, The median VAF for mutations in symmetric tumours is approximately half that of asymmetric tumours. Statistical analysis (p = 7.67 × 10⁻⁶) by two tailed Wilcoxon rank sum test. e, Automated nuclear detection (red circles) and quantification in an exemplar hematoxylin and eosin stained tumour section (93131_N2). Original digitised magnification x200; scale bar indicated. f, Nuclear area is not significantly different between symmetric and asymmetric tumours (p = 0.215, two tailed Wilcoxon rank sum test), indicating similar DNA content and arguing against mononuclear whole-genome duplication. g, The density of nuclei is not significantly different between symmetric and asymmetric tumours (p = 1, two tailed Wilcoxon rank sum test), arguing against both mononuclear and possibly multi-nuclear whole genome duplication. h, Internuclear distance is not significantly different between symmetric and asymmetric tumours (p = 1, two tailed Wilcoxon rank sum test), arguing against multi-nuclear whole genome duplication. i-p, VAF frequency distributions for symmetric tumours, indicating the VAF of MAPK pathway driver mutations (red points, also in q-x). For symmetric tumours, the driver VAFs are strongly right-biassed (i.e. high VAF). This is consistent with mutagenic NER copying the same driver mutation site into both daughter genomes of the mutagenised cell, and in turn both daughter lineages (containing either the same driver mutation, or multiallelic driver mutations at the same site) contributing to the resultant tumour. q-x, VAF frequency distributions for example asymmetric tumours. y, MAPK pathway driver mutations are biassed to the highest VAF values in symmetric tumours but not in asymmetric tumours (p = 3.61 × 10−5 two tailed Wilcoxon rank sum test, Bonferroni corrected). VAF quantile position (y-axis) indicates the fraction of mutations in a tumour that have lower VAF than the driver mutation (quantile of 1.0 indicates all other mutations in that tumour have a lower VAF). Horizontal bars indicate median VAF quantile position of the focal driver mutations. As a null expectation for comparison, one mutation was randomly selected from each of the asymmetric tumours (grey points).

Similar articles

Cited by

References

    1. Alexandrov, L. B. et al. The repertoire of mutational signatures in human cancer. Nature578, 94–101 (2020). 10.1038/s41586-020-1943-3 - DOI - PMC - PubMed
    1. Aitken, S. J. et al. Pervasive lesion segregation shapes cancer genome evolution. Nature583, 265–270 (2020). 10.1038/s41586-020-2435-1 - DOI - PMC - PubMed
    1. Burgers, P. M. J., Gordenin, D. & Kunkel, T. A. Who is leading the replication fork, Pol ε or Pol δ? Mol. Cell61, 492–493 (2016). 10.1016/j.molcel.2016.01.017 - DOI - PMC - PubMed
    1. Baris, Y., Taylor, M. R. G., Aria, V. & Yeeles, J. T. P. Fast and efficient DNA replication with purified human proteins. Nature606, 204–210 (2022). - PMC - PubMed
    1. Seplyarskiy, V. B. et al. Error-prone bypass of DNA lesions during lagging-strand replication is a common source of germline and cancer mutations. Nat. Genet.51, 36–41 (2019). 10.1038/s41588-018-0285-7 - DOI - PMC - PubMed

MeSH terms