. 2024 Jun;630(8018):968-975.
doi: 10.1038/s41586-024-07529-3. Epub 2024 Jun 12.

Obesity induces PD-1 on macrophages to suppress anti-tumour immunity

Affiliations

Obesity induces PD-1 on macrophages to suppress anti-tumour immunity

Jackie E Bader et al. Nature. 2024 Jun.

Erratum in

  • Author Correction: Obesity induces PD-1 on macrophages to suppress anti-tumour immunity.
    Bader JE, Wolf MM, Lupica-Tondo GL, Madden MZ, Reinfeld BI, Arner EN, Hathaway ES, Steiner KK, Needle GA, Hatem Z, Landis MD, Faneuff EE, Blackman A, Wolf EM, Cottam MA, Ye X, Bates ME, Smart K, Wang W, Pinheiro LV, Christofides A, Smith D, Boussiotis VA, Haake SM, Beckermann KE, Wellen KE, Reinhart-King CA, Serezani CH, Lee CH, Aubrey C, Chen H, Rathmell WK, Hasty AH, Rathmell JC. Bader JE, et al. Nature. 2024 Jul;631(8022):E16. doi: 10.1038/s41586-024-07794-2. Nature. 2024. PMID: 38982216 No abstract available.

Abstract

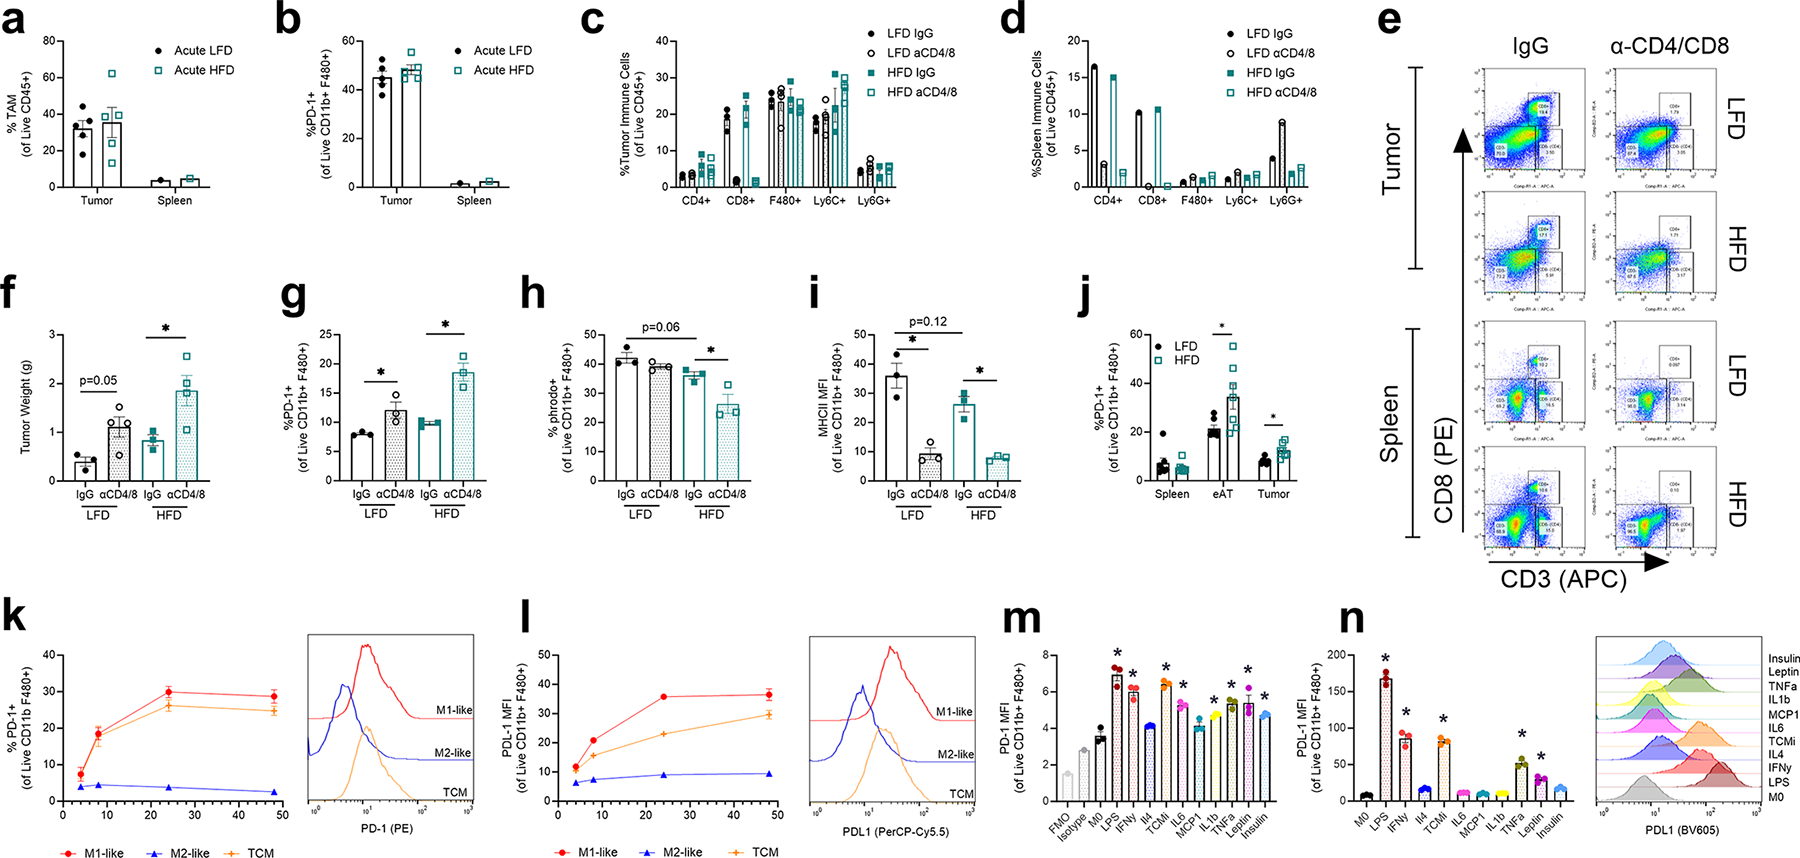
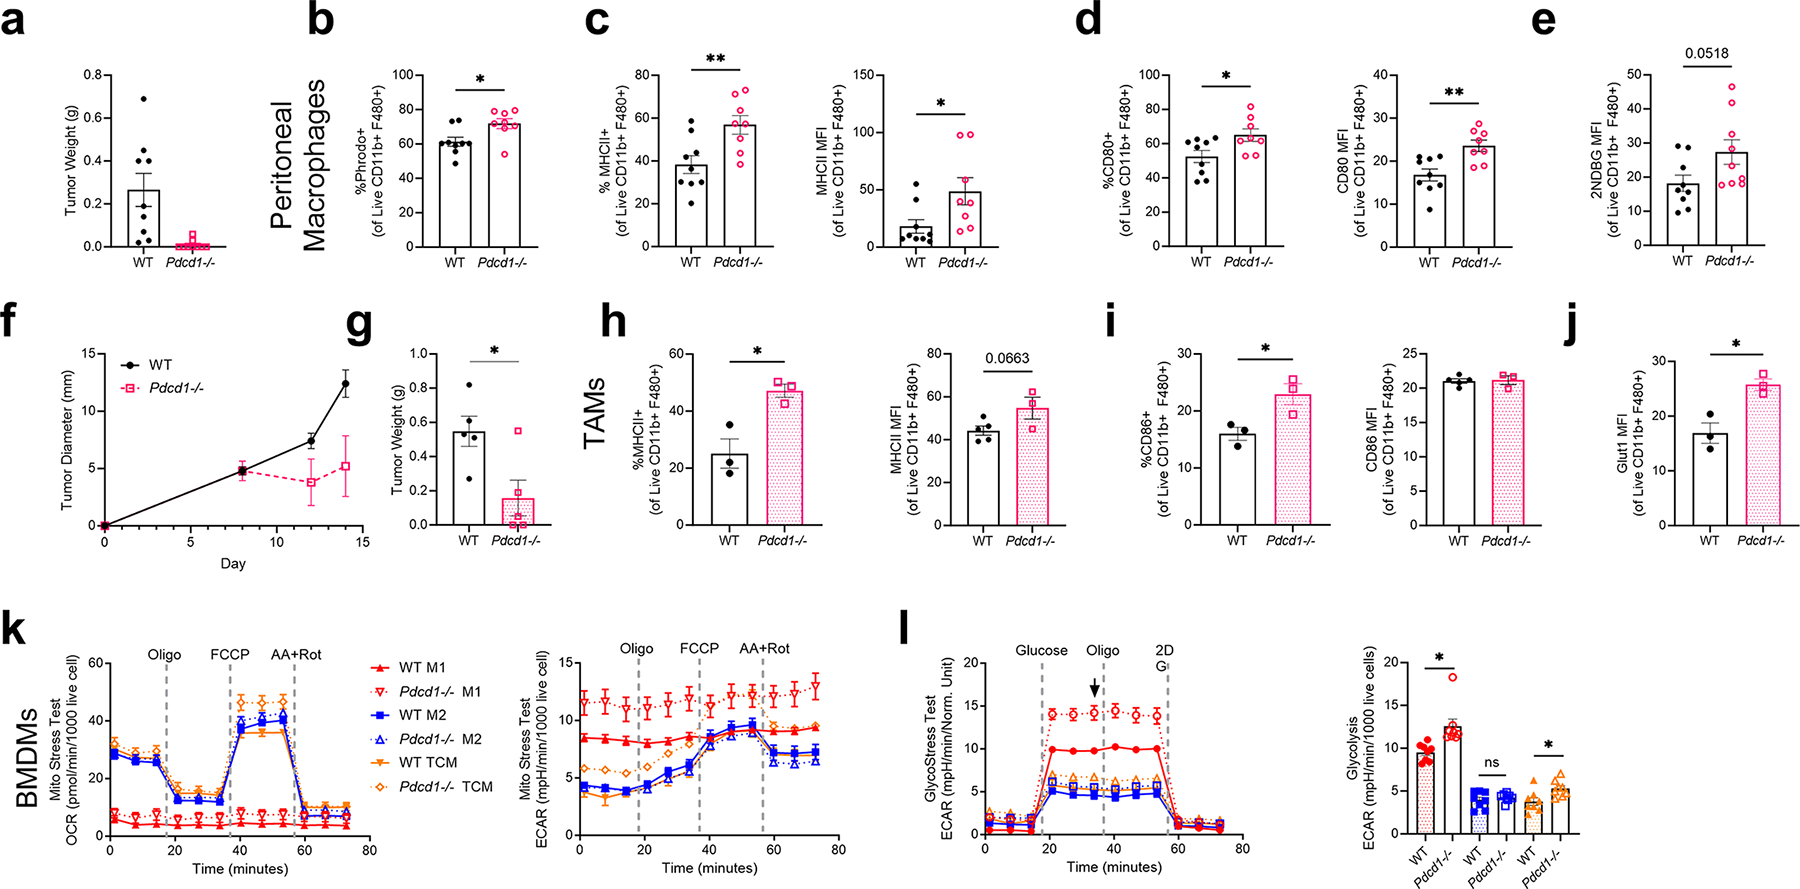
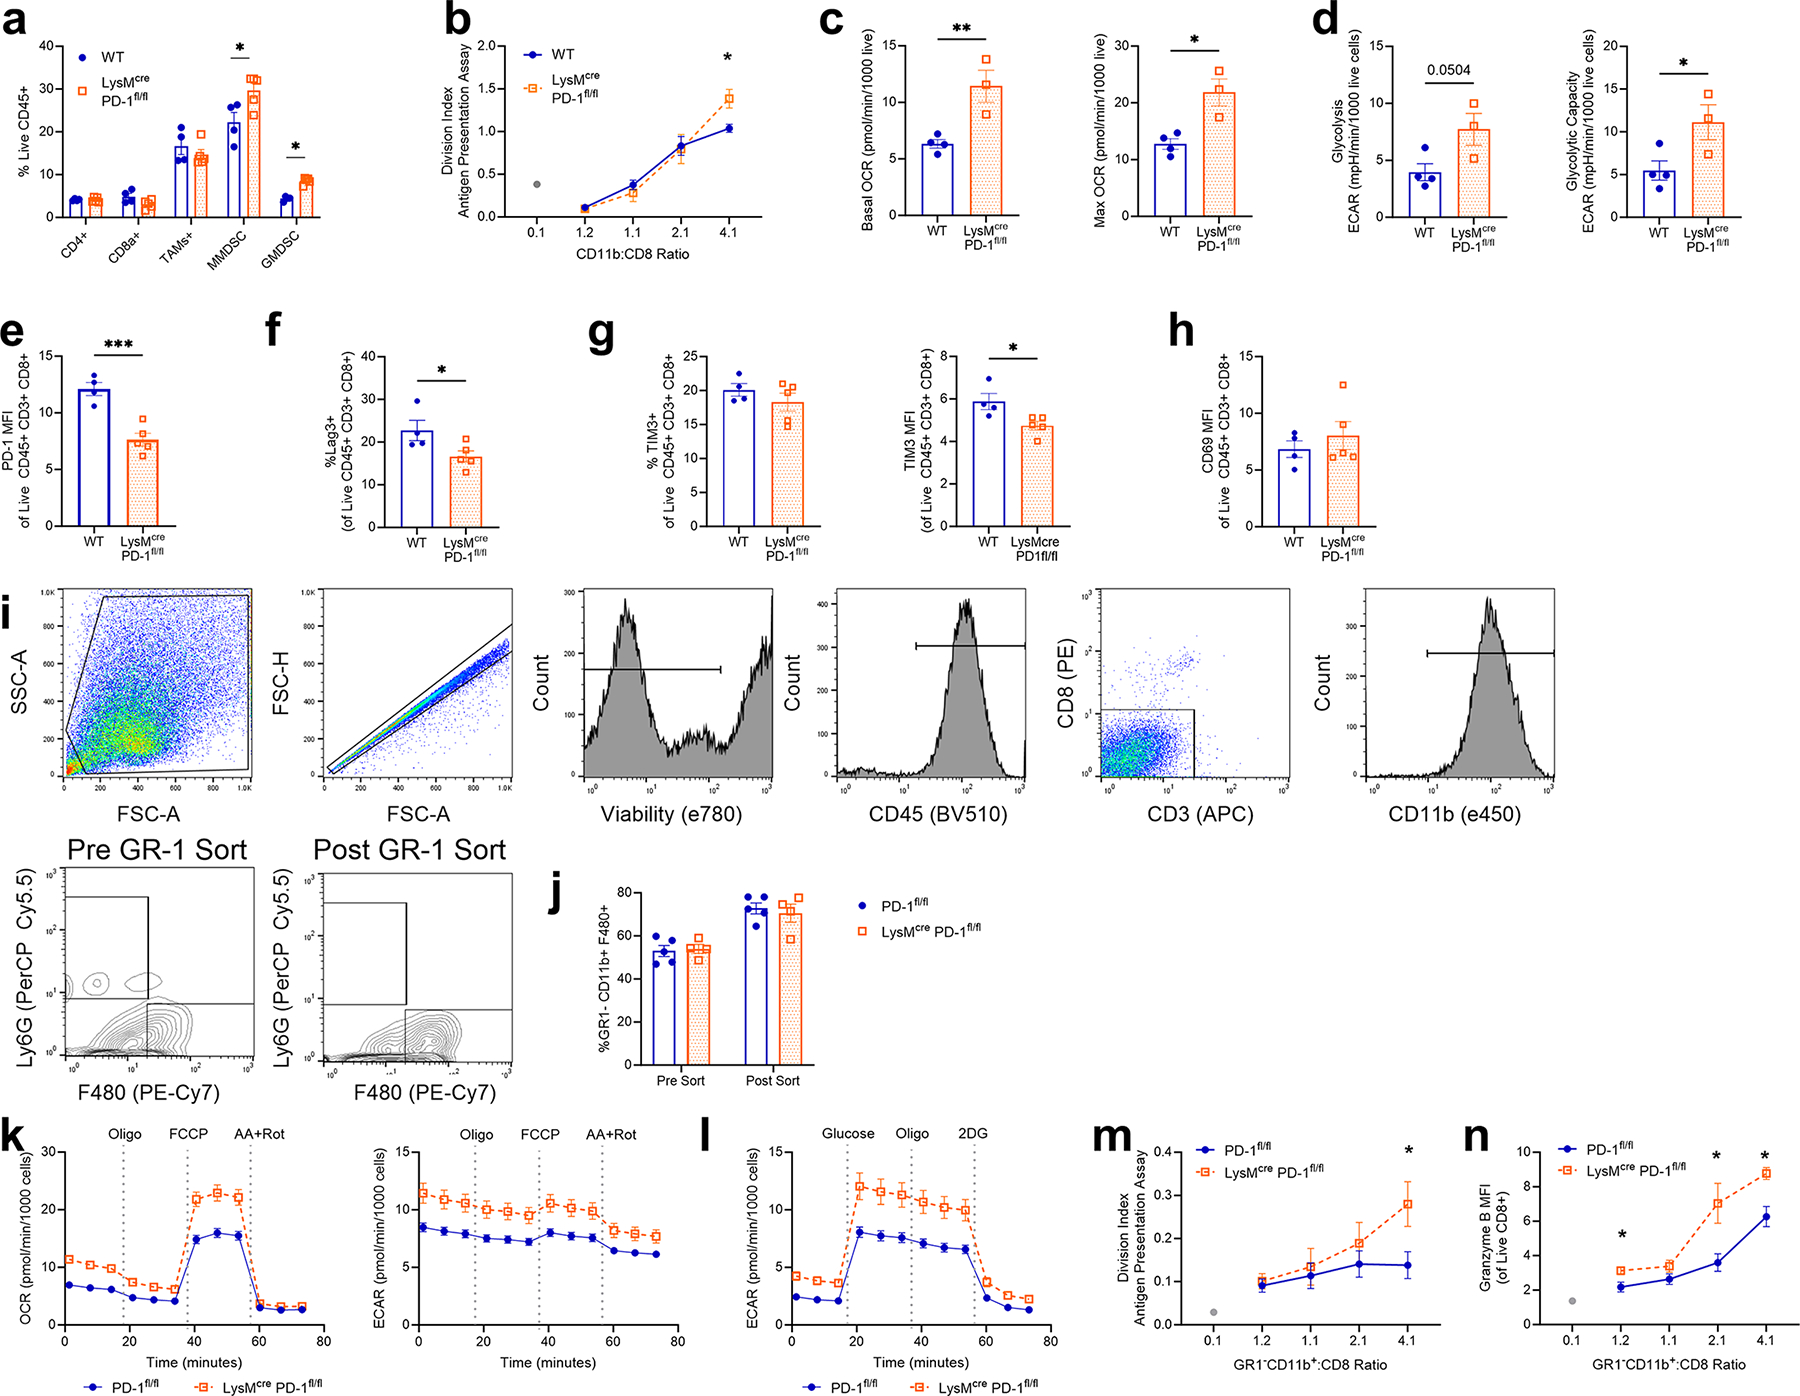
Obesity is a leading risk factor for progression and metastasis of many cancers1,2, yet can in some cases enhance survival3-5 and responses to immune checkpoint blockade therapies, including anti-PD-1, which targets PD-1 (encoded by PDCD1), an inhibitory receptor expressed on immune cells6-8. Although obesity promotes chronic inflammation, the role of the immune system in the obesity-cancer connection and immunotherapy remains unclear. It has been shown that in addition to T cells, macrophages can express PD-19-12. Here we found that obesity selectively induced PD-1 expression on tumour-associated macrophages (TAMs). Type I inflammatory cytokines and molecules linked to obesity, including interferon-γ, tumour necrosis factor, leptin, insulin and palmitate, induced macrophage PD-1 expression in an mTORC1- and glycolysis-dependent manner. PD-1 then provided negative feedback to TAMs that suppressed glycolysis, phagocytosis and T cell stimulatory potential. Conversely, PD-1 blockade increased the level of macrophage glycolysis, which was essential for PD-1 inhibition to augment TAM expression of CD86 and major histocompatibility complex I and II molecules and ability to activate T cells. Myeloid-specific PD-1 deficiency slowed tumour growth, enhanced TAM glycolysis and antigen-presentation capability, and led to increased CD8+ T cell activity with a reduced level of markers of exhaustion. These findings show that obesity-associated metabolic signalling and inflammatory cues cause TAMs to induce PD-1 expression, which then drives a TAM-specific feedback mechanism that impairs tumour immune surveillance. This may contribute to increased cancer risk yet improved response to PD-1 immunotherapy in obesity.


Conflict of interest statement

Competing interests J.C.R. has held stock equity in Sitryx and in the past two years has received unrelated research support, travel and honoraria from Sitryx, Caribou, Nirogy, Kadmon, Calithera, Tempest, Merck, Mitobridge and Pfizer. In the past two years, W.K.R. has received unrelated clinical research support from Bristol-Meyers Squib, Merck, Pfizer, Peloton, Calithera and Incyte. Both J.C.R. and W.K.R. are divested of these interests at present. K.E.B. received funding to the institution for preclinical research from Bristol-Myers Squibb–International Association for the Study of Lung Cancer–Lung Cancer Foundation of America, funding to the institution for clinical trials from Arrowhead, Aravive, Aveo, BMS, Exelexis and Merck, and consulting fees from Alpine Immune Sciences, Aravive, AstraZeneca, Aveo, BMS, Exelexis, Merck, Seagen and Sanofi. V.A.B. has patents on the PD-1 pathway licensed by Bristol-Myers Squibb, Roche, Merck, EMD-Serono, Boehringer Ingelheim, AstraZeneca, Novartis and Dako.

Figures

Extended Data Fig. 1 |
Extended Data Fig. 1 |. High Fat Diet feeding induces an obese phenotype.
a, Mouse body weights during 20 weeks of LFD or HFD feeding prior to MC38 tumor injection (n = 20 mice per diet). b, Mouse food intake during 20-week diet treatment. Food weighed weekly per cage and intake calculated as food weight difference between weeks (difference in food weight(g)/7 days/5 mice per cage X kcal of diet) (45% HFD = 4.73 kcal/g; LFD = 3.85 kcal/g) (n = 4 cages with 5 mice per cage). c-d, Blood glucose and blood insulin levels measured via tail bleed following a 4-hour fast after 20 weeks of diet treatment (n = 20 mice per diet). e-h, Representative tumor growth curves of mice inoculated with 5 × 10⁵ MC38 cells following 20 weeks of diet treatment (n = 6–8 mice per group). i, Tumor weights on day 19 following subcutaneous inoculation. “X” indicates days of anti-PD-1 or IgG injection. Data points identified as “+” were pooled together at equal amounts of live cells for subsequent single cell RNA sequencing analysis. j, Percent change in tumor growth in response to a-PD-1 treatment within respective diets ((Tumor Diameter Day 9 LFD α-PD-1 – Diameter Day 19 LFD IgG) ÷ Diameter Day 19 LFD IgG × 100). P values were calculated using an unpaired two-tailed t-test (a-d, j) or two-way ANOVA using a Fishers LSD test for multiple comparisons (i). ns=p > 0.05; * p ≤ 0.05; ** p ≤ 0.01.
Extended Data Fig. 2 |
Extended Data Fig. 2 |. Cell characterization of CD45+ and CD45 cells from MC38 tumors.
a-b, Cell counts of SingleR annotated clusters from scRNAseq of MACS enriched CD45 and CD45+ MC38 tumor samples. c, Heat map of identifying genes used to annotate CD45+ clusters. d, Representative gating strategy for quantifying T cell and macrophage cell populations within the spleen and tumor of MC38 tumor bearing mice. e-g, Quantification of tumor CD8+, CD4+ and TAMs, respectively, gated on live singlets in MC38 tumors. h-j, Quantification of percent positive and MFI of tumor PD-1+, Lag3+ and Tim3+ CD8 T cells, CD4 T cells and TAMs. k, Frequency of Pdcd1+ cells in TAM clusters of scRNAseq dataset. Data is representative of one experiment, n = 3 pooled tumors from each treatment group (a-b, k). Each data point represents a biological replicate; data are mean ± s.e.m. P values were calculated using a Two-way ANOVA with a Fishers LSD test for multiple comparisons. ns=p > 0.05; * p ≤ 0.05.
Extended Data Fig. 3 |
Extended Data Fig. 3 |. HFD reduced clonality of CD8 T cells and impairs TAM function and metabolic signature with MC38 tumors.
a, UMAP of clone abundance within each treatment group from V(D)J Sequencing of T cell clusters with productive TCRs from scRNAseq dataset. b, Absolute number of T cells with paired TCR-a and TCR-b sequences. Data is representative of one experiment, n = 3 pooled tumors from each treatment group. c, Representative gating strategy for TAMs from MC38 tumors, identified as live singlets CD45+, CD8 CD11b+ and F480+. d, MFI of phrodo+ TAMs. e, MFI of MHCII in TAMs. f, Percent positive and MFI of CD80 in TAMs. MFI values were normalized within trials to IgG controls. g-i, Measurement of basal OCR, basal ECAR and OCR:ECAR ratio of MACS enriched CD11b+ cells sorted from MC38 tumors during a MitoStress Test measured using Agilent Seahorse extracellular flux analyzer. Each data point represents a biological replicate; For d-f MFI was normalized to the average of LFD IgG control within each independent trial and combined from 2 independent experiments. Data are mean ± s.e.m. P values were calculated using a Two-way ANOVA with a Fishers LSD test for multiple comparisons. * p ≤ 0.05.
Extended Data Fig. 4 |
Extended Data Fig. 4 |. Pdcd1 is increased in TAMs in many types of cancers.
a, Pdcd1 expression within tumor immune cells subsets from scRNAseq within TISCH2 database. b-c, Pdcd1 expression in CD8 T effector and Monocyte/Macrophage identified cells in the TISCH2 scRNAseq database from various cancer datasets. d, Percent Pdcd1+ macrophages from human ccRCC tumor samples measured using gene expression from scRNAseq dataset (n = 11 patients) e, Percent Pdcd1+ macrophages of human CRC tumor samples quantified using gene expression from scRNAseq (n = 62 patients) f-g, Percent Pdcd1+ macrophage cells corresponding to pathological tumor grade compared to adjacent normal tissue from human CRC or human ccRCC tumor samples measured using gene expression from scRNAseq. h, Enrichment of KEGG metabolic signature scores of Pdcd1 versus Pdcd1+ TAMs from human CRC scRNAseq. Data are mean ± s.e.m. P values were calculated using an unpaired two-tailed t-test. *p ≤ 0.05, **p ≤ 0.01.
Extended Data Fig. 5 |
Extended Data Fig. 5 |. Tumor Associated Macrophages express PD-1 in human tumor samples which is not directly associated with TREM2 expression.
a, Representative histogram and contour plot illustrating PD-1 expression within TAMs or CD8 T cells from human ccRCC patients. b, Frequency of live singlets CD45+ CD11b+ CD68+ and CD163+ TAMs and CD45+ CD8+ T cells from ccRCC patient PBMCs or tumor. c, MFI of PD-1 expression in TAMs and CD8 T cells from ccRCC patient samples. d, Representative flow gating strategy of MACS sorted CD11b+ and CD8+ cells from freshly isolated human ccRCC tumors or matched PBMCs. e, Histogram representing PD-1, TIM3 and LAG3 expression on human peripheral blood mononuclear cells (PBMCs) and matched ccRCC tumor in MACS sorted CD11b+ TAMs and CD8+ TILs. f, Representative image of Tumor Microarray (TMA) staining identifying PD-1 colocalizing with CD163+ and CD8+ cells at 40X magnification. Scale bar 50 mm. g, Frequency of PD-1+ TAMs or PD-1+ CD8 T cells from TMA staining with patient clinical data categorized by BMI status (lean BMI < 25; obese BMI 30–35) (n = 28 lean patients; n = 53 obese). h, Area of CD163+ or CD8+ staining taken from endometrial carcinoma tumor tissues obtained from 5 patients before and after at least a 10% body weight loss. i, Representative PD-1 and TREM2 expression from live CD11b+ CD163+ and CD68+ TAMs from human ccRCC tumor samples. j, Percent positive of PD-1+ cells in tumor immune cells from MC38 subcutaneous murine tumors. k, MFI of PD-1 expression within different immune cell subsets with representative overlay of histogram and contour plots with FMO control. Each data point represents individual patient samples. Data are mean ± s.e.m. P values were calculated using an unpaired two-tailed t-test (d, e, i) or a paired two tailed t-test (h). P values were calculated using a one way ANOVA compared to CD3 CD11b cells (j-k).ns p > 0.05, *p ≤ 0.05, ****p ≤ 0.001.
Extended Data Fig. 6 |
Extended Data Fig. 6 |. Obesity and metabolic dysfunction induce PD-1 expression on TAMs.
a, Tumor diameter over time of pancreatic tumor cells, 6419c5, injected 2 × 10⁵ subcutaneously into mice fed a LFD or 45% HFD diet for 20–25 week. b, Tumor weight at Day17 post injection of pancreatic tumor cell line. c-d, Percent positive and MFI of PD-1 of TAMs and CD8 T cells respectively from pancreatic tumors. e-g, Percent positive and MFI of MHCII, CD80 and PDL1 of TAMs from pancreatic tumors. h, Percent of phrodo positive TAMs from pancreatic tumors. i) MFI of Bodipy C:16 uptake in TAMs from pancreatic tumors. j, Tumor diameter over time of subcutaneous kidney tumor cells, LVRCC, injected 2×10⁶ subcutaneously into mice fed a LFD or 45% HFD diet for 20–25 week. k, Tumor weight at Day 28 post injection of kidney tumor cell line. l-m, Percent positive and MFI of PD-1 of TAMs and CD8 T cells respectively from kidney tumors. n-o, Percent positive PD-1 of TAMs and CD8 T cells respectively from 3 × 10⁵ PD-L1 expressing EO771 cells injected in 4th mammary pad of female C57BL6/J mice ovariectomized at 6 weeks of age following 25 weeks of LFD or 60% HFD treatment. p, Tumor weight of FVB/MMTV-PyMT mice injected with or without streptozotocin (STZ) at 70 mg/kg and fed a 60% HFD for 12 weeks. q, Percent positive of PD-1 of TAMs from PYMT tumors. Each data point represents biological replicates. In n-o data were combined from 4 independent trials. In p-q data were combined from 4 independent trials and normalized to control within each trial. Individual tumors from PyMT mice with multiple tumors were processed separately. Dots of the same color indicate individual tumors collected from the same mouse. Data are mean ± s.e.m. P values were calculated using an unpaired two-tailed t-test. ns p > 0.05, *p ≤ 0.05, **p ≤ 0.01.
Extended Data Fig. 7 |
Extended Data Fig. 7 |. Obesity induced PD-1 expression on TAMs independent of T cell presence.
a, Percent of CD11b+ F480+ macrophages within MC38 tumors and spleens following 2 weeks of LFD or 45% HFD treatment (acute diet). b, Percent of PD-1+ macrophages in tumor and spleen following 2-week acute diet treatment. c-e, Relative abundance of indicated immune cell populations in MC38 tumor (c) and spleen (d) with diet and αCD4/8 treatments (n = 3 mice/group) with representative flow cytometry plots (e) demonstrating T cell depletion. f-i, Tumor weights, PD-1+ expression, % phrodo+ cells, and MHCII expression on CD11b+/F480+ TAMs on day 14 of MC38 tumors following αCD4 and αCD8 T cell depletion in mice fed LFD or HFD for 20 weeks (n = 3–4 mice). j, Frequency of PD-1+ macrophages from spleen, epididymal adipose tissue, or tumors of s.c. pancreatic tumor-bearing mice following 20 weeks of diet treatment. k, Frequency of PD-1+ BMDMs following 4-, 8-, 24- and 48-hours exposure to IFNg (M1-like;Pro-inflammatory), IL-4 (M2-like; Anti-inflammatory) or tumor-conditioned media (TCM). l, MFI of CD274 (PD-L1) of BMDMs following 4-, 8-, 24- and 48-hour exposure to (M1), (M2) or (TCM) conditions. m, MFI of PD-1 of BMDMs following 24-hour exposure to LPS, IFNg, IL-4, TCM, IL-6, MCP-1, IL-1b, TNF-a, leptin, or insulin with representative Isotype and FMO control. n, MFI expression of PD-L1 and representative histograms of BMDMs following 24-hour stimulation. Data points indicate biological replicates. Data in E is one sample of 3–5 pooled spleens per treatment group. Data are mean ± s.e.m. P values were calculated using a Two-Way ANOVA followed by a Fishers LSD test for multiple comparisons (f-i) or an unpaired two-tailed t-test (j). P values were calculated using a one-way ANOVA compared to untreated M0 BMDMs (k-n) *p ≤ 0.05). *p ≤ 0.05). Data points indicate biological replicates (n = 3). Data are mean ± s.e.m.
Extended Data Fig. 8 |
Extended Data Fig. 8 |. Pdcd1+ and PD-1 + TAMs have a unique gene signature.
a, GO Biological Process Pathway Analysis of differential gene expression from Pdcd1 versus Pdcd1+ TAMs from MC38 scRNAseq TAM clusters independent of diet or treatment. b, Differential Gene expression of select genes from Pdcd1 versus Pdcd1+ TAMs from MC38 scRNAseq (See Supplementary Table 1 for full list of significant genes). c, Quantification of Pdcd1 CPM expression from FACS sorted PD-1+ and PD-1low/negative populations. d, Bulk RNA sequencing of Hallmark Pathway analysis of DEGs from PD-1low/negative versus PD-1+ TAMs via FACS. Data points or squares represent biological replicates as mean ± s.e.m (n = 10). P values were calculated using a paired two-tailed t-test. ***p ≤ 0.001.
Extended Data Fig. 9 |
Extended Data Fig. 9 |. PD-1 expression in macrophages is dependent on PI3K, mTOR, NF-κB and c-Myc activation.
a, Percent viability, MFI of PD-1 and percent PD-1+ of primary BMDMs stimulated with LPS (1ug/mL) and treated with c-Myc inhibitors (KJ Pyr 9 10ug/mL and 10058-F4 10ug/mL), mTOR inhibitor (Rapamycin 250 ng/mL), AMPK agonist (AICAR 2ug/mL) and NF-κB inhibitor (BMS-345541 1.2ug/mL) for 24 h. b, Percent viability, MFI of PD-1 and percent PD-1+ of immortalized cas9 BMDMs treated with c-Myc inhibitors (KJ Pyr 9 10ug/mL and 10058-F4 10ug/mL), mTOR inhibitor (Rapamycin 350 ng/mL), AMPK agonist (AICAR 5ug/mL) and NF-κB inhibitor (BMS-345541 300ug/mL) for 24 h. c, Percent viability, MFI of PD-1 and percent PD-1+ of RAW264.7 cells treated with c-Myc inhibitors (KJ Pyr 9 10ug/mL and 10058-F4 10ug/mL), mTOR inhibitor (Rapamycin 87.5 ng/mL), AMPK agonist (AICAR 52.5 g/mL) and NF-κB inhibitor (BMS-345541 150ug/mL) for 24 h. d, Western blot of PTEN expression of immortalized cas9 BMDMs following crispr mediated deletion of PTEN. Ctrl is the empty vector. All studies used PTEN 2 clone e, Pdcd1 expression of monocytes enriched from PBMCs of healthy donors or a PTEN haploinsufficient patient. Data points in a indicate biological replicates (n = 4). Data points in b-c indicate technical replicates (n = 4) and is representative of >3 independent trials. Data points in e represent 2 independent healthy donors and a PTEN deficient patient. Data are mean ± s.e.m. P values were calculated using a one-way ANOVA (A-C). ns p > 0.05, *p ≤ 0.05, **p ≤ 0.01, ****p ≤ 0.0001.
Extended Data Fig. 10 |
Extended Data Fig. 10 |. Deletion of Pdcd1 suppresses tumor growth and promotes a pro-inflammatory, glycolytic phenotype in macrophages.
a, Tumor weight on Day 14 following 1×10⁶ MC38 cells injected subcutaneously into WT or Pdcd1−/− age matched mice (n = 8–10mice). b, Percent phrodo+ of peritoneal macrophages from WT or Pdcd1−/− tumor-exposed mice c, Percent positive and MFI of MHCII of peritoneal macrophages d) Percent positive and MFI of CD80 of peritoneal macrophages e, MFI of 2-NBDG in peritoneal macrophages following 45 min exposure to 2-NDBG. f-g, Tumor diameter over time and tumor weight on Day 14 following 5×10⁶ MC38 cells injected subcutaneously into WT or Pdcd1−/− age matched mice (n = 3–5mice). h-j, Frequency and MFI of MHCII, CD86 and Glut1 expression on TAMs from WT or Pdcd1−/− mice. k, OCR and ECAR measurements over time from MitoStress Test of BMDMs isolated from WT or Pdcd1−/− mice stimulated for 24 h with IFN-g (M1), IL-4 (M2), or 50% Tumor Conditioned Media (TCM). l, ECAR measurement over time from GlycoStress test of BMDMs with corresponding Glycolysis calculation. Data points in f-g represent 6 biological replicates run in triplicate. P values were calculated using an unpaired two-tailed t-test; ns= p > 0.05, *p ≤ 0.05, **p ≤ 0.05).
Extended Data Fig. 11 |
Extended Data Fig. 11 |. Direct effects of anti-PD-1 treatment on tumor conditioned macrophage function and metabolism.
a, OCR from MitoStress Test of BMDM stimulated with TCM for 24 h followed by treatment with recombinant mouse PD-L1 and/or anti-PD-1 for an additional 24 h. b, c, Percent positive phrodo, and CD80 of TCM stimulated BMDM following rmPD-L1 and/or anti-PD-1 treatment. d-f, Percent positive phrodo, CD80 and MHCII of TAMs from MACS isolated CD11b+ cells from MC38 tumors ex-vivo treated α−PD-1 for 24 h. g, Fold change of MHCII, MHCI, Glut1, and iNOS expression of IgG/a-PD-1 ex-vivo treated TAMs from LFD versus HFD treated MC38 tumor bearing mice. h, Volcano plot of differentially expressed genes from MACS isolated CD11b+ cells from MC38 tumors ex-vivo treated α-PD-1 for 24 h. Data points indicated biological replicates. Data in a-c representative of ≥ three independent experiments with ≥ 3 mice per group run in triplicate. Data are mean ± s.e.m. P values were calculated using a One-way ANOVA (a-c), a paired two-tailed t-test (d-f), or an unpaired two tailed t-test g, *p ≤ 0.05, **p ≤ 0.01).
Extended Data Fig. 12 |
Extended Data Fig. 12 |. Myeloid specific PD-1 depletion improves TAM anti-tumor function.
a, Frequency of immune cell subsets from MC38 tumors injected into WT and LysMcre Pdcd1fl/fl mice. b, Division index calculated from flow cytometry analysis of CTV staining CD11b+ isolated cells from MC38 tumors from WT vs LysMcre Pdcd1fl/fl mice cocultured with OT1 CD8+ isolated splenocytes. Cocultured cells treated in the presence of 1 mg/ml OVA protein for 5 days. c, Basal and maximal OCR measurements from MitoStress Test of CD11b+ isolated cells from MC38 tumors of WT and LysMcre Pdcd1fl/fl. d, Calculated glycolysis and glycolytic capacity following GlycoStress Test of CD11b+ isolated cells from MC38 tumors of WT and LysMcre Pdcd1fl/fl. e-h, Percent positive and MFI of PD-1, Lag3, TIM3 and CD69 expression on CD8 T cells from MC38 tumors of WT and LysMcre Pdcd1fl/fl. i, Representative gating following serial MACS isolations of Gr-1− cells followed by CD11b+ MACS isolation. j, Purity of GR-1 CD11b+ F480+ cells before and after MACS sorting. k-l, OCR and ECAR measurement over time from a MitoStress Test and ECAR measurement over time from a GlycoStress Test of MACS isolated GR-1 CD11b+ cells from MC38 tumors in WT vs LysMcre Pdcd1fl/fl male mice. m, Division index calculated from flow cytometry analysis of CellTrace violet staining GR-1 CD11b+ isolated cells from MC38 tumors from WT vs LysMcre Pdcd1fl/fl mice cocultured with OT1 CD8+ isolated splenocytes. Cocultured cells treated in the presence of 1 mg/ml OVA protein for 5 days. n, MFI of Granzyme B expression from OT1 CD8+ cells cocultured as indicated in in panel m. Data representative of ≥ three independent experiments with 3–6 mice per group. Data are mean ± s.e.m. P values were calculated using an unpaired two-tailed t-test. (*p ≤ 0.05, **p ≤ 0.01, ***p ≤ 0.001).
Fig. 1 |
Fig. 1 |. Obesity impairs anti-tumour immune cell function and metabolic signature.
a, Schematic illustrating experimental approach. s.c., subcutaneous. b, Tumour growth of MC38 tumours over time in mice receiving IgG or anti-PD-1 treatment following 20–25 weeks of diet treatment. c, Uniform manifold approximation and projection (UMAP) embeddings of scRNA-seq profiles for CD45 cells from MC38 tumours annotated using SingleR. NKT, natural killer T cell; ILC, innate lymphoid cell. d, Density UMAPs of CD45 cells from the four treatment groups. e, UMAP of CD45+ cells from MC38 tumours annotated using SingleR. DC, dendritic cell; MDSC, myeloid-derived suppressor cell; NK, natural killer. f, Density UMAPs of CD45+ cells from the four treatment groups. gi, Violin plot of Gzmb (g), Havcr2 (h) and Lag3 (i) gene expression within clusters identified as CD8+ T cells from scRNA-seq MC38 tumours. j, Combined UMAP of clone abundance from V(D)J sequencing of T cell clusters with productive TCRs. k, Frequency of total T cells within treatment groups with paired TCRα and TCRβ sequences from MC38 tumours. l, Compass analysis of scRNA-seq data presented as differential activity of metabolic reactions from clusters identified as CD8+ and macrophages comparing LFD IgG to HFD IgG groups partitioned by Recon2 pathways. ROS, reactive oxygen species. m, Percentage of pHrodo+ cells gated on live CD11b+F480+ TAMs from MC38 tumours. n, Mean fluorescence intensity (MFI) of MHC-I on TAMs from MC38 tumours. o, Percentage of MHC-II+ TAMs from MC38 tumours. For b, lines indicate the average tumour diameter measured over time (n = 8). For scRNA-seq (cl), data are representative of 1 experiment, n = 3 pooled tumours from mice in each treatment group. For mo, each data point represents a biological replicate (n = 8). Data are mean ± s.e.m. Data in mo represent ≥2 independent experiments with ≥3 mice per treatment group pooled together. P values were calculated using a two-way analysis of variance (ANOVA) with a Fisher’s least significant difference test for multiple comparisons (b,mo) or Wilcoxon rank-sum test (gi). *P ≤ 0.05. The images of the needles, the tumour and the magnetic affinity cell sorting (MACS) set-up in a were created with BioRender.com.
Fig. 2 |
Fig. 2 |. Obesity and obesity-associated signalling drive macrophage-specific PD-1.
a,b, Area of co-localized staining of CD163+ PD-1+ TAMs (a) or CD8+ PD-1+ T cells (b), from endometrial carcinoma tumour tissues obtained from five patients before and after a body weight loss of at least 10%. Immunofluorescence staining was carried out on serial sections (4 μm thickness) of tumour tissue from formalin-fixed paraffin-embedded samples. c, Representative image of co-localized staining of CD163+ PD-1+ TAMs, from endometrial tumours from patients before and after weight loss (yellow arrows exemplify double positive stained TAMs). DAPI, 4′,6-diamidino-2-phenylindole. d,e, Percentage PD-1+ within CD8+ and F480+ gated live cells from LFD- and HFD-fed mice with representative histograms (n = 17 mice/treatment). f, Frequency of PD-1+ macrophages from bone marrow, gonadal adipose tissue (gAT), peritoneal exudate cells (PECs) or spleen from non-tumour-bearing mice fed a 60 kcal% HFD or 10 kcal% LFD for 20 weeks (n = 5 mice or treatments). g, Frequency of PD-1+ macrophages from bone marrow, gonadal adipose tissue, peritoneal exudate cells or spleen from 8-week-old mice with thioglycolate-induced peritonitis (n = 5 mice or treatments). h, PD-1 expression of BMDMs following 24-h exposure to LPS (1 ng ml−1), IFNγ (50 ng ml−1), IL-4 (50 ng ml−1), TCMi (25% tumour-conditioned medium), IL-6 (50 ng ml−1), MCP1 (also known as CCL2; 50 ng ml−1), IL-1β (50 ng ml−1), TNF (50 ng ml−1), leptin (5 mg ml−1) or insulin (100 mg ml−1) (n = 3 mice). i,j, Viability (i) and PD-1 expression (j) of BMDMs following 24-h treatment with increasing doses of BSA-conjugated palmitic acid (n = 3 mice); dotted horizontal line indicate mean of M0 control group. Data points in a,b indicate data for individual patients for pre-operative endometrial biopsies taken before weight loss and matched hysterectomy specimens taken after weight loss (n = 5 patients). In dj, each data point represents a biological replicate; data are mean ± s.e.m.; data in e represent ≥4 independent experiments with ≥3 mice per diet group combined together. P values were calculated using a paired two-tailed t-test (a,b), an unpaired two-tailed t-test (dg) or a one-way ANOVA compared to IgG or M0 (unstimulated BMDMs) (hj). NS, P > 0.05; *P ≤ 0.05; **P ≤ 0.01.
Fig. 3 |
Fig. 3 |. PD-1-mediated macrophage dysfunction is dependent on mTOR and MYC activation.
a, Hallmark pathway analysis of differential gene expression of FACS-isolated PD-1low/− versus PD-1+ live CD11b+F480+ cells from MC38 tumours (n = 10 mice). b, Representative extracellular flux analysis of the oxygen consumption rate (OCR) of PD-1+ and PD-1low/− FACS-sorted TCM-stimulated BMDMs (left) with quantified basal respiration, maximal respiration and basal OCR/extracellular acidification rate (ECAR) ratio (right; each dot represents a technical replicate (n = 3); data representative of two independent experiments). c, MFI (left) and representative histogram (right) of MitoTracker Green staining of live PD-1low/− and PD-1+ TAMs from MC38 subcutaneous tumours. d–e, MFI (left) and representative histograms (right) of palmitate analogue BODIPY C:16 uptake in TAMs (d) and percentage pHrodo+ TAMs (left) and representative histogram (right) (e) from pancreatic subcutaneous tumours following 30 min acclimation and 45 min incubation with BODIPY dye or pHrodo beads. f, Percentage MHC-II+ TAMs (left) and representative histogram (right) from MC38 subcutaneous tumours. g, Histogram of MFI of pS6 from BMDMs treated with LPS (100 ng ml−1) for 24 h. h, Frequency of PD-1+ BMDMs treated with LPS with or without rapamycin (200 ng ml−1) for 24 h. i, Frequency of PD-1+ peritoneal macrophages following thioglycolate-induced peritonitis treated with or without rapamycin. j, MFI of PD-1 in immortalized cas9 BMDMs subjected to CRISPR-mediated Pten deletion compared to control immortalized cas9 BMDMs transduced with an empty vector. k, Frequency of PD-1+ BMDMs stimulated with LPS + IFNy for 24 h followed by 24 h treatment with metabolic inhibitors of glycolysis (2-DG, 5 mM), glutaminolysis (6-diazo-5-oxo-l-norleucine (DON), 5 mM) and fatty acid oxidation (etomoxir, 100 mM). Each data point represents a biological replicate unless stated otherwise and is presented as mean ± s.e.m.; in j data point represents an independent trial that indicates the average of three technical replicates per trial. P values were calculated using a paired two-tailed t-test unless stated otherwise. P values in b,i were calculated using an unpaired two-tailed t-test. P values in k were calculated using a one-way ANOVA (NS, P > 0.05; *P ≤ 0.05; **P ≤ 0.01; ***P ≤ 0.001; ****P ≤ 0.001).
Fig. 4 |
Fig. 4 |. Anti-PD-1 directly rescues macrophage anti-tumour function and metabolism.
a, ECAR from extracellular flux analysis of a GlycoStress test of TCM-stimulated BMDMs following rmPD-L1 (1 mg) and anti-PD-1 (1 mg) treatment with quantified maximal glycolysis (n = 4 mice run in triplicate). b, ECAR from a MitoStress test of TCM-stimulated BMDMs following rmPD-L1 (1 mg) and anti-PD-1 (1 mg) treatment (left) with quantified basal (middle) and maximal (right) ECAR (n = 4 mice run in triplicate). c, MFI of BODIPY C:16 uptake of TCM-stimulated BMDMs treated with rmPD-L1 and/or anti-PD-1. d, MFI or percentage positive of GLUT1, MHC-II+, MHC-I and iNOS from TAMs isolated from MC38 tumours from LFD- or HFD-treated mice and ex vivo-treated with anti-PD-1 for 24 h. e, Kyoto Encyclopedia of Genes and Genomes pathway analysis of differentially expressed genes from MACS-enriched CD11b+ cells from MC38 tumours ex vivo-treated with or without anti-PD-1 (1 μg ml−1) for 24 h. All pathways indicated are M. musculus (house mouse). fh, MFI of MHC-I (g), MHC-II (f) and CD86 (h) expression in BMDMs stimulated with IFNy and treated with IgG or anti-PD-1 and with or without 2-DG for 24 h. Each data point represents a biological replicate unless stated otherwise and is presented as mean ± s.e.m. P values were calculated using a one-way ANOVA (ac), a paired two-tailed t-test (d) or a two-way ANOVA (fh). *P ≤ 0.05; **P ≤ 0.01; ***P ≤ 0.001.
Fig. 5 |
Fig. 5 |. Targeting macrophage-specific PD-1 improves T cell-mediated anti-tumour immunity.
a, Tumour weight on day 16 of MC38 tumour in mice treated with anti-CD4 and anti-CD8 cocktail on days −1, 2, 7, 12 and 15 and 200 mg anti-PD-1 or IgG on days 9, 11, 13 and 15. b, Frequency of pHrodo+ CD11b+F480+ TAMs from MC38 tumours. c,d, MFI of BODIPY C:16 uptake (c) and GLUT1 expression (d) in macrophages from MC38 tumours. MFI values were normalized within trials to IgG controls. Data are combined from two independent experiments e, Tumour diameter over time following injection of MC38 cells in wild-type (WT) versus LysMCre Pdcd1fl/fl male mice. f, Frequency of pHrodo+ CD11b+F480+ TAMs. g, MFI of BODIPY C:16 uptake of TAMs. h, OCR measurement over time from a MitoStress test (left) and ECAR measurement over time from a GlycoStress test (right) of MACS-isolated CD11b+ cells from MC38 tumours in wild-type versus LysMCre Pdcd1fl/fl male mice. i, Left: division index calculated from flow cytometry analysis of CellTrace Violet (CTV) staining. CD11b+ cells isolated from MC38 tumours from wild-type or LysMCre Pdcd1fl/fl mice were co-cultured with isolated CD8+ OT1 splenocytes in the presence of 1 mg SIINFEKL for 2 days. Right: histogram of CellTrace Violet staining of co-cultured SIINFEKL-treated CD8+ T cells with unstimulated CD8+ T cells. Stim, stimulation. j, MFI of granzyme B expression in CD8+ T cells co-cultured at 4:1 with MACS-isolated CD11b+ cells from MC38 tumours k, Percentage of PD-1+CD8+ T cells from MC38 tumours of wild-type and LysMCre Pdcd1fl/fl mice (left) with histogram (right). Data in ad are combined from two independent trials and normalized to IgG control within each trial. Data in ek represent ≥3 independent experiments. Data are mean ± s.e.m. P values were calculated using a two-way ANOVA with a Fisher’s least significant difference test for multiple comparisons (ad) and an unpaired two-tailed t-test (ek). *P ≤ 0.05; **P ≤ 0.001.

Comment in

References

    1. Islami F, Goding Sauer A, Gapstur SM & Jemal A Proportion of cancer cases attributable to excess body weight by US state, 2011–2015. JAMA Oncol. 5, 384–392 (2019). - PMC - PubMed
    1. Sung H et al. Global patterns in excess body weight and the associated cancer burden. CA Cancer J. Clin. 69, 88–112 (2019). - PubMed
    1. Choi Y et al. Body mass index and survival in patients with renal cell carcinoma: a clinical-based cohort and meta-analysis. Int. J. Cancer 132, 625–634 (2013). - PubMed
    1. Hakimi AA et al. An epidemiologic and genomic investigation into the obesity paradox in renal cell carcinoma. J. Natl Cancer Inst. 105, 1862–1870 (2013). - PMC - PubMed
    1. Schlesinger S et al. Postdiagnosis body mass index and risk of mortality in colorectal cancer survivors: a prospective study and meta-analysis. Cancer Causes Control 25, 1407–1418 (2014). - PubMed

MeSH terms

Substances