. 2024 Jun;630(8018):976-983.
doi: 10.1038/s41586-024-07537-3. Epub 2024 Jun 12.

CTLA-4-expressing ILC3s restrain interleukin-23-mediated inflammation

Collaborators, Affiliations

CTLA-4-expressing ILC3s restrain interleukin-23-mediated inflammation

Anees Ahmed et al. Nature. 2024 Jun.

Abstract

Interleukin (IL-)23 is a major mediator and therapeutic target in chronic inflammatory diseases that also elicits tissue protection in the intestine at homeostasis or following acute infection1-4. However, the mechanisms that shape these beneficial versus pathological outcomes remain poorly understood. To address this gap in knowledge, we performed single-cell RNA sequencing on all IL-23 receptor-expressing cells in the intestine and their acute response to IL-23, revealing a dominance of T cells and group 3 innate lymphoid cells (ILC3s). Unexpectedly, we identified potent upregulation of the immunoregulatory checkpoint molecule cytotoxic T-lymphocyte-associated antigen-4 (CTLA-4) on ILC3s. This pathway was activated by gut microbes and IL-23 in a FOXO1- and STAT3-dependent manner. Mice lacking CTLA-4 on ILC3s exhibited reduced regulatory T cells, elevated inflammatory T cells and more-severe intestinal inflammation. IL-23 induction of CTLA-4+ ILC3s was necessary and sufficient to reduce co-stimulatory molecules and increase PD-L1 bioavailability on intestinal myeloid cells. Finally, human ILC3s upregulated CTLA-4 in response to IL-23 or gut inflammation and correlated with immunoregulation in inflammatory bowel disease. These results reveal ILC3-intrinsic CTLA-4 as an essential checkpoint that restrains the pathological outcomes of IL-23, suggesting that disruption of these lymphocytes, which occurs in inflammatory bowel disease5-7, contributes to chronic inflammation.


Conflict of interest statement

The authors declare no competing interests.

Figures
Extended Data Fig. 1 |
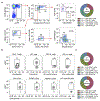
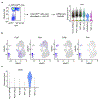
Extended Data Fig. 1 |. Single cell analysis of all IL-23R+ cells in small intestine of healthy mice.
a, Gating strategy and experimental design to sort IL-23R+ immune cells from small intestine lamina propria of IL-23R-eGFP mice for scRNA-seq. Violin plot confirming Il23r expression among all the identified IL-23R+ cell clusters. b, Feature plots showing expression of indicated genes in different clusters. c, Violin plot showing Mki67 expression among all identified IL-23R+ cell clusters.
Extended Data Fig. 2 |
Extended Data Fig. 2 |. Characterization of IL-23R+ immune cells in the intestine.
a, Flow cytometry plots with donut plot of final frequencies of different IL-23R+ immune cells in small intestine lamina propria of IL-23R-eGFP mice (n = 4 mice). Lineage 1, CD11b, CD11c, B220, CD3ε, CD5, CD8α, NK1.1 and TCRγδ. b, Flow cytometry plots showing eGFP expression (IL-23R) in different immune cells in small intestine lamina propria of IL-23R-eGFP mice (n = 4 mice). c, Donut plots of final frequencies of different IL-23R+ immune cells in large intestine lamina propria of naïve and C. rodentium infected IL-23R-eGFP mice at day 14 post infection (n = 4 mice). Data in a and c are representative of two or three independent experiments with similar results.
Extended Data Fig. 3 |
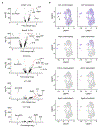
Extended Data Fig. 3 |. Acute IL-23 driven responses in IL-23R+ intestinal cells.
a, Volcano plots of differentially expressed genes in scRNA-seq dataset from IL-23R+ immune cells from the small intestine of IL-23R-eGFP mice before and after IL-23 stimulation in annotated cell types. b, UMAP plots of scRNA-seq data showing indicated gene expression in different clusters before and after IL-23 stimulation (1-NKp46+ ILC3s, 2-CCR6+ ILC3s, 3-DN ILC3s, 4-γδ T cells, 5-TH17 cells, 6-Proliferative cells). The statistics was obtained by the Wilcoxon test as implemented by Seurat; red dots are significantly different.
Extended Data Fig. 4 |
Extended Data Fig. 4 |. Flow cytometry gating for ILCs and CTLA-4.
a, Gating strategy for flow cytometry analysis of different immune cells in intestinal lamina propria of mice. Lineage 1, CD11b, CD11c, F4/80 and B220; lineage 2, CD3ε, CD5, CD8α and TCRγδ; Group 1 innate lymphoid cells (ILC1s) were identified as live CD45+ Lineage CD127+ CD90.2+ T-bet+ RORγ NK1.1+ Eomes; group 2 innate lymphoid cells (ILC2s) were identified as live CD45+ Lineage CD127+ CD90.2+ GATA3+; group 3 innate lymphoid cells (ILC3s) were identified as live CD45+ Lineage CD127+ CD90.2+ RORγ+; and subsets of ILC3s were further identified as CCR6+ T-bet ILC3s or CCR6 T-bet+ ILC3s. For T cell analysis Tregs were identified as CD45+CD4+FoxP3+ T cells and TH 17 as CD45+CD4+ RORγ+FoxP3 T cells. b, Representative flow cytometry plots of CTLA-4 staining in different immune cells from small intestine lamina propria of C57BL/6 mice (n = 4 mice). c, Flow cytometry plots of CTLA-4+ cells in small intestine lamina propria of Rag1−/− mice (n = 4 mice). Data in b and c are representative of two independent experiments with similar results.
Extended Data Fig. 5 |
Extended Data Fig. 5 |. Microbiota dependent regulation of CTLA-4.
a, Flow cytometry plots with graph of CTLA-4+ ILC1s and CTLA-4+ NK cells frequencies in large intestine lamina propria of conventional SPF, germ-free (GF) and SPF Rag1−/− mice treated with antibiotics (ABX) (n = 8 mice). b, Graph of CTLA-4+ ILC1s and CTLA-4+ NK cells frequencies in small intestine lamina propria of conventional SPF, germ-free and SPF mice treated with antibiotics on Rag1−/− background (n = 8 mice). c, Graph of CTLA-4+ ILC1s, CTLA-4+ NK cells and CTLA-4+ γδ T cells frequencies in small intestine lamina propria of SPF mice ex vivo stimulated with indicated cytokines (n = 4 mice). Data in a-b were pooled from two independent experiments and shown as Mean ± s.d.. Data in c are representative of two or three independent experiments with similar results and shown as Mean ± s.d.. The statistics in a-c were calculated by one-way ANOVA with Dunnett’s multiple comparisons.
Extended Data Fig. 6 |
Extended Data Fig. 6 |. Steady state analysis of Ncr1cre Ctla4f/f mice.
a, Flow cytometry plots of NKp46+ cells in large intestine lamina propria of naïve and C. rodentium infected C57BL/6 mice (n = 4 mice). Lineage 1, CD11b, CD11c and B220; lineage 2, CD3ε, CD5, CD8α, and TCRγδ. b, UMAP plot of scRNA-seq data of IL-23R+ immune cells from the small intestine of IL-23R-eGFP mice showing Ctla4 expression in different clusters. The large intestine of Ncr1cre Ctla4f/f and Ctla4f/f were analyzed at steady state and graph displaying the frequency of (c) ILC3s (percentage of Lin CD90+ CD127+) and (d) IL-22+ ILC3s (percentage of total ILC3s). e, Graph of TH17 cells frequency (percentage of CD4+ T cells). Flow plots with graph displaying the frequency of (f) Treg cells (percentage of CD4+ T cells) and (g) neutrophils gated as CD11b+Ly6G+ cells (percentage of CD45+ cells). Data in a,c,d,e,f and g are representative of two or three independent experiments with similar results (n = 5 mice) and shown as Mean ± s.d.. The statistics in c-g were determined by Mann–Whitney U-test (unpaired, two-tailed).
Extended Data Fig. 7 |
Extended Data Fig. 7 |. NK cells and ILC1s do not impact intestinal inflammation following enteric infection with C. rodentium.
C57BL/6 mice were orally infected with C. rodentium and treated with IgG or anti-IL-23 monoclonal antibody. a, Flow cytometry plots with graph displaying the frequency of CTLA-4 expression on ILC1s, NK cells and γδ T cells (n = 5 mice). C57BL/6 mice were orally infected with C. rodentium and treated with IgG or anti-NK1.1 monoclonal antibody. Mice were analyzed at day 14 post infection and graph displaying the (b) depletion efficiency of natural killer cells and ILC1s, and the frequency of (c) ILC3s (percentage of Lin CD90+ CD127+); (d) Treg cells (percentage of CD4+ T cells); (e) TH17 cells (percentage of CD4+ T cells); (f) Neutrophils gated as CD11b+Ly6G+ cells (percentage of CD45+ cells) in large intestinal lamina propria immune cells. Data in b-f are representative of two or three independent experiments with similar results (n = 4 mice) and shown as Mean ± s.d.. The statistics in a-f were determined by Mann–Whitney U-test (unpaired, two-tailed).
Extended Data Fig. 8 |
Extended Data Fig. 8 |. Innate immune responses are intact in mice lacking ILC3-specific CTLA-4.
Ncr1wt/wt and Ncr1cre/wt mice were orally infected with C. rodentium and at day 14 post infection large intestinal lamina propria immune cells were analyzed. a, Flow cytometry plots with graph of Tregs frequency (percentage of CD4+ T cells) and graph displaying the frequency of (b) TH17 cells (percentage of CD4+ T cells) and (c) neutrophils gated as CD11b+Ly6G+ cells (percentage of CD45+ cells) with (d) colon length. e, Flow cytometry plots and graph of CTLA-4+ ILC3s frequency (percentage of total ILC3s) in Rag1−/− Ctla4f/f and Rag1−/− RORγtcre Ctla4f/f mice. Rag1−/− Ctla4f/f and Rag1−/− RORγtcre Ctla4f/f mice were treated with 100 μg of anti-CD40 antibody, and graph displaying the frequency of (f) ILC3s (percentage of Lin CD90+ CD127+); (g) IL-22+ ILC3s (percentage of total ILC3s) and (h) neutrophils gated as CD11b+Ly6G+ cells (percentage of CD45+ cells) in the large intestines with (i) colon length at day 7 post treatment. Data in a-i are representative of two independent experiments with similar results (n = 4 mice) and shown as Mean ± s.d.. The statistics in a-i were determined by Mann–Whitney U-test (unpaired, two-tailed).
Extended Data Fig. 9 |
Extended Data Fig. 9 |. CTLA-4+ ILC3s reduce co-stimulatory molecules and enhance PD-L1 on myeloid cells in response to IL-23.
Sorted ILC3s and myeloid cells from the large intestine of C57BL/6 mice were co-cultured with recombinant IL-23 in presence or absence of indicated blocking antibodies. Flow cytometry plots with graph of MFI of (a) CD80 and (b) CD86 expression on myeloid cells gated as CD11c+ MHCIIhi. c, Flow cytometry plots with graph of free PD-L1 frequency on myeloid cells gated as CD11c+ MHCIIhi. d, Gating strategy to analyze T cells, myeloid cells and ILC3s in human samples. Data in a-c are representative of two independent experiments with similar results (n = 4 mice) and shown as Mean ± s.d.. The statistics were calculated by one-way ANOVA with Dunnett’s multiple comparisons.
Extended Data Fig. 10 |
Extended Data Fig. 10 |. ILC3s restrain IL-23 mediated inflammation through CTLA-4.
Here we define a pathway of immune regulation in the large intestine. This pathway is activated by gut microbes and IL-23 in a FOXO1- and STAT3-dependent manner. ILC3-intrinsic CTLA-4 shapes the levels of co-inhibitory and co-stimulatory molecules on intestinal myeloid cells to support Tregs and restrict T effector (Teff) cells. Consequently, ILC3-intrinsic CTLA-4 function as a checkpoint to restrain the pathologic functions of IL-23, suggesting that disruption of these lymphocytes, which occurs in IBD, contributes to chronic inflammation.
Figure 1 |
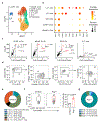
Figure 1 |. A single cell atlas of IL-23 responses in the small intestine identifies CTLA-4+ ILC3s.
a, UMAP plot of scRNA-seq data encompassing IL-23R+ immune cells from small intestine lamina propria of IL-23R-eGFP mice. DN, double-negative. b, Dot plots showing the mean expression of the indicated genes among different clusters. c, Volcano plots of differentially expressed genes in scRNA-seq dataset of IL-23R+ immune cells from small intestine lamina propria of IL-23R-eGFP mice before or after IL-23 stimulation. d, Flow cytometry plots and (e) donut plot with final frequencies of different CTLA-4+ cells in small intestine lamina propria of C57BL/6 mice (n = 4 mice). Lineage 1, CD11b, CD11c and B220; lineage 2, CD3ε, CD5, CD8α, and TCRγδ. f, Flow cytometry plots with graph displaying the frequency of CTLA-4+ ILC3s (percentage of total ILC3s) in small intestine lamina propria of C57BL/6 and Rag1−/− mice (n = 5 mice). g, Donut plot with final frequencies of different CTLA-4+ cells in small intestine lamina propria of Rag1−/− mice (n = 4 mice). Data in d-g are representative of two or three independent experiments with similar results, shown as mean ± s.d. The statistics in c were obtained by the Wilcoxon test as implemented by Seurat. The Statistic in f was calculated by Mann–Whitney U-test (unpaired, two-tailed).
Figure 2 |
Figure 2 |. Microbial exposure elicits IL-23 to upregulate CTLA-4 on ILC3s.
Flow cytometry plots with graph of CTLA-4+ ILC3 frequency (percentage of total ILC3s) in (a) large intestine and (b) small intestine lamina propria of SPF, germ-free (GF) and SPF Rag1−/− mice treated with antibiotics (ABX) (n = 8 mice). c, Flow cytometry plots and (d) graph of CTLA-4+ ILC3 frequency (percentage of total ILC3s) in small intestine lamina propria of SPF mice ex vivo stimulated with indicated cytokines (n = 4 mice). e, Fold change in CTLA-4 protein in different immune cells from lamina propria of SPF mice ex vivo cultured for 4 hours with IL-23 (n = 7 mice). f, Flow cytometry plots with graph of CTLA-4+ ILC3 frequency (percentage of total ILC3s) in small intestine lamina propria of Rag1−/− mice treated with IgG control or anti-IL-23 antibody (n = 5 mice). g, Flow cytometry plots of CTLA-4+ ILC3s (percentage of total ILC3s) in small intestine lamina propria of SPF mice cultured ex vivo in different conditions (n = 4 mice). Graphs showing frequency of CTLA-4+ ILC3s (percentage of total ILC3s) in large intestine lamina propria of (h) mice injected with or without IL-23 minicircle; (i) SPF mice co-housed (Co-H) with or without pet store mice; (j) C57BL/6 WT and Il10−/− mice; or (k) mice infected with C. rodentium treated with IgG control or anti-IL-23 antibody (n = 5 mice). Data in a,b and e were pooled from two independent experiments with similar results, shown as Mean ± s.d.. Data in c,d and f-k are representative of two independent experiments, shown as mean ± s.d. The statistics in a,b,d,e and g were calculated by one-way ANOVA with Dunnett’s multiple comparisons. The statistics in f and h-k were calculated by Mann–Whitney U-test (unpaired, two-tailed).
Figure 3 |
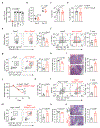
Figure 3 |. CTLA-4+ ILC3s restrains IL-23-dependent gut inflammation.
a, Percentage of CTLA-4+ immune cells (n = 5 mice). Mice were infected with C. rodentium, (b) fecal bacteria at indicated days post infection (dpi; n = 8 mice). Immune cells in large intestine at 14 dpi. Graph displaying frequency of (c) ILC3s (percentage of LinCD90+CD127+ cells) and (d) IL-22+ ILC3s (percentage of total ILC3s; n = 8 mice). e, Flow cytometry plots with graph of Treg frequency among CD4+ T cells (n = 8 mice). f, Flow cytometry plots with graph of IL-17A+IFNγ+ cell frequency among CD4+ T cells (n = 8 mice). g, Flow cytometry plots with graph of neutrophil frequency among CD45+ cells (n = 8 mice) with (h) colon lengths at 14 dpi (n = 5 mice). i, H&E staining and histopathology score of distal colon at 14 dpi (n = 5 mice). Scale bars, 50 μm. Naïve CD4+ T cells were transferred to recipient mice and analyzed 11 days later. j, Graph of weight loss (n = 5 mice). Immune cells in large intestine and (k) graph of TH17 cell frequency among CD4+ T cells (n = 5 mice). l, Flow cytometry plots with TNF+IFNγ+ cell frequency among CD4+ T cells (n = 5 mice). m, Flow cytometry plots with graph of neutrophil frequency among CD45+ cells (n = 5 mice) with (n) colon length (n = 5 mice). o, H&E staining and histopathology score of distal colon (n = 4 mice). Scale bars, 50 μm. Data in a,h, and i are representative of two independent experiments. Data in b-g and j-o were pooled from two independent experiments. All data shown as Mean ± s.d.. The statistics in a was calculated by one-way ANOVA with Dunnett’s multiple comparisons and in b-o by Mann–Whitney U-test (unpaired, two-tailed).
Figure 4 |
Figure 4 |. CTLA-4+ ILC3s regulate co-stimulatory and inhibitory checkpoints on myeloid cells in the gut.
a, Relative soluble (Sol) and membrane (Mem) Ctla4 transcripts in the sort-purified ILC3s stimulated with IL-23 (n = 4 mice). The dotted line represents fold change of 1. Mice were orally infected with C. rodentium, and myeloid cells in large intestine lamina propria were analyzed at 14 dpi. Flow cytometry plots with graph of MFI for (b) CD80 and (c) CD86 and (d) free-PD-L1 expression on myeloid cells gated as CD11c+ MHCIIhi (n = 5 mice). Naïve CD4+ T cells were adoptively transferred to recipient mice and myeloid cells in large intestine lamina propria were analyzed at day 11 post transfer. Flow cytometry plots with graph of MFI for (e) CD80 and (f) CD86 and (g) free-PD-L1 expression on myeloid cells gated as CD11c+ MHCIIhi (n = 5 mice). Sorted ILC3s and myeloid cells from the large intestine lamina propria of C57BL/6 mice were co-cultured with heat killed C. rodentium for 20 hours in different conditions. Flow cytometry plots with graph of MFI for (h) CD80 and (i) CD86 expression on myeloid cells gated as CD11c+ MHCIIhi (n = 4 mice). j, Graph of free PD-L1 frequency on myeloid cells gated as CD11c+ MHCIIhi (n = 4 mice). Data in a-j are representative of two or three independent experiments with similar results and shown as Mean ± s.d.. The statistics in a-j were obtained by Mann–Whitney U-test (unpaired, two-tailed).
Figure 5 |
Figure 5 |. IL-23 upregulates CTLA-4+ ILC3s in humans and this axis is altered in IBD.
a, Flow cytometry plots with graph of CTLA-4+ ILC3 frequency (percentage of total ILC3s) from human tonsils stimulated for 6 hours with or without recombinant human IL-23 (n = 6 human samples). b, Volcano plot of differentially expressed genes (DEGs) in bulk RNA-seq dataset of ILC3s sorted from the inflamed or normal adjacent intestinal tissue of IBD patients. Immune cells were isolated from intestinal biopsies of 20 healthy human controls or patients with Crohn’s disease (CD) and (c) flow cytometry plots with graph of CTLA-4+ ILC3 frequency gated as CD45+ Lin CD127+ RORγ+ cells (percentage of total ILC3s). d, Frequency of CTLA-4+ ILC3s (percentage of total ILC3s) were correlated with frequency of free PD-L1+ myeloid cells (percentage of total myeloid cells) gated as CD45+ CD11c+ MHCII+ cells (n = 20 non-IBD human controls; n = 20 human patients with CD). e, Frequency of free PD-L1+ myeloid cells (percentage of total myeloid cells) were correlated with Tregs frequency gated as CD45+ CD3+ CD4+ FOXP3+ of CD4+ T cells (n = 20 non-IBD human controls; n = 20 human patients with CD). f, Graph of ILC3 frequency gated as CD45+ Lin CD127+ RORγ+ cells relative to total CD45+ cells (n = 20 non-IBD human controls; n = 20 human patients with CD). The statistics in a, were calculated using Wilcoxon matched-pairs test (paired, two-tailed). The statistics in b were calculated using the Wald test within DESeq2. The statistics in c and f were calculated by Mann–Whitney U-test (unpaired, two-tailed). Correlative analyses in d and e were calculated by non-parametric Spearman correlation. Data in a are representative of two independent experiments, shown as mean ± s.d.

References

    1. Abraham C & Cho JH IL-23 and autoimmunity: new insights into the pathogenesis of inflammatory bowel disease. Annu Rev Med 60, 97–110 (2009). 10.1146/annurev.med.60.051407.123757 - DOI - PubMed
    1. Maloy KJ & Powrie F Intestinal homeostasis and its breakdown in inflammatory bowel disease. Nature 474, 298–306 (2011). 10.1038/nature10208 - DOI - PubMed
    1. Maynard CL, Elson CO, Hatton RD & Weaver CT Reciprocal interactions of the intestinal microbiota and immune system. Nature 489, 231–241 (2012). 10.1038/nature11551 - DOI - PMC - PubMed
    1. Fragoulis GE, Siebert S & McInnes IB Therapeutic Targeting of IL-17 and IL-23 Cytokines in Immune-Mediated Diseases. Annu Rev Med 67, 337–353 (2016). 10.1146/annurev-med-051914-021944 - DOI - PubMed
    1. Bernink JH et al. Human type 1 innate lymphoid cells accumulate in inflamed mucosal tissues. Nat Immunol 14, 221–229 (2013). 10.1038/ni.2534 - DOI - PubMed

MeSH terms