. 2024 Jun;630(8018):935-942.
doi: 10.1038/s41586-024-07538-2. Epub 2024 Jun 12.

Sleep loss diminishes hippocampal reactivation and replay

Affiliations

Sleep loss diminishes hippocampal reactivation and replay

Bapun Giri et al. Nature. 2024 Jun.

Abstract

Memories benefit from sleep1, and the reactivation and replay of waking experiences during hippocampal sharp-wave ripples (SWRs) are considered to be crucial for this process2. However, little is known about how these patterns are impacted by sleep loss. Here we recorded CA1 neuronal activity over 12 h in rats across maze exploration, sleep and sleep deprivation, followed by recovery sleep. We found that SWRs showed sustained or higher rates during sleep deprivation but with lower power and higher frequency ripples. Pyramidal cells exhibited sustained firing during sleep deprivation and reduced firing during sleep, yet their firing rates were comparable during SWRs regardless of sleep state. Despite the robust firing and abundance of SWRs during sleep deprivation, we found that the reactivation and replay of neuronal firing patterns was diminished during these periods and, in some cases, completely abolished compared to ad libitum sleep. Reactivation partially rebounded after recovery sleep but failed to reach the levels found in natural sleep. These results delineate the adverse consequences of sleep loss on hippocampal function at the network level and reveal a dissociation between the many SWRs elicited during sleep deprivation and the few reactivations and replays that occur during these events.


Conflict of interest statement

Competing Interests

The authors declare no competing interests.

Figures

Extended Data Figure 1:
Extended Data Figure 1:. Power spectra and delta for all recorded sessions.
Power spectral density of the CA1 local field potential (LFP), z-scored over 1–10 Hz for the time periods shown, with temporal evolution of delta (white) overlaid for each recorded session (similar to in Fig 1B). Hypnograms above each panel show the brain state (active wake (AW), quiet wake (QW), rapid-eye movement (REM) sleep, and non-REM sleep (NREM). State scoring was performed at 1-s resolution but for illustration purposes is provided averaged for 30-s periods (particularly due to rapid transitions between AW and QW during SD). Animal name initial, sex, and recording day are provided the left of the y-axes.
Extended Data Figure 2:
Extended Data Figure 2:. Ripple and delta features and controls across sleep and sleep deprivation sessions.
(A) Local field potential spectrogram (1–10 Hz) from a sample theta channel during recovery sleep (RS) from three rats with corresponding hypnogram indicating the scored sleep/wake state above (active wake (AW), quiet wake (QW), rapid eye movement (REM), and non-REM (NREM) sleep). The Fourier spectrogram was calculated from the whitened LFP traces using 4 s windows with 1 s overlap. Z-scored delta power (1–4 Hz, smoothed with a 12 s gaussian kernel) is overlaid in white. More detailed sleep scored sessions are available at https://github.com/diba-lab/sleep_loss_hippocampal_replay. (B) The proportion of time spent in each brain state across all sessions. Individual session values overlaid in connected dots. We note that during sleep deprivation from ZT 0–2.5 (SD1) to ZT 2.5–5 (SD2), there was no significant change in the proportion of time in QW (P = 0.958, t(df = 7) =− 0.054) or AW (P = 0.769, t(df = 7) = 0.305). (C) The rate of OFF states compared across sessions. For the non sleep-deprived (NSD) group, OFF states were most prevalent during NS1 (ZT 0–2.5) and decreased over time, in NS2 (ZT 2.5–5) and NS3 (ZT 5–7.5). The rate of OFF states was initially lower in the SD group, but increased from SD1 to SD2, with a further large increase upon RS. (D) The rate of ripple events calculated in 5 min windows decreased over the first 5 h of NSD but remained stable during 5 h of SD. (E) Ripple rate calculated separately for NREM and WAKE states (individual sessions overlaid with connected dots). A decrease in ripple rates is observed in both NREM and WAKE in the NSD group, but there was no change in WAKE ripples from SD1 to SD2, and a decrease from SD2 to RS. Overall, NREM ripple rates were higher in NS1 vs. RS and WAKE ripple rates were higher in SD2 vs. NS2. (F) The ripple probability (solid line = mean, shaded region = s.e.m., n = 8) was modulated by delta waves. (G) However, the modulation depth of ripples by delta ((peak-trough/mean) was not significantly different across 2.5 h blocks. (H) OFF states were frequently preceded and followed by ripples. Modulation of OFF states by ripples did not change across NSD but the probability that OFF immediately followed a ripple increased over SD, from SD1 to SD2 and further in RS, with a significant difference between RS and NS1. The inducement of OFF states by ripples is similar to the rise in OFF states following bursts induced by sensory stimulation in the cortex. (I) Interventions needed to stop transitions to sleep during SD were tracked using piezo sensors on the sides of the home cage in 3 sessions. The number of interventions grew with time during SD. (J) Mean and 95% confidence intervals of ripple rate (left) and delta wave rate (right) relative to the onset of interventions. The rate of delta waves and concurrent ripples was higher immediately preceding interventions, consistent with signs of sleepiness that compel such interventions. (K) Ripple features (frequency, sharp wave amplitude, and ripple power) evaluated separately in NREM (n = 67007 ripples from 6 NSD sessions, n = 26798 ripples from 7 SD sessions) and WAKE states (n = 74363 ripples from 6 NSD sessions and 128957 ripples from 7 SD sessions). Rightmost panels in each row provide cross-group comparisons in NS1 vs. RS strictly during NREM and NS2 vs. SD2 strictly during WAKE. These results are largely consistent with patterns in Fig. 1G–I, except that here ripple power in NS2 vs. SD2 is not significantly different during WAKE, indicating state-dependence of this effect. Additionally, we note a significant increase in ripple frequency in WAKE from PRE to POST in both NSD and SD groups, indicating an effect of the novel maze exposure. All box plots show the median and top/bottom quartiles (whiskers = 1.5 × interquartile range) of the hierarchically bootstrapped data with individual session means overlaid with connecting dots. Statistics: panels C, E, G, two-sided paired t-tests (within group) and one-sided independent groups (across groups) t-tests; panel D, Pearson correlation coefficients with two-sided p-value; panel H, χ2 tests of independence; panel K, two-sided paired within group and one-sided cross-group comparisons with hierarchical bootstrapping; ns (not significant), *P < 0.05, **P < 0.01, ***P < 0.001, with no correction for multiple comparisons. See Supplementary Statistics Table for additional details.
Extended Data Figure 3:
Extended Data Figure 3:. Firing rate changes within each state separately
Mean firing rates calculated solely within the awake (WAKE) state (A) or solely within NREM (B) with individual sessions overlaid and connected. Differences calculated separately within wake or NREM were less pronounced than those shown in Fig. 2 B, C, consistent with the noted effect of background state on hippocampal firing rates,. However, when estimating the metabolic cost of neuronal firing, comparisons that overlook the state and consider temporal variations in rates, such as those depicted in Figures 2B and C, are most appropriate. In WAKE (A), firing rates showed a trend towards decreased rates in pyramidal cells (top row) in the NSD group (n = 442 neurons from 8 sessions) but not in SD (n = 312 neurons from 8 sessions). The decrease in firing rates during brief wakings with the recovery sleep period (right panel) likewise showed a trend towards significance vs. a similar period in NSD. Interneuron firing rates (bottom row) within WAKE in recovery sleep showed a trend towards significance in comparison to the similar period in NSD (n = 48 cells from 8 NSD sessions and n = 48 cells from 8 SD sessions). In NREM (B) no significant differences were detected across groups or periods. (C) and (D) Same as (A) and (B) but for active wake (AW) and quiet wake (QW). (E) Firing rate distribution for all pyramidal cells recorded during SD sessions for AW vs. QW. Firing rates in both WAKE states remain skewed from log-normal distribution throughout SD. (F) Interquartile range (IQR) of the log firing rate of pyramidal cells reveals a trend toward a broader range of firing rates in AW vs. QW during SD. All box plots depict the median and top/bottom quartiles (whiskers = 1.5 × interquartile range) of the hierarchically bootstrapped data with individual session means overlaid with connecting dots. Statistics: A-D, F: two-sided paired within group and one-sided cross-group comparisons with hierarchical bootstrapping; E: Shapiro-Wilk tests performed on each bootstrapped log distribution, with P obtained from the proportion of bootstraps with significant skew; ns (not significant), #P < 0.1, *P < 0.05, **P < 0.01, ***P < 0.001, with no correction for multiple comparisons. See Supplementary Statistics Table for additional details.
Extended Data Figure 4:
Extended Data Figure 4:. Temporal evolution of reactivation across recorded sessions.
Reactivation assessed using the explained variance (EV) metric (NSD (black), SD (red), and RS (blue)), in thirteen sessions from six different animals (3 male and 3 female, with 3 sessions from 2 animals (1 male, 1 female) excluded due to an insufficient number of stable neurons), as in Fig. 3A. Chance level (REV) is shown in maize. Solid lines show the mean and shaded regions show the standard deviation of EV/REV across all 15 min windows in POST. Each row provides session(s) from one animal, with number of putative pyramidal neurons and cell pairs used to calculate EV specified inside each panel. Hypnograms above panels depict sleep/wake history in active wake (AW), quiet wake (QW), rapid eye movement (REM) sleep and non-REM (NREM) sleep, with sleep deprivation/recovery sleep in red/blue and natural sleep in black. Animals’ tracked positions on the novel maze (purple) are depicted on the right of the panels along with the session recording day. See Supplementary Statistics Table for additional details.
Extended Data Figure 5:
Extended Data Figure 5:. Accounting for the variability in reactivation during sleep deprivation
We observed striking variability in reactivation across animals during the first block of sleep deprivation (SD1) in ZT0–2.5 (Fig. 3 and Extended Data Fig. 4). We conducted a series of analyses in an effort to account for this observation. Differences in (A) the distance run or (B) the total time spent running on the maze, did not account for the variance in EV during SD1. (C) Likewise, the variance in EV during SD1 cannot be attributed to differences in the proportion of time in active wake (left) or quiet wake (right) states during this period. (D) We next tested whether the rate of delta waves during sleep deprivation (top row), an indicator of sleep pressure, could explain the variance in EV during SD1. Remarkably, there was a strong significant negative correlation (P = 0.006) between the rate of delta from ZT 2.5–5 (SD2) and the reactivation (EV) during SD1. If delta during SD2 thus relates to animal’s level sleepiness, consistent with the sleep homeostasis model,, the level of sleepiness correlates with the amount of hippocampal reactivation we observe during SD1. In contrast, we observed no correlation between EV and delta at any timepoint for NSD (bottom row) (E) A similar relationship was not evident between delta waves and EV in NS2. (F) Reactivation (EV) during SD1 was not predictive of the reactivation during RS. Statistics: All panels, Pearson correlation coefficients with two-sided P-values, **P < 0.01, with no correction for multiple comparisons. See Supplementary Statistics Table for additional details.
Extended Data Figure 6:
Extended Data Figure 6:. Comparisons across 1-hour blocks
Changes in ripple properties, firing rates, explained variance, and replays were assessed using 1-h blocks, based on the last hour of PRE, 1-h periods immediately after MAZE (ZT 0–1) and 1-h blocks immediately before and after recovery sleep (ZT 4–5 and ZT 5–6). All box plots depict the median and top/bottom quartiles (whiskers = 1.5 × interquartile range) of the hierarchically bootstrapped data with individual session means overlaid with connecting dots. Similar to our results for 2.5 h blocks in the main text, (A) ripple frequency (left) decreased over NSD (n = 143681 ripples total from 8 sessions) but increased in SD (n = 157964 ripples total from 8 sessions) relative to MAZE, with a rebound drop in RS (ZT 5–6). Rightmost panel highlights cross-group comparisons for the first block of sleep (NS1 vs. RS) and second block of SD vs. NSD. In both groups, sharp-wave amplitudes (middle) and ripple power (right) increased from MAZE to the first block of POST (ZT 0–1). Sharp-wave amplitude (middle) and ripple power (right) further increased in RS. Cross-group comparisons at ZT 4–5 showed increased ripple power in NSD compared to SD. (B) Firing rate of pyramidal neurons show decreasing firing rates during sleep but not during SD (n = 442 pyramidal neurons / 48 interneurons from 8 sessions NSD, 312 pyramidal neurons / 48 interneurons from 8 sessions SD). (C) EV was significantly lower in SD at ZT4–5 compared to NSD, with a modest but significant rebound during RS, but to lower levels than during the first hour of natural sleep. n = 20544 cell-pairs from 6 NSD sessions and n = 8114 cell-pairs from 7 SD sessions. (D) (left). The proportion of candidate ripple events that decoded continuous trajectories in different epochs (n = 65744 candidate events from 7 SD sessions and n = 56669 candidate events from 6 NSD sessions). SD sessions featured significantly fewer trajectory replays by ZT4–5. Critically, the proportion of replays in RS was significantly lower than in NS1. Similar results were observed for replay number (middle). A significant decrease was observed in mean replay event duration (right) for SD (n = 13911 replays from 7 sessions) from ZT0–1 to ZT4–5. Statistics: two-sided within-group comparisons and one-sided cross-group comparisons with hierarchical bootstrap, #P < 0.1, *P < 0.05, **P < 0.01, ***P < 0.001, with no correction for multiple comparisons. See Supplementary Statistics Table for additional details.
Extended Data Figure 7:
Extended Data Figure 7:. Replay characterization during NREM and WAKE.
(A) Replays showed no bias in directionality. (B) The total number of candidate events decreased during POST in non sleep-deprivation (NSD, n = 64205 candidate events from 6 sessions) but remained elevated during sleep deprivation (SD, n = 72584 candidate events from 7 sessions) from the first to second block (SD1 to SD2), but dropping from SD2 to recovery sleep (RS). (C) The proportion of candidate events that scored as trajectory replays in NSD and SD groups, measured separately in WAKE (n = 30852 events from 6 NSD sessions and n = 59820 events from 7 SD sessions) and NREM (n = 32258 events from 6 NSD sessions and 11903 events from 7 SD sessions) states in each block. The rightmost panel provides comparisons between the first block of extended NREM sleep for each group (ZT 0–2.5 in the NSD group vs. ZT 5–7.5 in the SD group) and between WAKE during the second (late) block of POST (ZT 2.5–5 for both groups). There was a significantly lower proportion of trajectory replays in NREM recovery sleep (RS) compared to nature sleep (NS1) and fewer in WAKE SD2 vs. NS2, demonstrating that these results were significant when assessed within states as well as when compared across time blocks that involved pooled states as in Fig 4). Note also that there was a significant increase in the proportion of trajectory replays during NREM from PRE to POST, consistent with previous studies indicating increased replay following novel MAZE exposure,. (D) Same as (C) but for the total number of trajectory replay events. Interestingly, the total number of trajectory replays decreased within WAKE in the NSD group, but did not change within SD, resulting in a greater total number of trajectory replays in SD2 compared to NS2. Importantly, however, there were significantly fewer trajectory replays in NREM RS vs. NS1. (E) Same as (C) but for duration of trajectory replay events (NREM: n = 8291 replays from 6 NSD sessions, n = 1869 replays from 7 SD sessions; WAKE: n = 9128 replays from 6 NSD sessions, n = 12940 replays from 7 NSD sessions). Note the decreased duration of these events during waking in SD2 vs. SD1. All box plots depict the median and top/bottom quartiles (whiskers = 1.5 × interquartile range) of the hierarchically bootstrapped data with individual session means overlaid with connecting dots. Statistics: Panel A: two-tailed, paired t-tests for within group comparisons and one-tailed Welch’s t-tests for cross-group comparisons; Panels B-E, two-sided within-group comparisons and one-sided cross-group comparisons with hierarchical bootstrap, #P < 0.01, *P < 0.05, **P < 0.01, ***P < 0.001, with no correction for multiple comparisons. See Supplementary Statistics Table for additional details.
Figure 1:
Figure 1:. Sleep deprivation yields more sharp-wave ripples but with weaker power and higher frequency ripples.
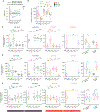
(A) After PRE, animals were introduced to MAZE then allowed either undisturbed sleep (NS1-NS2), or 5 h sleep deprivation (SD1-SD2) followed by recovery sleep (RS). (B) Power spectral density in sample NSD (left) and SD (right) sessions with hypnogram (top) indicating brain state (active wake (AW), quiet wake (QW), rapid eye movement (REM), and non-REM (NREM) sleep) and spectrogram (bottom; z-scored over all frequencies for the time periods shown) of CA1 local field potential (LFP). (C) Average power spectral densities across all NSD & SD/RS sessions (black & red/blue with corresponding s.e.m. shaded). (D) The rate of delta waves is lower during SD vs. sleep but increases from SD1 to SD2 and RS (individual sessions superimposed with connected dots). (E) Sample sleep (left) with a high spontaneous rate of sharp-wave ripples (SWRs) with LFPs (2 shanks in black) and unit rasters (arbitrary color and sorting). The rate of SWRs (right) decreases with sleep but remains elevated during SD. (F) Power spectral densities in the ripple frequency band for the sessions in (B) with moving average ripple frequency (black). Sample SWRs (16-channel traces, white) at different time points (arrow heads). (G) Box plots showing population median and top/bottom quartiles (whiskers = 1.5 interquartile range), estimated using hierarchical bootstrapping, indicate higher frequency ripples in SD (n = 157964 ripples total from 8 sessions) vs. NSD (n = 143681 ripples total from 8 sessions), with a rebound in RS. Session means overlaid as connected dots. Rightmost panel highlights cross-group comparisons for the first block of sleep in each group (NS1 vs. RS) and the second block of SD vs. NSD. (H, I) Same as (G) for sharp-wave amplitude (H) and ripple band power (I). Statistics: All panels: two-sided within-group comparisons and one-sided cross-group comparisons; Panels D and E: t-tests; Panels G-I, comparisons of bootstrapped means; ns (not significant), #P <0.10, *P < 0.05, **P < 0.01, ***P < 0.001, with no corrections for multiple comparisons. See Supplementary Statistics Table for additional details.
Figure 2:
Figure 2:. Hippocampal firing-rates are elevated and are more dispersed during sleep deprivation.
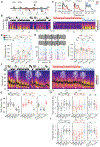
(A) Example sessions from non-sleep deprivation (NSD, top) and sleep deprivation (SD, bottom) with recovery sleep (RS), showing firing rates of pyramidal units (5 min bins, units sorted by mean) and hypnograms (top; active wake (AW), quiet wake (QW), rapid eye movement (REM), and non-REM (NREM) sleep) during POST. Mean firing rate (right axis) superimposed (white, this session; black, across all sessions). (B) Pyramidal neurons (PNs) during NSD (black, left; n = 442 cells from 8 sessions) and SD/RS (red/blue, right; n = 312 cells from 8 sessions) in (PRE, MAZE, ZT 0–2.5, ZT 2.5–5, and ZT 5–7.5) show decreasing firing during sleep but elevated firing during SD. Individual session means superimposed (connected dots). (C) Same as (B) but for interneurons (IN, n = 48 cells from 8 NSD sessions and n = 48 cells from 8 SD sessions). (D) The full distribution of PN firing rates deviates from log-normal during SD1 and SD2 but not NS1 or NS2. (E) Log firing rate interquartile range shows greater variance for PNs in SD vs. NSD. (F) PN firing rates specifically within ripples decreased over sleep and remained stable during SD but with minimal cross-group differences. (G) IN firing during ripples decreased over sleep, but remained elevated during SD then dropped in RS, with significant differences between NS1 and RS. All box plots depict median and top/bottom quartiles (whiskers = 1.5 × interquartile range) of the hierarchically bootstrapped (HB) data. Statistics: Panels B, C, E, F, G: two-sided within-group comparisons and one-sided cross-group comparisons of HB means; Panel D: Shapiro-Wilk tests performed on each HB log distribution, with P obtained from the proportion with significant skew; one-sided cross-group comparisons performed on the HB Shapiro-Wilk test statistics; ns (not significant), #P < 0.10, *P < 0.05, **P < 0.01, ***P < 0.001, with no corrections for multiple comparisons. See Supplementary Statistics Table for additional details.
Figure 3:
Figure 3:. Reactivation attenuates during sleep deprivation and fails to be restored by recovery sleep.
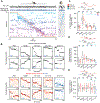
(A) Explained variance (EV) of pairwise reactivation (NSD, black; SD, red) and its chance levels (REV, maize) during POST in ad-lib sleep (NSD; left column) and sleep deprivation (SD) with recovery sleep (RS; right column) sessions from 4 animals (sex on y-axis; hypnogram on top (active wake (AW), quiet wake (QW), rapid eye movement (REM), and non-REM (NREM) sleep); additional sessions in Extended Data Fig 4). Solid line shows mean EV/REV, and shaded regions indicate low standard deviations. NSD sessions featured robust reactivation lasting for hours while SD sessions showed either some (rats S and V) or little reactivation (rats N and U). (B) Proportion of time spent in WAKE during NSD/SD (top left) and in NREM during NS1/RS (top left). Calculated exclusively during WAKE (bottom left), mean EV (mean/s.d. shown in solid line/shading) shows a similar decrease in both NSD (n = 20544 cell-pairs from 6 sessions) and SD (n = 8114 cell-pairs from 7 sessions but calculated exclusively during NREM, bottom right), there is lower reactivation in RS compared to NSD. (C) The decay constant obtained from exponential fits to EV curves separated by brain state (individual sessions overlaid with connected dots, except when out of range). In NSD, EV decays more slowly during NREM vs. WAKE. Interestingly, WAKE EV decays more slowly in SD compared to NSD, but trends towards faster decay than during NSD NREM. (D) EV plots indicate lower reactivation during SD vs. NSD, with a rebound during RS to lower levels than in ad-lib sleep. All box plots depict median and top/bottom quartiles (whiskers = 1.5 × interquartile range) of hierarchically bootstrapped data. Statistics: two-sided within-group comparisons and one-sided cross-group comparisons of bootstrapped means, #P < 0.1, *P < 0.05, **P < 0.01, ***P < 0.001, with no corrections for multiple comparisons. See Supplementary Statistics Table for additional details.
Figure 4:
Figure 4:. Trajectory replays deteriorate over sleep deprivation and recovery sleep.
(A) Hippocampal spike raster (arbitrary colors ordered by place-field location) and raw (black) and ripple-filtered (blue) local field (LFP) during a sample run (normalized track position overlaid in orange). Gray box (right) displays a sample sleep replay. (B) Sample trajectory replays from ad-lib sleep (NSD) and sleep deprivation (SD) from top 10 percentile of distance covered and lowest 10 percentile of mean jump distance (blue inset, normalized distance) in each epoch. Replays were observed in all epochs but became progressively shorter, particularly in SD, with fewer events meeting the replay criteria. (C) Fewer events qualified as replays by the second block of SD (out of n = 72584 candidate events from 7 sessions) and in recovery sleep (RS) compared to NSD (out of n = 64205 candidate events from 6 sessions). Critically, the proportion of replays in RS was significantly lower than in the equivalent period from ad-lib sleep (NS1). (D) Similar to (C) but for the rate of replays. Fewer replays were seen in the first block of SD compared to NSD and crucially, there were fewer replays in RS vs. NS1. (E) The durations of trajectory replays were significantly reduced from the first to second block of SD (n = 15005 replays from 7 sessions) but not NSD (n = 17742 replays from 6 sessions), with a further decrease upon RS. All box plots depict median and top/bottom quartiles (whiskers = 1.5 × interquartile range) of the hierarchically bootstrapped data with individual session means overlaid and connected. Statistics: two-sided within-group comparisons and one-sided cross-group comparisons of bootstrapped means, ns (not significant), #P < 0.1, *P < 0.05, **P < 0.01, ***P < 0.001, with no corrections for multiple comparisons. See Supplementary Statistics Table for additional details.

Update of

References

    1. Rasch B & Born J About sleep’s role in memory. Physiol Rev 93, 681–766 (2013). - PMC - PubMed
    1. Buzsaki G Hippocampal sharp wave-ripple: A cognitive biomarker for episodic memory and planning. Hippocampus 25, 1073–1188 (2015). - PMC - PubMed
    1. Havekes R & Abel T The tired hippocampus: the molecular impact of sleep deprivation on hippocampal function. Curr Opin Neurobiol 44, 13–19 (2017). - PMC - PubMed
    1. Eschenko O, Ramadan W, Molle M, Born J & Sara SJ Sustained increase in hippocampal sharp-wave ripple activity during slow-wave sleep after learning. Learn Mem 15, 222–228 (2008). - PMC - PubMed
    1. Girardeau G, Benchenane K, Wiener SI, Buzsaki G & Zugaro MB Selective suppression of hippocampal ripples impairs spatial memory. Nat Neurosci 12, 1222–1223 (2009). - PubMed

LinkOut - more resources