. 2024 Jul;631(8019):125-133.
doi: 10.1038/s41586-024-07546-2. Epub 2024 Jun 12.

Ancient Plasmodium genomes shed light on the history of human malaria

Megan Michel  1   2   3 Eirini Skourtanioti  4   5 Federica Pierini  4 Evelyn K Guevara  4   6 Angela Mötsch  4   5 Arthur Kocher  4   7 Rodrigo Barquera  4 Raffaela A Bianco  4   5 Selina Carlhoff  4 Lorenza Coppola Bove  4   5   8 Suzanne Freilich  4   9 Karen Giffin  4   10 Taylor Hermes  4   11 Alina Hiß  4 Florian Knolle  12 Elizabeth A Nelson  13 Gunnar U Neumann  4   5 Luka Papac  4 Sandra Penske  4 Adam B Rohrlach  4   14   15 Nada Salem  4   5 Lena Semerau  4 Vanessa Villalba-Mouco  4   5   16 Isabelle Abadie  17   18 Mark Aldenderfer  19 Jessica F Beckett  20 Matthew Brown  21 Franco G R Campus  22 Tsang Chenghwa  23 María Cruz Berrocal  24 Ladislav Damašek  25 Kellie Sara Duffett Carlson  26 Raphaël Durand  27   28 Michal Ernée  29 Cristinel Fântăneanu  30 Hannah Frenzel  31 Gabriel García Atiénzar  32 Sonia Guillén  33 Ellen Hsieh  23 Maciej Karwowski  34 David Kelvin  35 Nikki Kelvin  36 Alexander Khokhlov  37 Rebecca L Kinaston  38   39 Arkadii Korolev  37 Kim-Louise Krettek  40 Mario Küßner  41 Luca Lai  42 Cory Look  21 Kerttu Majander  43 Kirsten Mandl  9 Vittorio Mazzarello  44 Michael McCormick  5   45 Patxuka de Miguel Ibáñez  32   46   47 Reg Murphy  48 Rita E Németh  49 Kerkko Nordqvist  50 Friederike Novotny  51 Martin Obenaus  52 Lauro Olmo-Enciso  53 Päivi Onkamo  54 Jörg Orschiedt  55   56 Valerii Patrushev  57 Sanni Peltola  4   58 Alejandro Romero  32   59 Salvatore Rubino  44 Antti Sajantila  6   60 Domingo C Salazar-García  61   62 Elena Serrano  63   64 Shapulat Shaydullaev  65 Emanuela Sias  66 Mario Šlaus  67 Ladislav Stančo  25 Treena Swanston  68 Maria Teschler-Nicola  9   51 Frederique Valentin  69 Katrien Van de Vijver  70   71   72 Tamara L Varney  73 Alfonso Vigil-Escalera Guirado  74 Christopher K Waters  75 Estella Weiss-Krejci  76   77   78 Eduard Winter  51 Thiseas C Lamnidis  4 Kay Prüfer  4 Kathrin Nägele  4 Maria Spyrou  4   79 Stephan Schiffels  4 Philipp W Stockhammer  4   5   80 Wolfgang Haak  4 Cosimo Posth  4   40   79 Christina Warinner  4   5   81 Kirsten I Bos  4 Alexander Herbig  82 Johannes Krause  83   84
Affiliations

Ancient Plasmodium genomes shed light on the history of human malaria

Megan Michel et al. Nature. 2024 Jul.

Abstract

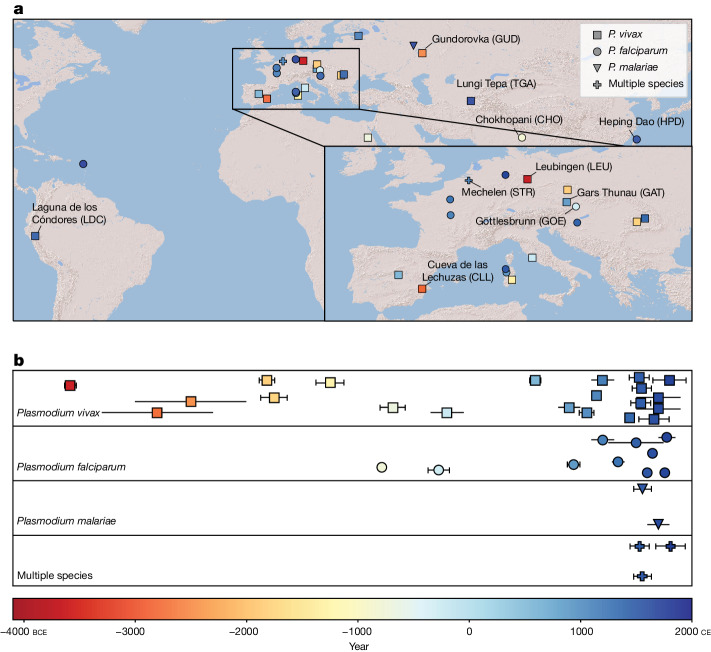
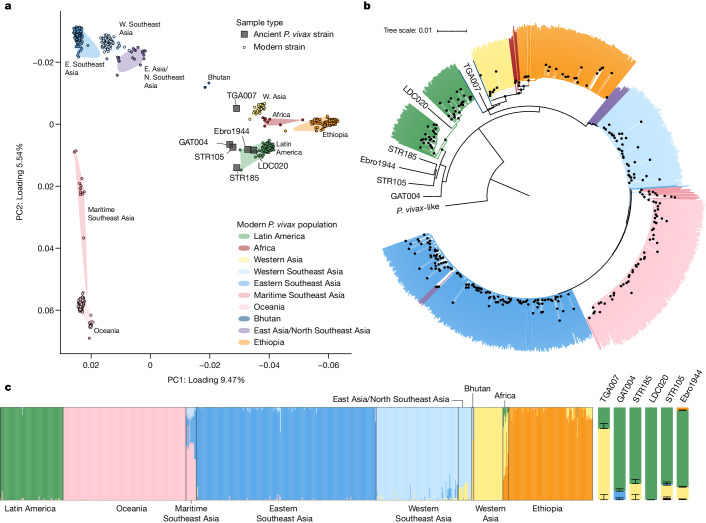
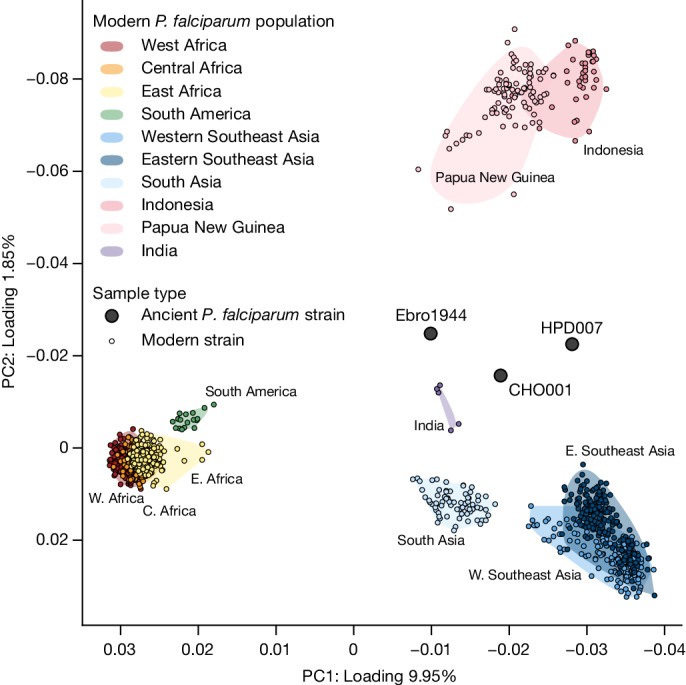
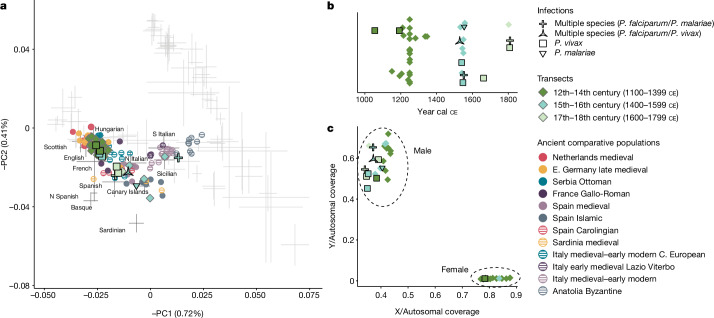
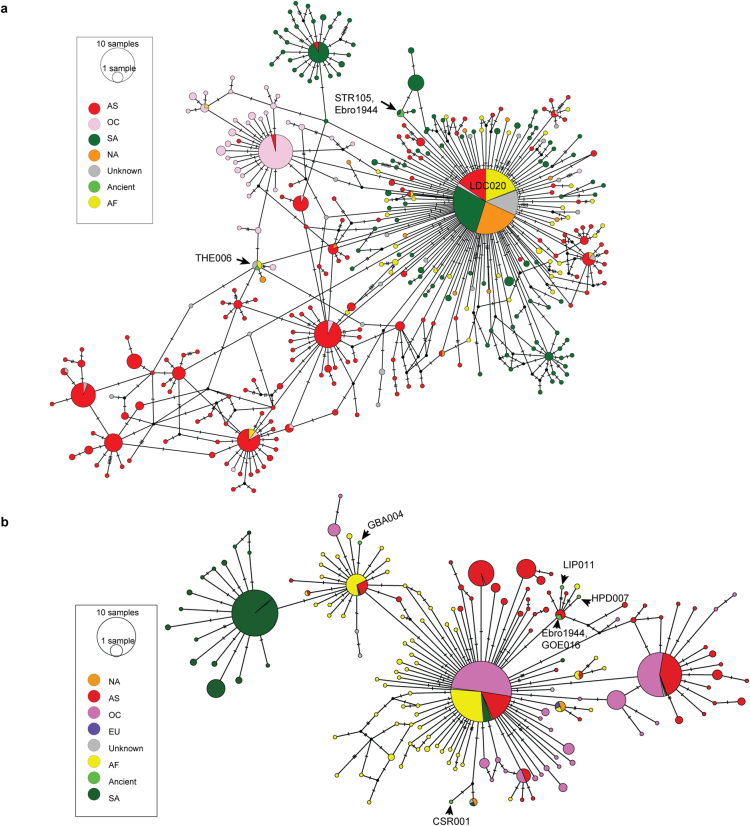
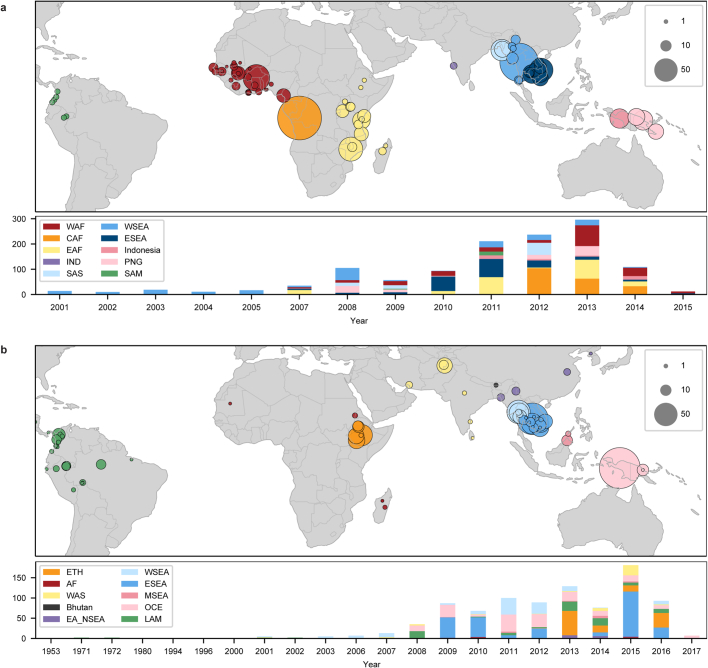
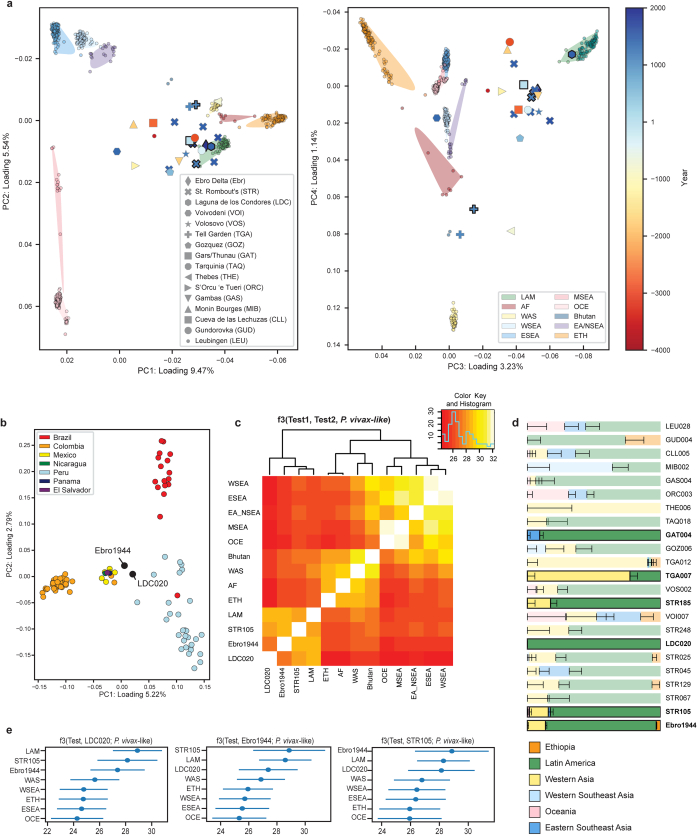
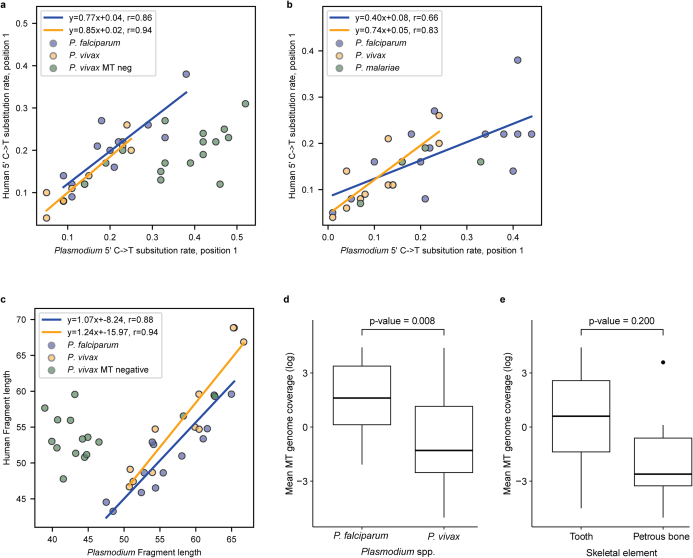
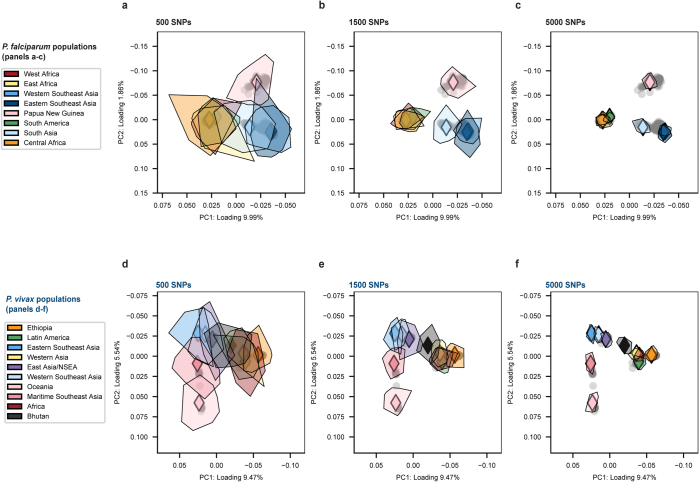
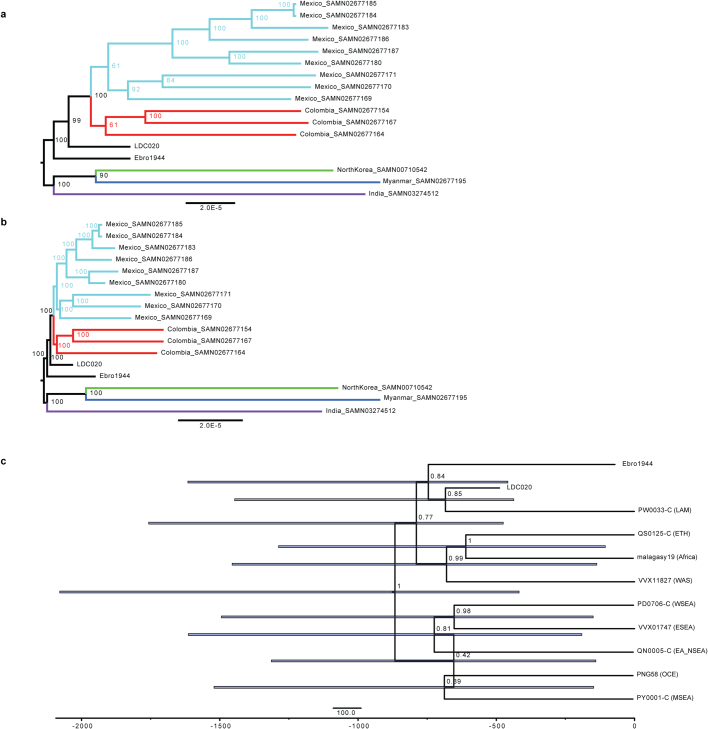
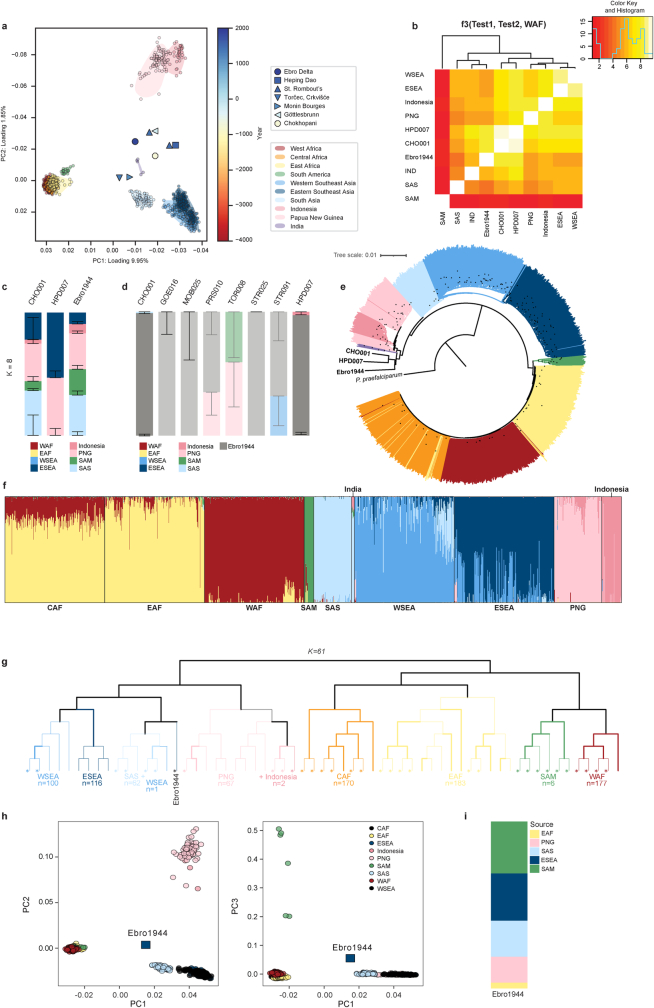
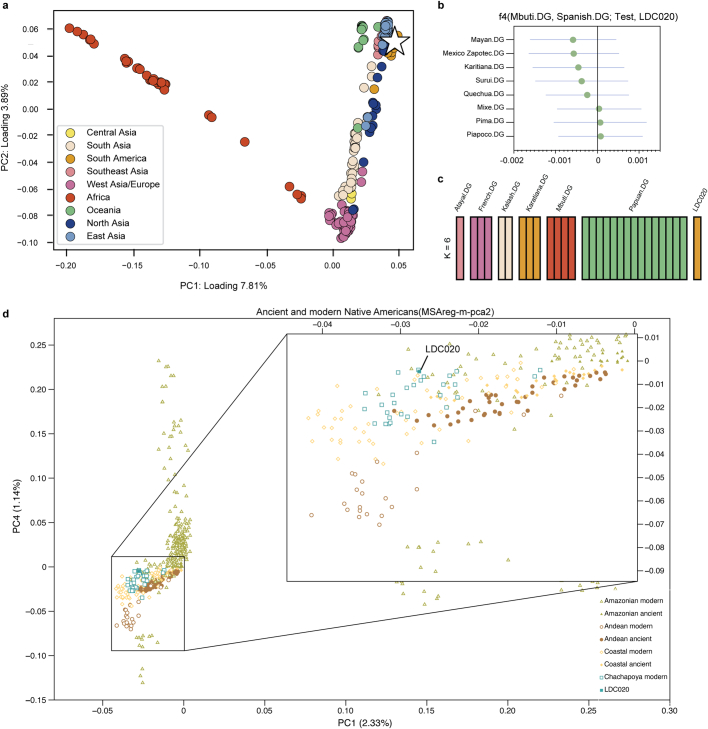
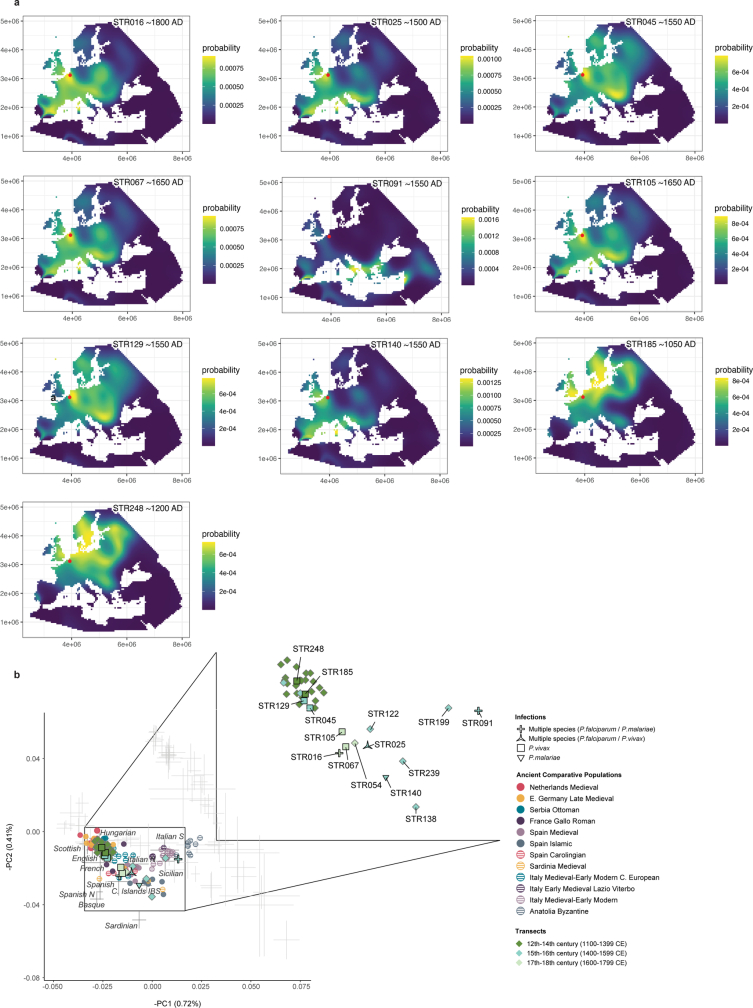
Malaria-causing protozoa of the genus Plasmodium have exerted one of the strongest selective pressures on the human genome, and resistance alleles provide biomolecular footprints that outline the historical reach of these species1. Nevertheless, debate persists over when and how malaria parasites emerged as human pathogens and spread around the globe1,2. To address these questions, we generated high-coverage ancient mitochondrial and nuclear genome-wide data from P. falciparum, P. vivax and P. malariae from 16 countries spanning around 5,500 years of human history. We identified P. vivax and P. falciparum across geographically disparate regions of Eurasia from as early as the fourth and first millennia BCE, respectively; for P. vivax, this evidence pre-dates textual references by several millennia3. Genomic analysis supports distinct disease histories for P. falciparum and P. vivax in the Americas: similarities between now-eliminated European and peri-contact South American strains indicate that European colonizers were the source of American P. vivax, whereas the trans-Atlantic slave trade probably introduced P. falciparum into the Americas. Our data underscore the role of cross-cultural contacts in the dissemination of malaria, laying the biomolecular foundation for future palaeo-epidemiological research into the impact of Plasmodium parasites on human history. Finally, our unexpected discovery of P. falciparum in the high-altitude Himalayas provides a rare case study in which individual mobility can be inferred from infection status, adding to our knowledge of cross-cultural connectivity in the region nearly three millennia ago.


Conflict of interest statement

The authors declare no competing interests.

Figures

Fig. 1
Fig. 1. Spatial and temporal distribution of Plasmodium-positive ancient individuals.
a, Archaeological sites with malaria-positive ancient individuals. Site colour reflects the date-range midpoint for the infected individual(s). Names and abbreviations are included for sites discussed in the main text. Map produced using Cartopy (v.0.20.3, https://github.com/SciTools/cartopy/tree/v0.20.3), Natural Earth (naturalearthdata.com) and World Shaded Relief map (Esri). b, Temporal distribution of n = 36 malaria-positive ancient individuals. Points reflect date-range midpoints; error bars indicate uncertainty inferred from either archaeological context (uncapped error bars) or radiocarbon dating (capped error bars, calibrated calendar ages, 2σ range) (Supplementary Table 1).
Fig. 2
Fig. 2. P. vivax population genetics.
a, Ancient P. vivax strains with more than 5,000 SNPs covered (grey squares). Ancient data are projected onto modern P. vivax strains (small points) genotyped by the MalariaGEN P. vivax Genome Variation Project. Shaded regions delimit the spread of modern P. vivax populations in PCA space. b, Neighbour-joining phylogeny including ancient and modern P. vivax strains. Branches are coloured by geographic origin, as in a, black points reflect nodes receiving support values greater than or equal to 0.9 (100 bootstrap replicates). c, Unsupervised ADMIXTURE analysis of modern P. vivax populations using K = 6 ancestry sources (left), and supervised ADMIXTURE analysis of high-coverage (more than 5,000 SNPs) ancient P. vivax strains (right). Ancient strains were modelled as mixtures of K = 6 ancestral sources maximized in the following modern populations: Latin America, Oceania, maritime Southeast Asia, eastern Southeast Asia, western Southeast Asia, western Asia and Ethiopia. Error bars reflect uncertainty in mean individual admixture proportions (standard errors, 300 bootstrap replicates).
Fig. 3
Fig. 3. P. falciparum PCA.
Ancient P. falciparum strains with more than 10,000 SNPs covered (labelled circles). Ancient strains are projected onto the diversity of modern P. falciparum genomes published by the MalariaGEN P. falciparum Community Project. Modern strains are shown as small points, and the shaded regions delimit the distribution of modern P. falciparum populations in PCA space.
Fig. 4
Fig. 4. Shift in human ancestry and malaria infectivity at Mechelen, Belgium.
a, PCA showing both infected and uninfected ancient individuals projected onto the diversity of modern Western Eurasian populations. Marker type indicates infection status and colouration reflects the temporal layer of ancient individuals. Selected ancient populations are shown as coloured circles for comparative purposes. b, Chronology of individuals yielding human and/or Plasmodium genome-wide data. Individuals are classified as deriving from the twelfth-to-fourteenth centuries ce, the fifteenth-to-sixteenth centuries or the seventeenth-to-eighteenth centuries on the basis of their calibrated radiocarbon dates or available archaeological context. c, Relative coverage on the X and Y chromosomes used for sex determination.
Extended Data Fig. 1
Extended Data Fig. 1. P. falciparum and P. vivax mitochondrial networks.
a. Median-joining network showing relatedness between modern P. vivax mitochondrial haplotypes and ancient P. vivax strains. b. Median-joining network showing relatedness between modern P. falciparum mitochondrial haplotypes and ancient P. falciparum strains. In both a and b, circles represent haplotypes with size proportional to the number of sampled strains. Hatch marks indicate the number of mutational steps separating haplotypes, while color reflects the geographic origin of modern strains.
Extended Data Fig. 2
Extended Data Fig. 2. Modern P. falciparum and P. vivax datasets.
a. Geographic origins, population assignments, and sampling years for 1,232 P. falciparum strains included in our modern comparative dataset. Genotypes and metadata derive from the Pf6 release of the MalariaGEN P. falciparum Community Project (n = 1,227) as well as previously published next- generation sequencing datasets from India (n = 5),. b. Geographic origins, population assignments, and sampling years for 1,055 P. vivax strains included in our modern comparative dataset. Metadata and genotypes were published as part of the Pv4 release of the MalariaGEN P. vivax Genome Variation Project. For most samples, population assignments mirror those from the original data release; however, strains annotated as ‘unassigned’ have been given population labels based both on genetic analysis and their region of origin. Both maps were produced using Cartopy (v. 0.20.3, https://github.com/SciTools/cartopy/tree/v0.20.3) with Natural Earth (naturalearthdata.com).
Extended Data Fig. 3
Extended Data Fig. 3. P. vivax population genetic analysis.
a. PCA showing all ancient P. vivax samples. Symbols corresponding to high-coverage strains (> 5,000 segregating SNPs covered) are outlined with a thick stroke. Marker shape corresponds to the archaeological site and color reflects the mean age of P. vivax strains from that site. Ancient clones are projected onto the diversity of modern P. vivax strains (small circles). Shaded regions delimit the spread of modern P. vivax populations in PCA space. b. PCA showing LDC020 and Ebro1944 projected onto the diversity of modern Latin American P. vivax strains. c. F3 statistics showing shared drift between pairs of modern P. vivax populations and ancient strains relative to the outgroup P. vivax-like. Lighter colors reflect higher affinity between populations. d. Supervised ADMIXTURE analysis modeling all ancient P. vivax strains as mixtures of the following K = 6 source populations: Ethiopia (ETH), Latin America (LAM), Western Asia (WAS), Western Southeast Asia (WSEA), Oceania (OCE), and Eastern Southeast Asia (ESEA). Error bars represent standard errors for the mean admixture proportions estimated using 300 bootstrap replicates. Transparent bars indicate low-coverage P. vivax samples (< 5,000 segregating SNPs covered). e. Selected F3 statistics showing affinity between the ancient European and Latin American P. vivax strains (LDC020, Ebro1944, and STR105) and the following modern P. vivax populations: LAM (n = 96), WAS (n = 44), WSEA (n = 126), ETH (n = 129), ESEA (n = 277), and OCE (n = 189). Error bars represent ± 3 standard errors.
Extended Data Fig. 4
Extended Data Fig. 4. Preservation Characteristics.
a. For Plasmodium nuclear-captured libraries, comparison of 5’ C to T substitution rates on position 1 of reads mapping to target Plasmodium spp. and the human genome. P. vivax MT negative refers to samples that failed to yield MT capture data passing quality control metrics (Methods). b. Per-library comparison of 5’ C to T substitution rates on position 1 of reads mapping to target Plasmodium spp. and the human genome following mitochondrial capture. c. Comparison of mean fragment lengths of reads mapping to target Plasmodium spp. and the human reference genome following nuclear capture. Linear regressions were computed using the SciPy stats package. Panels d-e show boxplots of the mean Plasmodium mitochondrial genome coverage obtained from each aDNA library depending on d. the Plasmodium species present (P. vivax: n = 23, P. falciparum: n = 14) and b. the skeletal element from which DNA was extracted (teeth: n = 30, pars petrosa: n = 7). The reported p-values were estimated using a linear mixed model accounting for the non-independence of libraries prepared from the same individuals. Each box shows the lower quartile, median, and upper quartile of the dataset. Whiskers delimit the range of observations between the upper or lower quartile and 1.5 times the interquartile range.
Extended Data Fig. 5
Extended Data Fig. 5. P. falciparum and P. vivax coverage simulations.
Principal components analysis showing impact of SNP coverage on population ascertainment in ancient P. falciparum (a-c) and ancient P. vivax (d-f) datasets. Diamonds reflect the PCA position of one randomly selected modern strain from each population, which was downsampled to the following coverage levels: a. and d. 500 segregating SNPs, b. and e. 1,500 segregating SNPs, and c. and f. 5,000 segregating SNPs. Downsampled strains were projected onto modern clones using smartPCA. Colored polygons delineate the spatial distribution of 50 downsampled replicates for each population/coverage combination.
Extended Data Fig. 6
Extended Data Fig. 6. Bayesian Molecular Dating Using BEAST.
a. Maximum likelihood phylogeny produced with RAxML-NG using a complete deletion alignment including 17,100 SNP positions. Numbers reflect support values estimated using 1,000 bootstrap replicates. b. Maximum likelihood phylogeny produced with RAxML-NG using a homoplasy-stripped complete deletion alignment including 11,977 SNP positions. Numbers reflect support values estimated using 1,000 bootstrap replicates. c. Maximum clade credibility tree produced using BEAST2 with the optimized relaxed clock and Bayesian coalescent skyline models. Bars represent median node heights and the x-axis reflects years before the present. Numbers represent node posterior probabilities. Leaves are annotated with both sample name and population labels.
Extended Data Fig. 7
Extended Data Fig. 7. Mitochondrial and nuclear capture coverage.
Panels a-b show mapping of the nuclear probes to the following reference genomes: a. P. falciparum 3D7 (GCA_000002765.3) and b. P. vivax PvP01 (GCA_900093555.1). For each species, the 14 nuclear chromosomes are shown, with the purple track indicating the proportion of each 5,000 bp window covered by at least one probe. The nuclear probes span 99.8% and 53.6% of the P. vivax and P. falciparum references, respectively, which is consistent with the higher prevalence of low-complexity AT-rich regions in the P. falciparum reference genome. Panels ce show mapping of the mitochondrial probes to the following mitochondrial references: c. P. falciparum (LR605957.1), d. P. vivax (LT635627.1), e. P. malariae (LT594637.1). For each species, the top track shows the protein coding sequences and rRNA content in green and purple, respectively. The middle track shows the fraction of each 10 bp window covered by at least one probe, and the bottom track shows GC content within each 10 bp window.
Extended Data Fig. 8
Extended Data Fig. 8. P. falciparum population genetic analysis.
a. PCA showing all ancient P. falciparum strains, including low coverage samples (<10,000 segregating SNPs covered). Marker shape corresponds to the archaeological site, and color reflects the mean age of P. falciparum strains per site. Ancient data is projected onto the diversity of modern P. falciparum strains (small circles). Shaded regions show the spread of modern P. falciparum populations in PCA space. b. F3-statistics showing shared drift between pairs of modern P. falciparum populations and ancient strains relative to the outgroup WAF. Lighter colors reflect higher affinity between populations. c. Supervised analysis modeling mean ADMIXTURE proportions for high coverage ancient P. falciparum strains (>10,000 SNPs) using the following K = 8 source populations: West Africa (WAF), East Africa (EAF), Western Southeast Asia (WSEA), Eastern Southeast Asia (ESEA), Indonesia, Papua New Guinea (PNG), South America (SAM), and South Asia (SAS). Error bars give standard errors estimated using 300 bootstrap replicates. d. Supervised ADMIXTURE analysis modeling all ancient P. falciparum strains as mixtures of K = 9 source populations, including both those enumerated in panel c and the ancient genome Ebro1944. Error bars give standard errors of the mean admixture proportions estimated using 300 bootstrap replicates. Transparent bars indicate low-coverage P. falciparum samples (< 10,000 segregating SNPs covered). e. Neighbor-joining phylogeny including ancient and modern P. falciparum strains. Branches are colored by strain geographic origin as in panel a. Black points reflect nodes receiving support values of greater than or equal to 0.9 (100 bootstrap replicates). f. Unsupervised ADMIXTURE analysis of modern P. falciparum strains, with components colored according to the modern population in which that source is maximized. g. Tree of genetic relationships among the 61 populations inferred by the unlinked model of fineSTRUCTURE. Thick stroke indicates sample groupings receiving ≥ 90% posterior probability after 500 samples of the MCMC chain. Terminal branches representing a single strain are indicated with an asterisk. h. PCA computed on the output coancestry matrix places Ebro1944 closer to P. falciparum strains from South Asia. i. The output of Chromopainter analysis was analyzed with GLOBETROTTER to determine which populations, corresponding to broader geographical regions, are required to model Ebro1944.
Extended Data Fig. 9
Extended Data Fig. 9. LDC020 Human Population Genetic Analysis.
a. PCA computed using a global set of modern human populations. LDC020 was projected onto these axes of variation (white star). b. F4-statistics testing for cladality between LDC020 and a test panel of the following modern South American Indigenous populations with negligible European admixture: Mayan (n = 2), Mexico Zapotec (n = 2), Karitiana (n = 3), Surui (n = 2), Quechua (n = 3), Mixe (n = 3), Pima (n = 2), and Piapoco (n = 2). A negative statistic indicates excess allele sharing between either Spanish.DG (n = 2) and the test population or LDC020 and Mbuti.DG (n = 4), while a positive statistic supports excess affinity between either Spanish.DG and LDC020 or Mbuti.DG and the test population. Error bars show the point estimate for the F4 statistic ±3 standard errors. c. Supervised ADMIXTURE analysis modeling the ancestry of LDC020 as a composite of six modern populations: Atayal, French, Kalash, Karatiana, Mbuti, and Papuan. d. Regional PCA computed using selected ancient and modern populations from South America (Supplementary Methods 10). LDC020 is projected onto these axes of variation.
Extended Data Fig. 10
Extended Data Fig. 10. Human population genetics of malaria-positive individuals from Mechelen.
a. Mobest similarity probability search results for each of the ten malaria-infected individuals. The search was conducted in a range of ±100 years from the designated mean date of each individual. b. PCA including both malaria-infected and uninfected individuals from Mechelen projected onto the diversity of modern Western Eurasian populations. Marker type indicates infection status, while points are colored by time transect. Select ancient populations are visualized as colored circles for comparative purposes. Inset shows all individuals from Mechelen with the malaria-positives marked by individual labels.

Similar articles

Cited by

References

    1. Carter R, Mendis KN. Evolutionary and historical aspects of the burden of malaria. Clin. Microbiol. Rev. 2002;15:564–594. - PMC - PubMed
    1. Gelabert P, Olalde I, de-Dios T, Civit S, Lalueza-Fox C. Malaria was a weak selective force in ancient Europeans. Sci. Rep. 2017;7:1377. - PMC - PubMed
    1. Sallares R, Bouwman A, Anderung C. The spread of malaria to southern europe in antiquity: new approaches to old problems. Med. Hist. 2004;48:311–328. - PMC - PubMed
    1. Ashley EA, Pyae Phyo A, Woodrow CJ. Malaria. Lancet. 2018;391:1608–1621. - PubMed
    1. World Health Organization. World Malaria Report 2021 (World Health Organization, 2021).

Publication types

MeSH terms