. 2024 Aug;4(8):1053-1063.
doi: 10.1038/s43587-024-00649-5. Epub 2024 Jun 12.

Conserved epigenetic hallmarks of T cell aging during immunity and malignancy

Affiliations

Conserved epigenetic hallmarks of T cell aging during immunity and malignancy

Tian Mi et al. Nat Aging. 2024 Aug.

Abstract

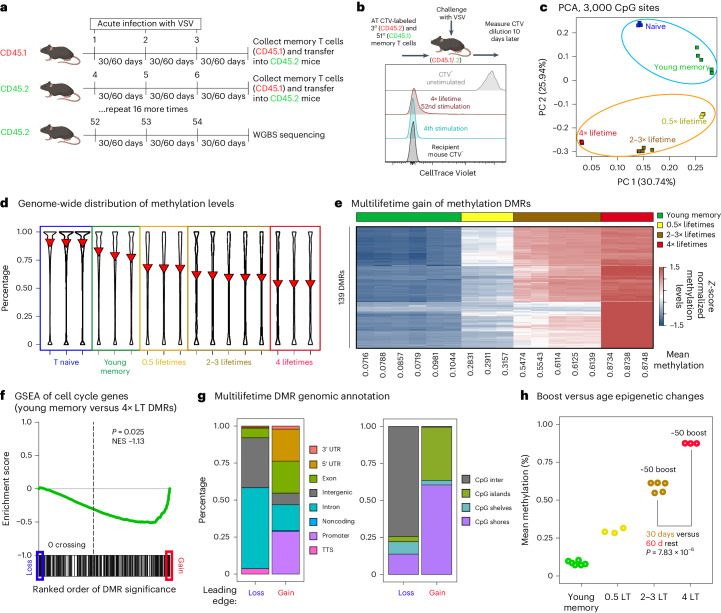
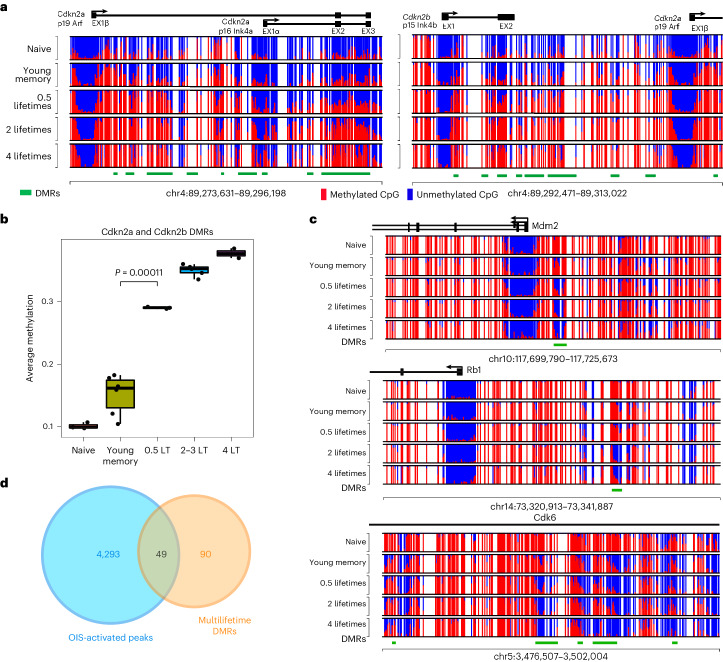
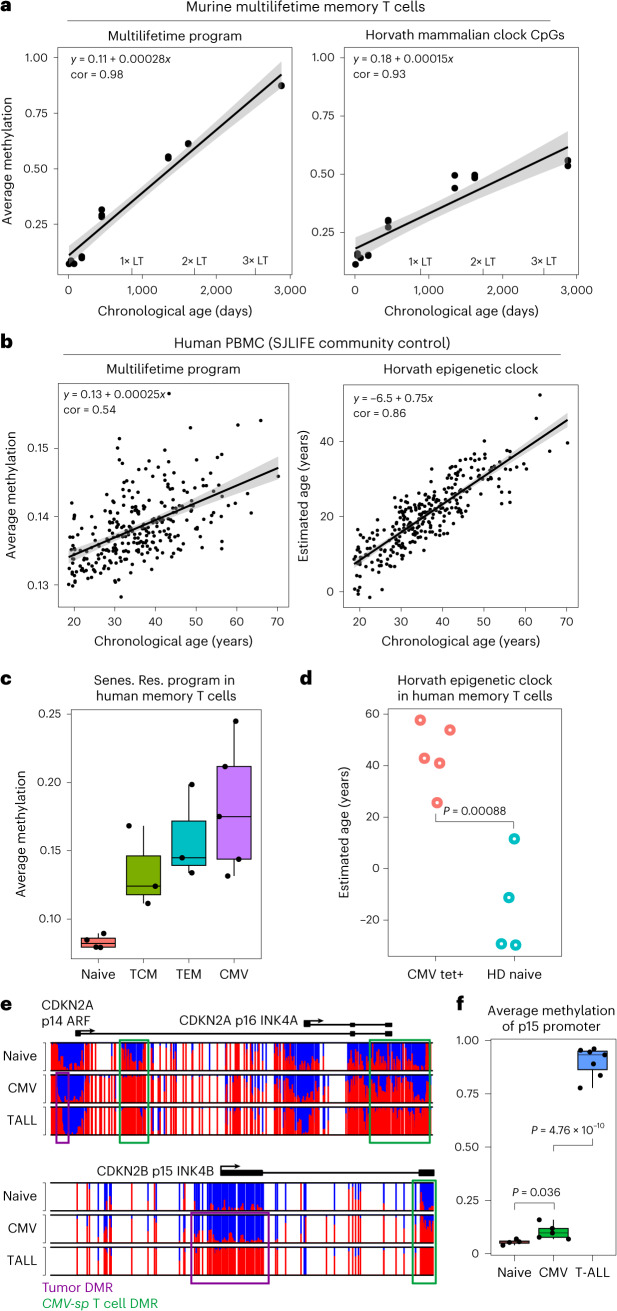
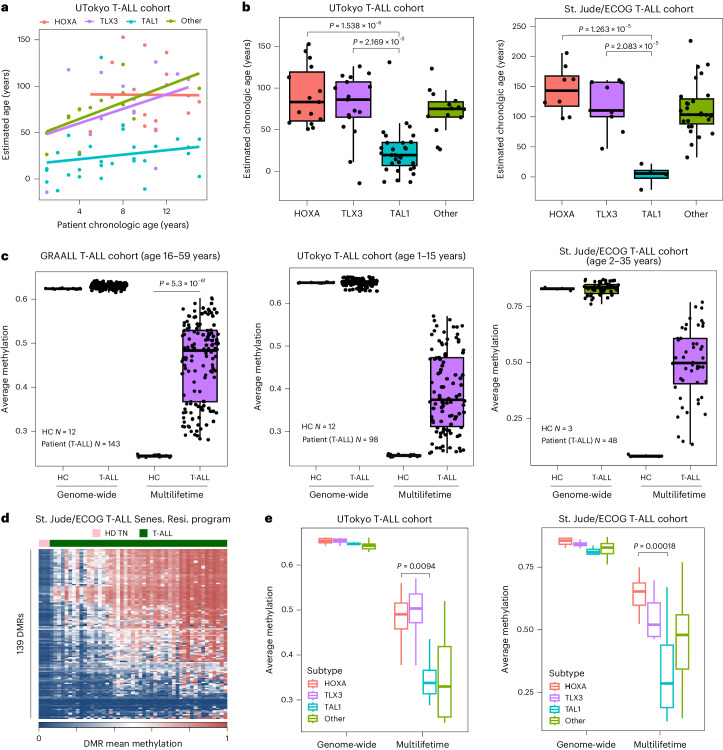
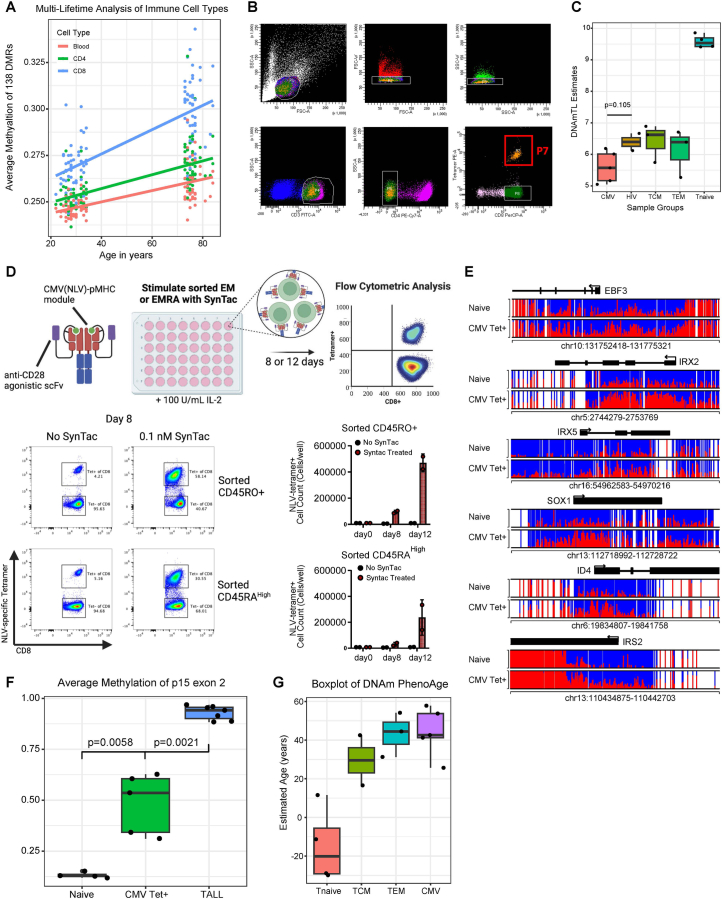
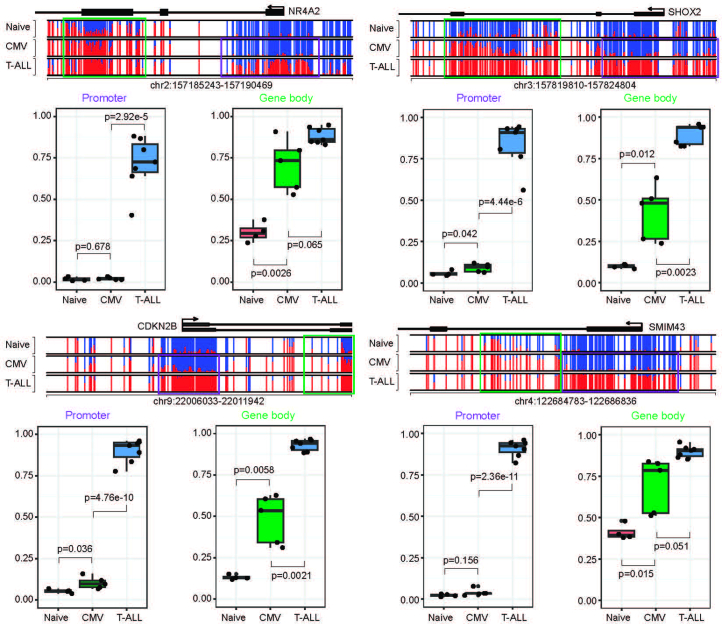
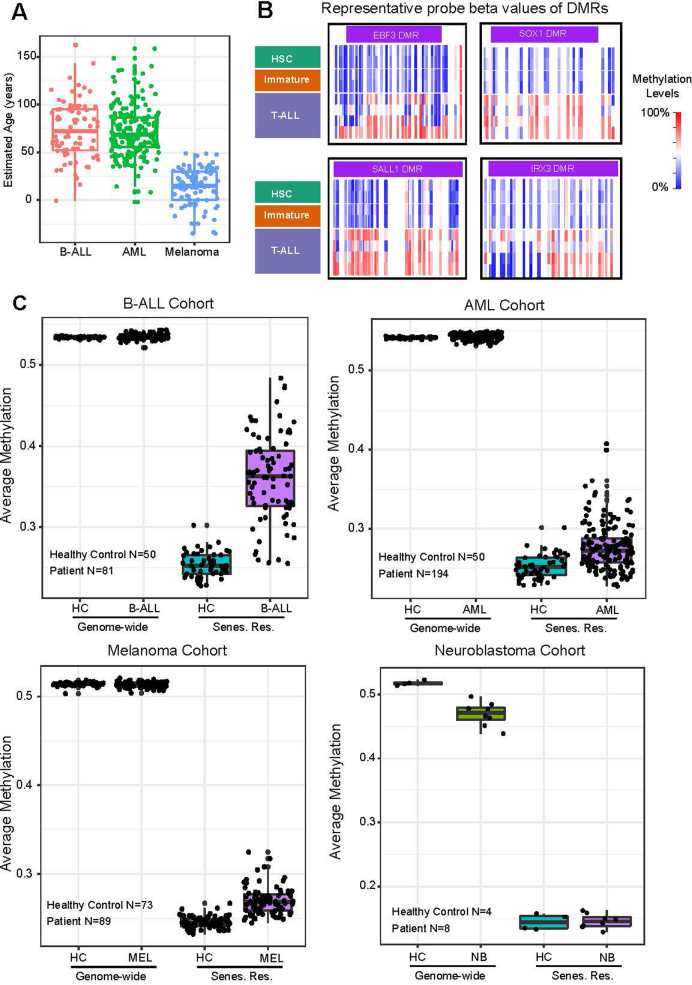
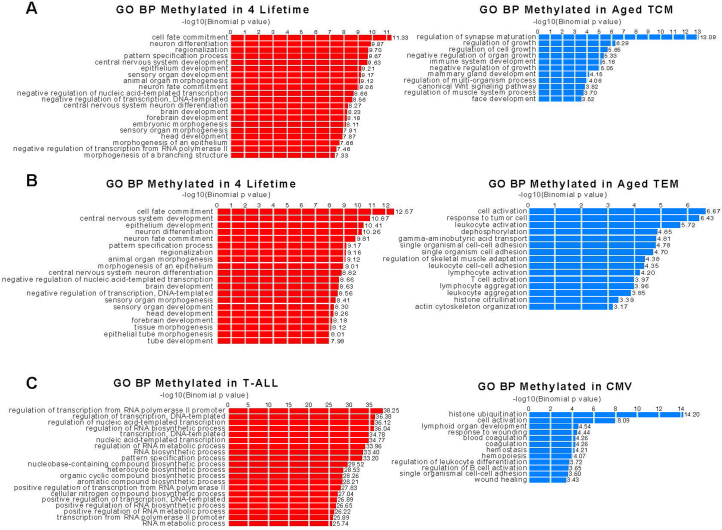
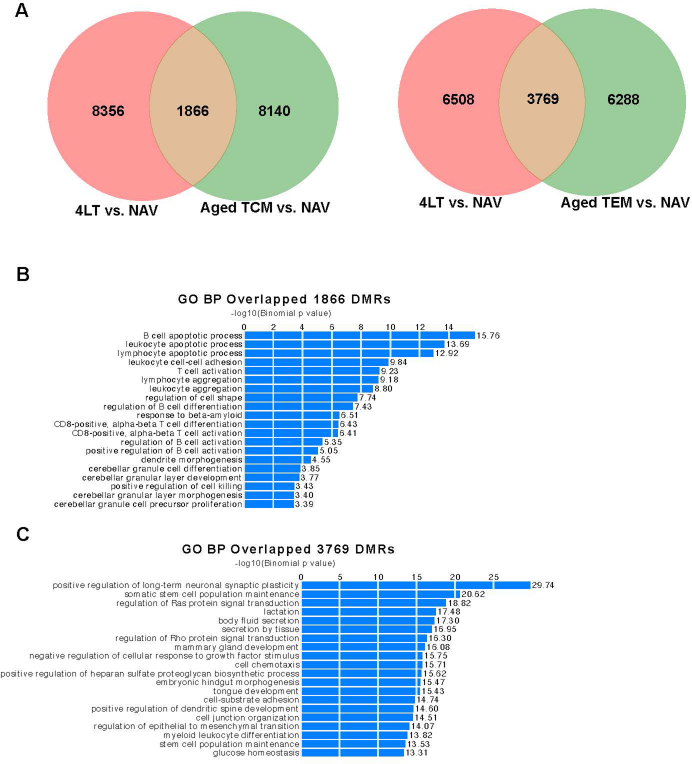
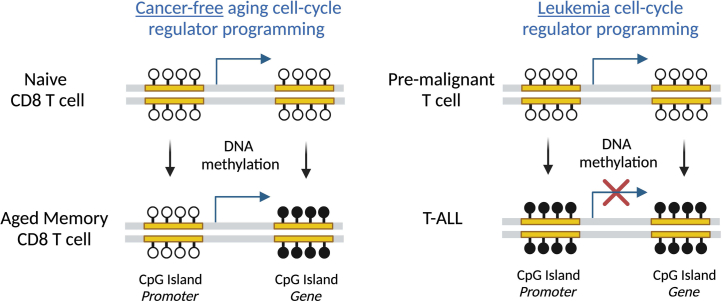
Chronological aging correlates with epigenetic modifications at specific loci, calibrated to species lifespan. Such 'epigenetic clocks' appear conserved among mammals, but whether they are cell autonomous and restricted by maximal organismal lifespan remains unknown. We used a multilifetime murine model of repeat vaccination and memory T cell transplantation to test whether epigenetic aging tracks with cellular replication and if such clocks continue 'counting' beyond species lifespan. Here we found that memory T cell epigenetic clocks tick independently of host age and continue through four lifetimes. Instead of recording chronological time, T cells recorded proliferative experience through modification of cell cycle regulatory genes. Applying this epigenetic profile across a range of human T cell contexts, we found that naive T cells appeared 'young' regardless of organism age, while in pediatric patients, T cell acute lymphoblastic leukemia appeared to have epigenetically aged for up to 200 years. Thus, T cell epigenetic clocks measure replicative history and can continue to accumulate well-beyond organismal lifespan.


Conflict of interest statement

The authors declare no competing interests.

Figures

Fig. 1
Fig. 1. Epigenetic profiles of physiologically aged and ML functional memory T cells.
a, Schema for generating ML memory CD8+ T cells. Naive mice were infected with VSV generating antigen-specific memory CD8+ T cells. Heterologous VSV infection and boosting of the memory T cells was performed after 30 versus 60 days post previous infection. After three infections, the antigen-specific memory CD8+ T cells were transferred into congenically distinct naive mice, and the boosting strategy was repeated over a time frame that yielded memory T cells with age ranging between 0.5 and ~4 mouse lifetime (LT) equivalents. For young memory, n = 6; 0.5× LT, n = 3; 2–3× LT, n = 5; and 4× LT, n = 3. b, Representative FACS analysis of cell trace violet (CTV) dilution from 3° (CD45.2) and 51° (CD45.1) memory T cells transferred into recipient CD45.1/2 mice. CTV label was measured 10 days after VSV-Indiana challenge of the chimeric mice. c, PCA plot of 3,000 most variable CpG sites comparing ML and ‘young’ memory T cells. Plot showing principal components 1 and 2 (PC1 and PC2). d, Violin plots showing average genome-wide CpG methylation for naive, young memory and ML CD8+ T cells. The red triangles represent the median values. e, Heatmap showing top ML gain of methylation DMRs. f, GSEA using cell cycle regulators and gain versus loss of methylation DMRs for 4× LT memory CD8+ T cells relative to young memory CD8+ T cells. The P value is based on the weighted Kolmogorov–Smirnov statistic with no adjustment. g, Genomic and CpG island annotation of top loss and gain of methylation ML DMRs. h, Summary graph showing mean methylation across top ML gain of methylation DMRs relative to boosting and age of memory T cells. Different lengths of resting period also result in significant changes of mean methylation levels. The P value is based on the two-sided Student’s t-test.
Fig. 2
Fig. 2. DNA methylation profiles of replicative senescence-associated genes.
a, Representative CpG DNA methylation plot of Cdkn2a/2b loci in naive, young memory and ML memory CD8+ T cells. b, Summary graph of total DMR methylation among the Cdkn2a/b loci for young and ML memory CD8+ T cells. n = 2–5 for biologically independent samples. The P value based on a two-sided Student’s t-test. The box and hinges correspond to the first, second and third quartiles, the upper whisker extends to the minimum (largest value, upper hinge + 1.5 × interquartile range) and the lower whisker extends to the maximum (smallest value, lower hinge − 1.5 × interquartile range). c, Representative CpG DNA methylation of Mdm2, Rb1 and Cdk6. d, Venn diagram showing overlap between OIS-activated enhancers and top 139 DMRs.
Fig. 3
Fig. 3. Age estimation of mouse and human immune cells using epigenetic clocks.
a, Left: linear regression plots of mouse T cell age and average methylation levels of ML EA-associated genes. Right: linear regression plots of mouse T cell age and Horvath panmammal epigenettic clock. Pearson correlation coefficient (cor) is shown in each plot. The error band represents the mean ± 1.96 × standard error of the mean. b, Left: linear regression plots of SJLIFE healthy control (HC) chronologic age versus average PBMC methylation level. Right: linear regression plots of SJLIFE HC chronologic ages and Horvath epigenetic age estimation based on the PBMC methylation profile. Pearson cor is shown in each plot. The error band represents the mean ± 1.96 × standard error of the mean. c, Summary graph of average ML EA-associated methylation levels for human naive, Tcm, Tem and CMV-specific (Tetramer+) memory T cell samples. n = 3–5 for the biologically independent samples. Senescence resistant (Senes. Res.) program means the 139 top DMRs between endogenous and 4LT memory T cells. d, Horvath epigenetic clock age estimation of CMV-specific (n = 5) and naive (n = 4) CD8+ T cells. The P value is based on a two-sided Student’s t-test. The error bars represent the standard deviation. e, Representative DNA methylation plots of CDKN2A/2B gene cluster among naive CD8+ T cells, CMV-specific CD8+ T cells and T-ALL. f, Summary graph for p15 promoter methylation among naive CD8+ T cells, CMV-specific CD8+ T cells and T-ALL. n = 4–7 for the biologically independent samples. The P values are based on a two-sided Student’s t-test. For all box plots, the box and hinges correspond to the first, second and third quartiles, the upper whisker extends to the minimum (largest value, upper hinge + 1.5 × interquartile range) and the lower whisker extends to the maximum (smallest value, lower hinge − 1.5 × interquartile range).
Fig. 4
Fig. 4. T-ALL subset epigenetic age estimation.
a,b, Summary graphs of patient chronologic age (a) versus estimated tumor age (b) based on T-ALL subset using the Horvath epigenetic clock (n = 13–31 in the UTokyo cohort and n = 4–28 in the St. Jude cohort). The P values are based on a two-sided Student’s t-test. c, Summary box plots for the T-ALL patient tumor genome-wide DNA methylation levels versus EA programs among three independent cohorts (GRAALL n = 143, St. Jude/ECOG n = 48 and UTokyo n = 98). The P value is based on a two-sided Student’s t-test. d, DNA methylation level heatmap of ML EA programs for St. Jude/ECOG T-ALL patients. e, Summary graph of ML EA programs among established T-ALL patient subtypes. The P values are based on two-sided Student’s t-tests comparing HOXA and TAL1 subtypes (n = 13–31 in the UTokyo cohort and n = 4–28 in the St. Jude cohort. For all box plots, the box and hinges correspond to the first, second and third quartiles, the upper whisker extends to the minimum (largest value, upper hinge + 1.5 × interquartile range) and the lower whisker extends to the maximum (smallest value, lower hinge − 1.5 × interquartile range).
Extended Data Fig. 1
Extended Data Fig. 1. Transcriptomic and epigenetic profiles of multi-lifetime memory T cells at genes of interest.
(a) DNA methylation level plots and ATAC seq tracks of genes associated with T cell stemness among multi-lifetime memory T cells. (b) Methylation level plots and ATAC seq tracks of genes associated with effector T cell functions among multi-lifetime memory T cells. (c) Methylation level plots and ATAC seq tracks of inhibitory receptor genes among multi-lifetime memory T cells. (d) Summary graphs for RNAseq transcript levels corresponding to genes in the methylation and ATACseq plots. n = 3 biologically independent samples. (e) Heatmap showing relative transcript abundance for cell-cycle regulators with measurable transcript defined from the ML memory T cell model. (f) Representative CpG DNA methylation of Ebf3 and Irx2 loci among top EA-associated DMRs from the multi-lifetime memory CD8 T cells.
Extended Data Fig. 2
Summary graph showing the percentage of VSV-specific CD8 T cells generated from the heterologous prime-boost-boost infection schema throughout the entire time frame of the experiment. T cell frequency data from cohort 1 and 2 have been previously reported 19 and are shown here relative to the newly established cohort used to generate 0.5 LT memory CD8 T cells (cohort #3).
Extended Data Fig. 3
Extended Data Fig. 3. DNA methylation, chromatin accessibility and transcriptional profiles of p14/p16 cell cycle regulator genes.
(a) Schematic cartoon of cell cycle regulator pathway related to p14/p16. Adapted from Sharpless and Sherr, Nature Reviews Cancer 2015. (b) DNA methylation and ATAC seq tracks showing the chromatin accessibility changes of DMR regions in the CDKN2A/2B locus. (c) Summary graphs for RNAseq transcript levels of CDKN2A and CDKN2B products. n = 3 biologically independent samples. Error bars represent standard deviation. (d) ATACseq profiles of Mdm2, Rb1 and Cdk6 loci. (e) Gene expression bar plots comparing Dnmt3a KO and Rosa KO (control). n = 2–5 biologically independent samples. Error bars represent standard deviation. (f) DNA methylation level plots showing Dnmt3a regulated gene body changes on Cdkn2a/2b.
Extended Data Fig. 4
Extended Data Fig. 4. Annotation of multi-lifetime DMR genes.
(a) Venn diagram of overlapped gene counts between the multi-lifetime EA program (T cell age), Horvath epigenetic clock and Hannum epigenetic clock. (b) Venn diagram of overlapped gene counts between T cell age, HSC aging hypermethylated genes 24 and EpiTOC mitotic age 39. (c) Top: GSEA enrichment of T Effector H3K27me3 peaks on 4 life-time defined DMRs. Middle: GSEA enrichment of T effector genes from YFV vaccine RNA seq data on 4 life-time defined DMRs. Bottom: GSEA enrichment of GO BP cell cycle genes on 0.5 life-time defined DMRs. All GSEA enrichment plots are comparable with main Fig. 1f. (d) Methylation heatmap of top 150 DMRs between endogenous and 0.5X lifetime samples. (e) Regression analysis of 0.5 LT DMRs versus 4X LT DMRs applied to all murine samples. (f) Representative FACS sorting of three T cell subsets in 2-year old mice cohort. (g) Mean methylation box plots of T cell age and Horvath mouse clock CpGs. n = 2–5 for multi-LT samples, n = 2 for aged mice samples, n = 1 for 1 year LCMV samples. P values based on two-sided Student’s t test.Box and hinges correspond to the first, second and third quartiles, upper whisker extends to min(largest value, upper hinge + 1.5 * IQR), lower whisker extends to max(smallest value, lower hinge - 1.5 * IQR). (h) Methylation level plots of Cdkn2a and Irx2 loci of T cells isolated from 2-year old mice.
Extended Data Fig. 5
Extended Data Fig. 5. Characterization of multi-LT DMR genes among human CMV-specific T cells and reference methylation data sets.
(a) T cells ages of 450K methylation array samples from matched donors (GSE59065). CD8 T cell samples showed strongest hypermethylation as the host age. (b) Representative FACS plot for isolating CMV Tet+ memory T cells. (c) Methylation based telomere length estimates of CMV-specific and HIV-specific T cells in matched donors. n = 2–5 biologically independent samples. P value based on two-sided Student’s t test. (d) Cartoon schematic and representative FACS plots showing tetramer staining among CD45RO+ and CD45RA+ CMV-specific T cells before and after in vitro expansion with SynTac. Bar plots show total number of expanded CMV-specific T cells from replicate experiments (n = 2). Error bars represent standard deviation. (e) DNA methylation level plots of EBF3, IRX2, IRX5, and SOX1 among naïve and CMV-specific CD8 T cells. (f) Summary graph for P15 exon 2 methylation among naïve CD8 T cells, CMV-specific CD8 T cells, and T-ALL. n = 5–7 biologically independent samples. P value based on two-sided Student’s t test. (g) Estimated Horvath DNAm PhenoAge for naïve, Tcm, Tem, and CMV-specific CD8 T cells. n = 3–5 biologically independent samples. For all box plots, box and hinges correspond to the first, second and third quartiles, upper whisker extends to min(largest value, upper hinge + 1.5 * IQR), lower whisker extends to max(smallest value, lower hinge - 1.5 * IQR).
Extended Data Fig. 6
Extended Data Fig. 6. Leukemia associated vs. proliferation associated DMRs.
Top panels: Representative CpG DNA methylation of NR4A2, CDKN2B, SHOX2, and SMIM43 leukemia-associated DMRs. Corresponding summary graph of individual loci promoter and gene body CpG island methylation among naïve CD8 T cells, CMV-specific CD8 T cells, and T-ALL. n = 4–7 biologically independent samples. P values based on two-sided Student’s t test. Box and hinges correspond to the first, second and third quartiles, upper whisker extends to min(largest value, upper hinge + 1.5 * IQR), lower whisker extends to max(smallest value, lower hinge - 1.5 * IQR). Bottom panels: Representative CpG DNA methylation of Nr4a2 comparing iteratively stimulated murine ML T cells versus WT and DNMT3A KO P14 CD8 T cells from mice chronically infected with LCMV for 30 days.
Extended Data Fig. 7
Extended Data Fig. 7. DNA methylation pattern of multi-LT DMRs among various human cancer datasets.
(a) Epigenetic age estimation of four cancer patient cohorts based on Horvath DNAm PhenoAge. n = 81 for B-ALL samples, n = 194 for AML samples, n = 89 for melanoma samples. (b) DNA methylation level plots on selected EA genes. (c) Average methylation box plot comparing genome wide methylation versus EA program among healthy controls and cancer patients with B-ALL, AML, melanoma or neuroblastoma. For all box plots, box and hinges correspond to the first, second and third quartiles, upper whisker extends to min(largest value, upper hinge + 1.5 * IQR), lower whisker extends to max(smallest value, lower hinge - 1.5 * IQR).
Extended Data Fig. 8
Extended Data Fig. 8. Gene ontology annotation of DMRs from mouse and human aged T cell comparisons.
(a) Top GO enriched terms for aged mice Tcm vs 4 Lifetime samples. (b) Top GO enriched terms for aged mice Tem vs 4 Lifetime samples. (c) Top GO enriched terms for T-ALL vs. CMV-specific T cells. P values based on one-sided binomial test with no adjustment.
Extended Data Fig. 9
Extended Data Fig. 9. Overlap analysis of multi-LT DMRs vs. aged mice DMRs.
(a) Venn diagrams of overlaps between 4LT defined DMRs and 2 year old aged mice defined DMRs. (b) Top GO enriched terms of overlapped DMRs between 4LT and aged TCM DMRs. (c) Top GO enriched terms of overlapped DMRs between 4LT and aged TEM DMRs. P values based on one-sided binomial test with no adjustment.
Extended Data Fig. 10
Cartoon summary of experiential age-associated DNA methylation programs that delineate longevity versus malignancy among T cells.

Similar articles

Cited by

References

    1. Bodnar, A. G. et al. Extension of life-span by introduction of telomerase into normal human cells. Science279, 349–352 (1998). 10.1126/science.279.5349.349 - DOI - PubMed
    1. Cagan, A. et al. Somatic mutation rates scale with lifespan across mammals. Nature604, 517–524 (2022). 10.1038/s41586-022-04618-z - DOI - PMC - PubMed
    1. Jaskelioff, M. et al. Telomerase reactivation reverses tissue degeneration in aged telomerase-deficient mice. Nature469, 102–106 (2011). 10.1038/nature09603 - DOI - PMC - PubMed
    1. Zindy, F., Quelle, D. E., Roussel, M. F. & Sherr, C. J. Expression of the p16INK4a tumor suppressor versus other INK4 family members during mouse development and aging. Oncogene15, 203–211 (1997). 10.1038/sj.onc.1201178 - DOI - PubMed
    1. Krishnamurthy, J. et al. p16INK4a induces an age-dependent decline in islet regenerative potential. Nature443, 453–457 (2006). 10.1038/nature05092 - DOI - PubMed