

To explore the prognostic characteristics of colon cancer based on tertiary lymphoid structure-related genes and reveal the characteristics of tumor microenvironment and drug prediction
- PMID: 38867070
- PMCID: PMC11169531
- DOI: 10.1038/s41598-024-64308-w
To explore the prognostic characteristics of colon cancer based on tertiary lymphoid structure-related genes and reveal the characteristics of tumor microenvironment and drug prediction
Abstract
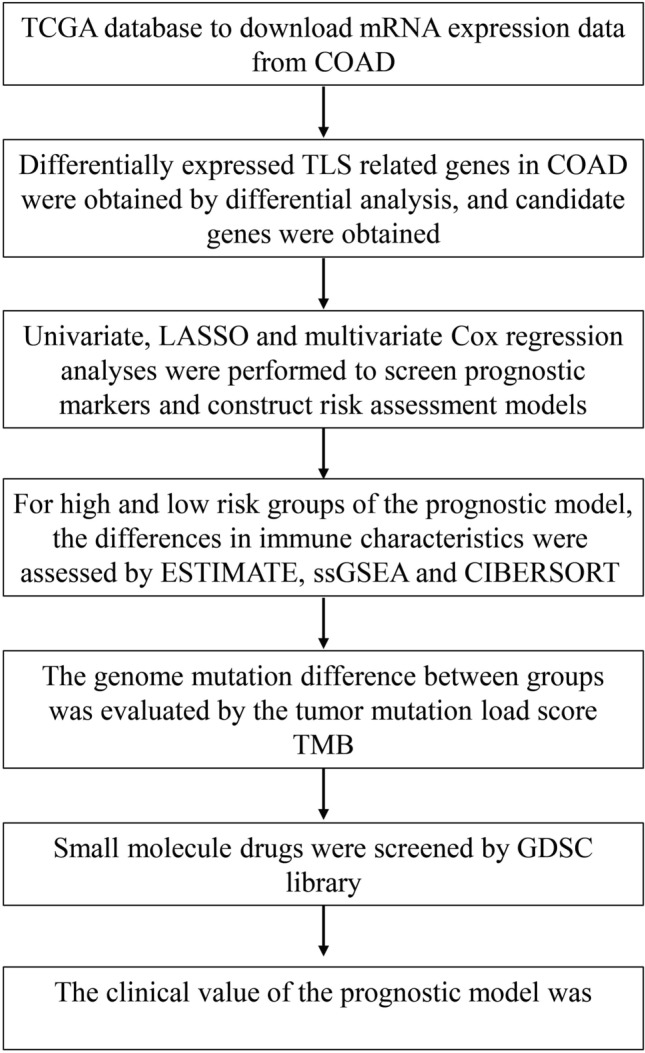
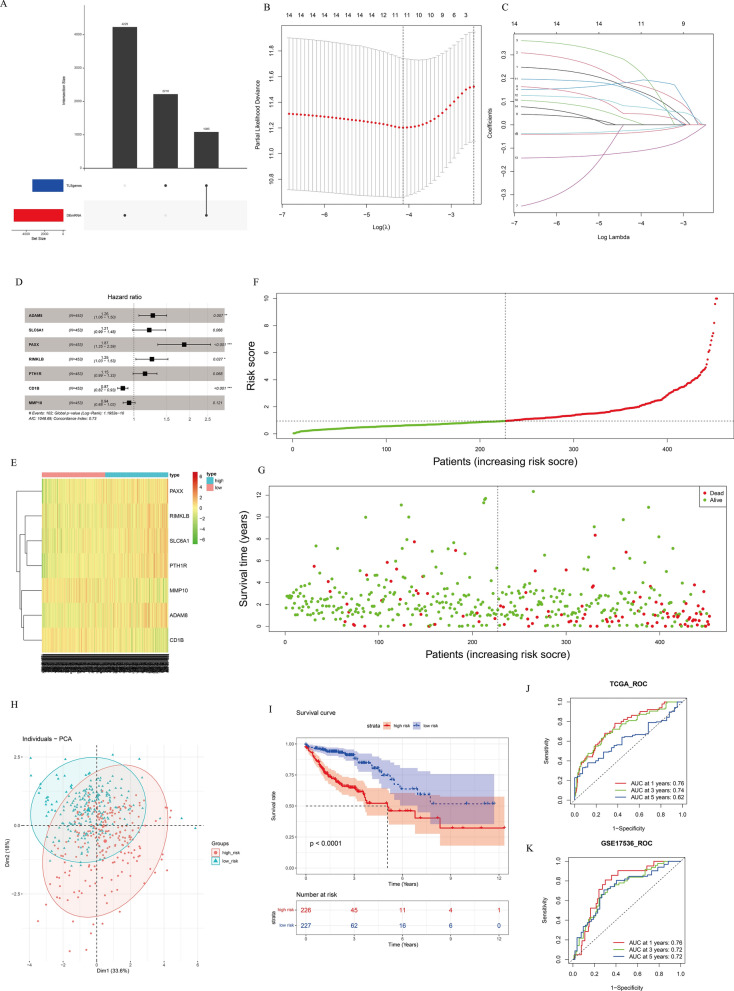
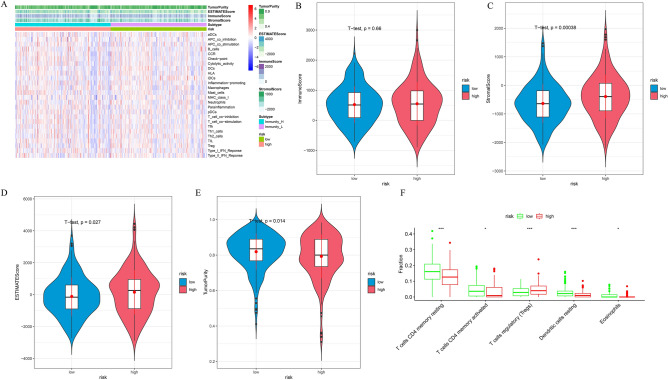
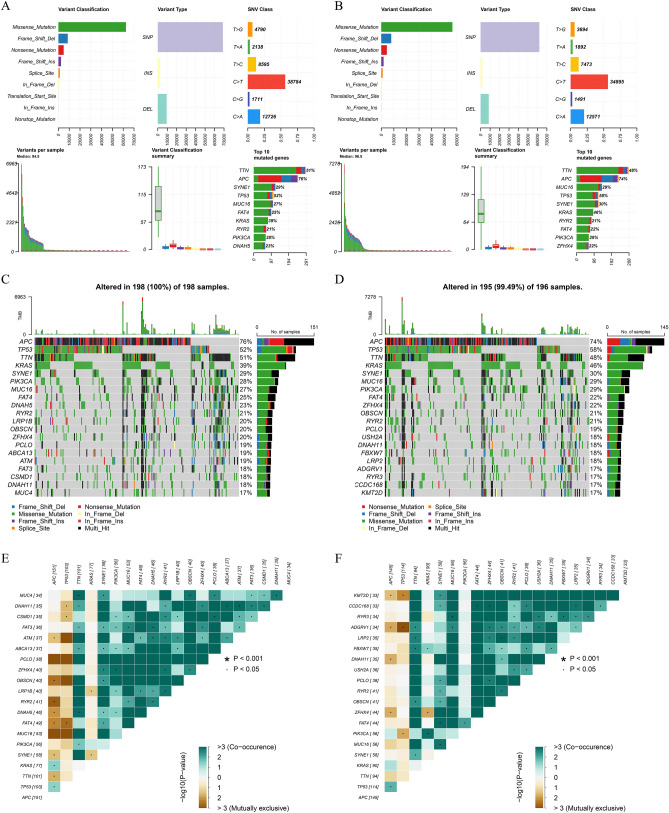
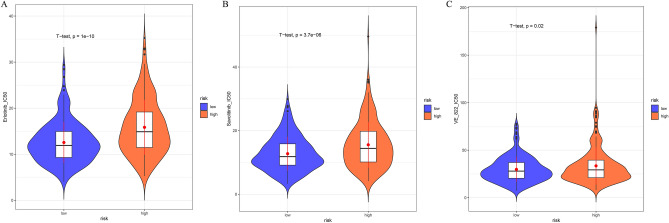
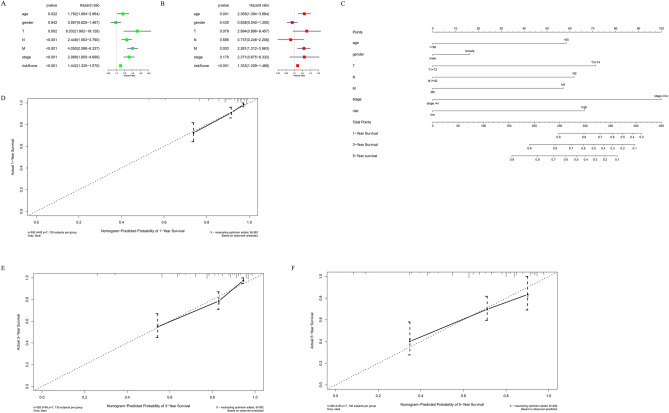
In order to construct a prognostic evaluation model of TLS features in COAD and better realize personalized precision medicine in COAD. Colon adenocarcinoma (COAD) is a common malignant tumor of the digestive system. At present, there is no effective prognostic marker to predict the prognosis of patients. Tertiary lymphoid structure (TLS) affects cancer progression by regulating immune microenvironment. Mining COAD biomarkers based on TLS-related genes helps to improve the prognosis of patients. In order to construct a prognostic evaluation model of TLS features in COAD and better realize personalized precision medicine in COAD. The mRNA expression data and clinical information of COAD and adjacent tissues were downloaded from the Cancer Genome Atlas database. The differentially expressed TLS-related genes of COAD relative to adjacent tissues were obtained by differential analysis. TLS gene co-expression analysis was used to mine genes highly related to TLS, and the intersection of the two was used to obtain candidate genes. Univariate, LASSO, and multivariate Cox regression analysis were performed on candidate genes to screen prognostic markers to construct a risk assessment model. The differences of immune characteristics were evaluated by ESTIMATE, ssGSEA and CIBERSORT in high and low risk groups of prognostic model. The difference of genomic mutation between groups was evaluated by tumor mutation burden score. Screening small molecule drugs through the GDSC library. Finally, a nomogram was drawn to evaluate the clinical value of the prognostic model. Seven TLS-related genes ADAM8, SLC6A1, PAXX, RIMKLB, PTH1R, CD1B, and MMP10 were screened to construct a prognostic model. Survival analysis showed that patients in the high-risk group had significantly lower overall survival rates. Immune microenvironment analysis showed that patients in the high-risk group had higher immune indicators, indicating higher immunity. The genomic mutation patterns of the high-risk and low-risk groups were significantly different, especially the KRAS mutation frequency was significantly higher in the high-risk group. Drug sensitivity analysis showed that the low-risk group was more sensitive to Erlotinib, Savolitinib and VE _ 822, which may be used as a potential drug for COAD treatment. Finally, the nomogram constructed by pathological features combined with RiskScore can accurately evaluate the prognosis of COAD patients. This study constructed and verified a TLS model that can predict COAD. More importantly, it provides a reference standard for guiding the prognosis and immunotherapy of COAD patients.
Keywords: Colon adenocarcinoma; Drug sensitivity; Immune; Prognosis; Tertiary lymphoid structures; Tumor microenvironment.
© 2024. The Author(s).
Conflict of interest statement
The authors declare no competing interests.
Figures
Similar articles
-
Developing a RiskScore Model based on Angiogenesis-related lncRNAs for Colon Adenocarcinoma Prognostic Prediction.Curr Med Chem. 2024;31(17):2449-2466. doi: 10.2174/0109298673277243231108071620. Curr Med Chem. 2024. PMID: 37961859
-
Analysis of Interleukin-1 Signaling Alterations of Colon Adenocarcinoma Identified Implications for Immunotherapy.Front Immunol. 2021 Jul 23;12:665002. doi: 10.3389/fimmu.2021.665002. eCollection 2021. Front Immunol. 2021. PMID: 34367132 Free PMC article.
-
Investigating gene signatures associated with immunity in colon adenocarcinoma to predict the immunotherapy effectiveness using NFM and WGCNA algorithms.Aging (Albany NY). 2024 May 13;16(9):7596-7621. doi: 10.18632/aging.205763. Epub 2024 May 13. Aging (Albany NY). 2024. PMID: 38742936 Free PMC article.
-
Prognostic and clinicopathological significance of tertiary lymphoid structure in non-small cell lung cancer: a systematic review and meta-analysis.BMC Cancer. 2024 Jul 8;24(1):815. doi: 10.1186/s12885-024-12587-x. BMC Cancer. 2024. PMID: 38977962 Free PMC article.
-
Tertiary lymphoid structures in colorectal cancer.Ann Med. 2024 Dec;56(1):2400314. doi: 10.1080/07853890.2024.2400314. Epub 2024 Nov 22. Ann Med. 2024. PMID: 39575712 Free PMC article. Review.
Cited by
-
Unveiling the prognostic significance of RNA editing-related genes in colon cancer: evidence from bioinformatics and experiment.Eur J Med Res. 2025 Feb 12;30(1):94. doi: 10.1186/s40001-025-02335-7. Eur J Med Res. 2025. PMID: 39940052 Free PMC article.
-
Interferon Regulatory Factor 4 Recruits Immature B Cells to Signal Tertiary Lymphoid Structure Immaturity and Progression of Clear Cell Renal Cell Carcinoma.Int J Biol Sci. 2025 Jun 9;21(9):3827-3851. doi: 10.7150/ijbs.113737. eCollection 2025. Int J Biol Sci. 2025. PMID: 40607252 Free PMC article.
-
Research review of the mechanism and clinical application prospects of tertiary lymphoid structures in the immune micro-environment of gastrointestinal tumors.Oncol Res. 2025 Jun 26;33(7):1571-1580. doi: 10.32604/or.2025.058957. eCollection 2025. Oncol Res. 2025. PMID: 40612858 Free PMC article. Review.
References
MeSH terms
Substances
LinkOut - more resources
Full Text Sources
Miscellaneous
