Clinical Trial
. 2024 Jun;30(6):1636-1644.
doi: 10.1038/s41591-024-02979-8. Epub 2024 Jun 12.

PSCA-CAR T cell therapy in metastatic castration-resistant prostate cancer: a phase 1 trial

Affiliations
Clinical Trial

PSCA-CAR T cell therapy in metastatic castration-resistant prostate cancer: a phase 1 trial

Tanya B Dorff et al. Nat Med. 2024 Jun.

Abstract

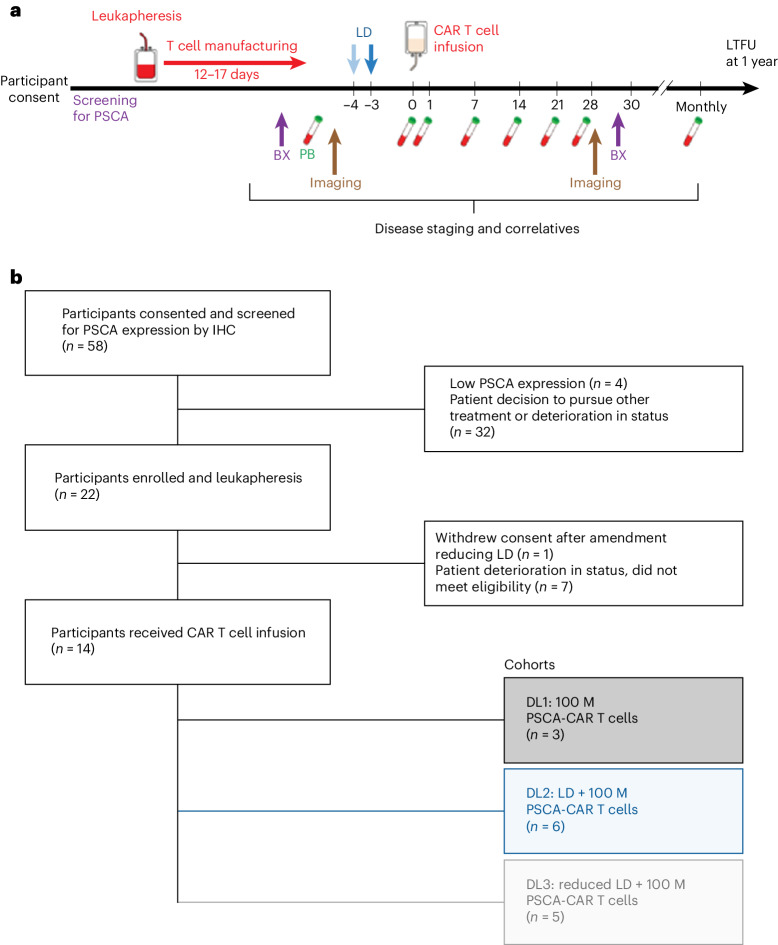
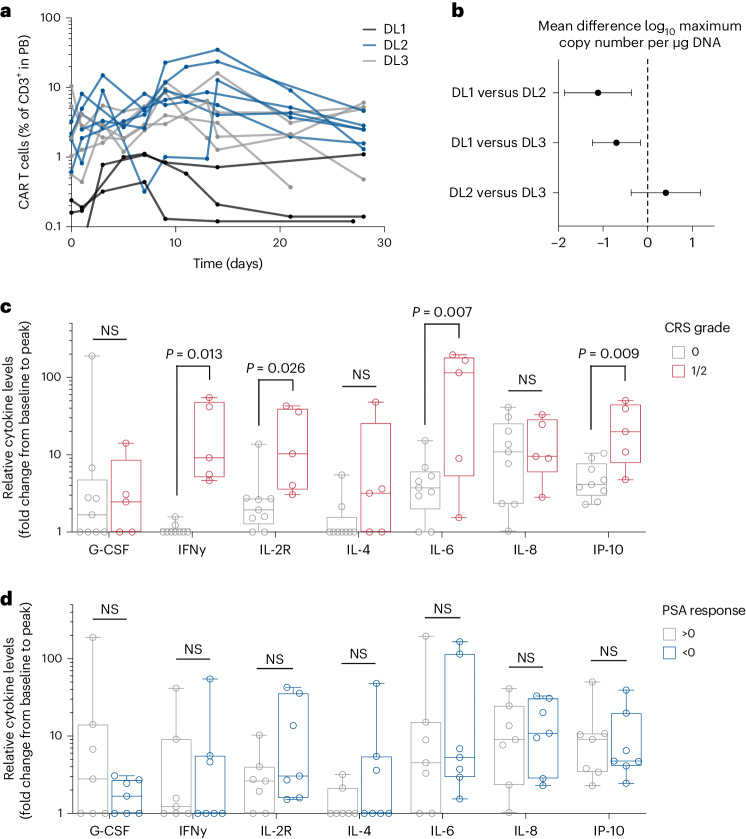
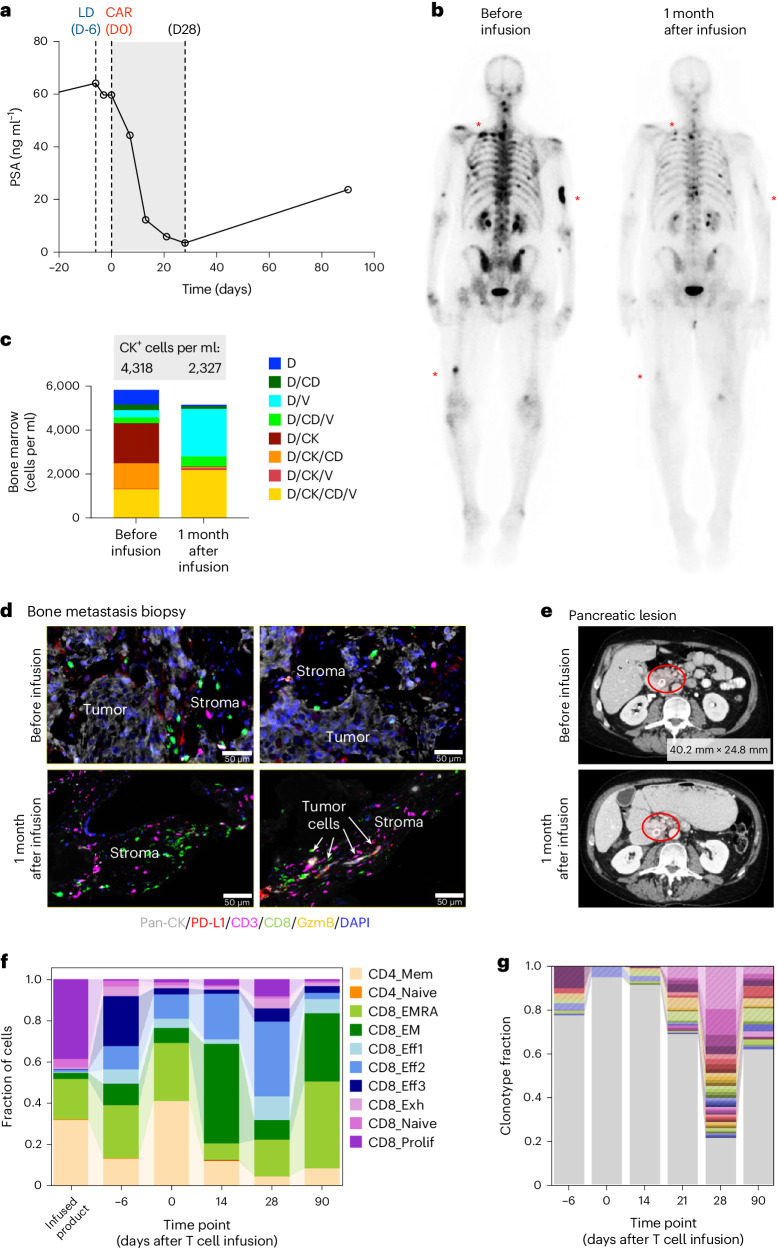
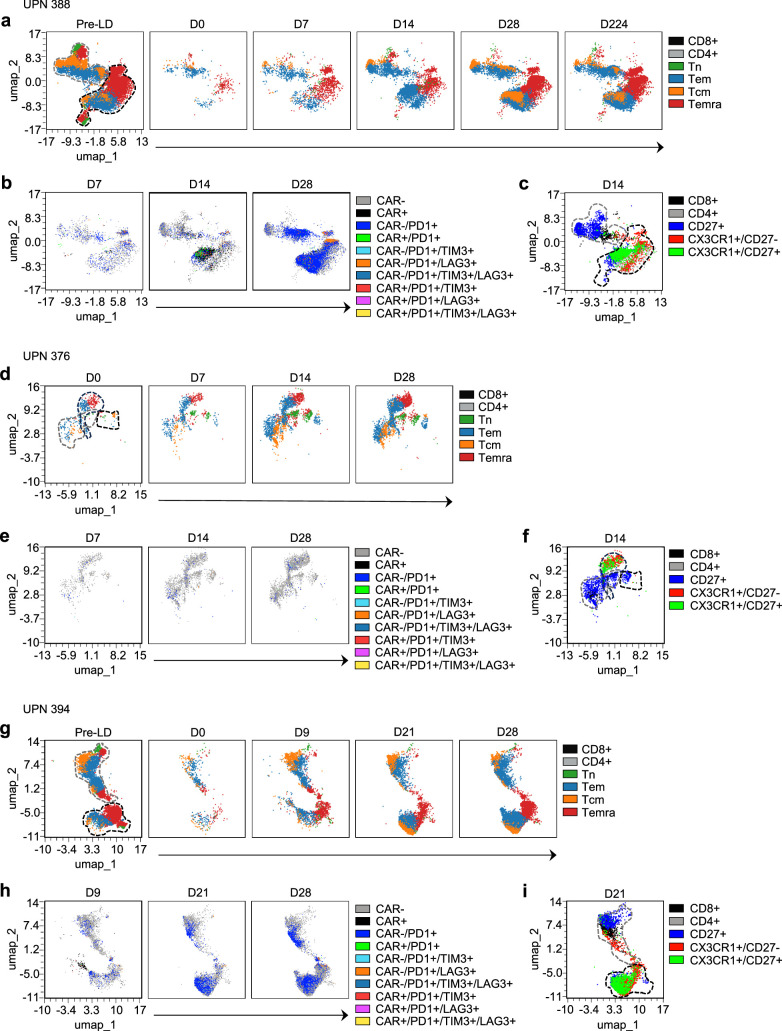
Despite recent therapeutic advances, metastatic castration-resistant prostate cancer (mCRPC) remains lethal. Chimeric antigen receptor (CAR) T cell therapies have demonstrated durable remissions in hematological malignancies. We report results from a phase 1, first-in-human study of prostate stem cell antigen (PSCA)-directed CAR T cells in men with mCRPC. The starting dose level (DL) was 100 million (M) CAR T cells without lymphodepletion (LD), followed by incorporation of LD. The primary end points were safety and dose-limiting toxicities (DLTs). No DLTs were observed at DL1, with a DLT of grade 3 cystitis encountered at DL2, resulting in addition of a new cohort using a reduced LD regimen + 100 M CAR T cells (DL3). No DLTs were observed in DL3. Cytokine release syndrome of grade 1 or 2 occurred in 5 of 14 treated patients. Prostate-specific antigen declines (>30%) occurred in 4 of 14 patients, as well as radiographic improvements. Dynamic changes indicating activation of peripheral blood endogenous and CAR T cell subsets, TCR repertoire diversity and changes in the tumor immune microenvironment were observed in a subset of patients. Limited persistence of CAR T cells was observed beyond 28 days post-infusion. These results support future clinical studies to optimize dosing and combination strategies to improve durable therapeutic outcomes. ClinicalTrials.gov identifier NCT03873805 .


Conflict of interest statement

T.B.D. is a consultant for AstraZeneca and Janssen. S.J.P. and S.J.F. are scientific advisors to and receive royalties from Mustang Bio. S.J.P. is also a scientific advisor and/or receives royalties from Imugene, Adicet Bio, Port Therapeutics and Celularity. S.J.P. and S.J.F. are listed as co-inventors on a patent on chimeric antigen receptors targeted to PSCA, which is owned by the City of Hope. The other authors declare no competing interests.

Figures

Fig. 1
Fig. 1. Clinical trial design and CONSORT diagram.
a, Illustration of clinical trial design, including participant screening, leukapheresis, PSCA-CAR T cell manufacturing, pre-infusion biopsy (BX), peripheral blood (PB) sample collection before LD, bone scan and CT imaging, Flu/Cy LD, PSCA-CAR T cell infusion, serial PB sample collection time points from day 0 to day 28, post-infusion bone scan and CT imaging, post-infusion BX and long-term follow up (LTFU). b, CONSORT diagram detailing participants consented and screened for PSCA expression by immunohistochemistry (IHC) (n = 58), participants enrolled and leukapheresis (n = 22), participants received CAR T cell infusion (n = 14). DL cohorts, including DL1 (100 M PSCA-CAR T cells, n = 3), DL2 (Flu/Cy LD + 100 M PSCA-CAR T cells, n = 6) and DL3 (reduced Flu/Cy LD + 100 M PSCA-CAR T cells, n = 5). CT, computed tomography. Source data
Fig. 2
Fig. 2. Treatment response following PSCA-CAR T cell infusion.
a, PSA waterfall plot showing best PSA response in the 28 days following CAR T cell infusion at each DL. b, Swimmer’s plot depicting response to treatment and follow up for each participant on study. PI, principal investigator. c, CT scan of a patient (UPN394) in DL3 showing liver metastases before infusion and disease response 1 month after infusion of PSCA-CAR T cells. Source data
Fig. 3
Fig. 3. CAR T cell kinetics and serum cytokine analysis.
a, Flow cytometric analysis of PSCA-CAR T cells (%) within CD3+ T cells in the PB for each individual. b, PSCA-CAR T cells in PB detected by quantitative PCR of WPRE copies per μg DNA. Data shown are 95% confidence limits for the mean differences of the three DLs in log10 maximum copy number per μg of DNA. c, Box plots of relative cytokine levels for each participant grouped by CRS grade 0 or 1/2. d, Box plots of relative cytokine levels for each individual grouped by PSA response <0 or >0. Data are from n = 14 and presented as mean values ± s.e.m. P values indicate differences between groups using a two-tailed Student’s t-test. NS, not significant. Source data
Fig. 4
Fig. 4. Patient with biochemical and radiographic response with associated immune landscape changes.
a, PSA response in UPN388 on DL2 before and through the 28 days following PSCA-CAR T cell infusion and at day 90. b, Bone scintigraphy (anterior–posterior view) for bone metastases detection before and 1 month after PSCA-CAR T cell infusion in the same patient. Red asterisks denote representative bone metastases. c, HDSCA of CTCs in the bone marrow before and 1 month after infusion of PSCA-CAR T cells. Quantification of CK+ cells per ml is shown in the gray box. d, Immunofluorescence images of bone metastasis biopsy samples from before (top) and 1 month after PSCA-CAR T cell infusion (bottom), evaluating expression of pan-CK (tumor cells), PD-L1, CD3 (T cells), CD8 (effector cells) and Granzyme B (GzmB). Indicated areas of tumor and stromal regions and arrows indicate residual tumor cells in post-infusion sample. Images shown are representative of the whole evaluable tissue region on slide. DAPI, 4,6-diamidino-2-phenylindole. e, CT scan of pancreatic lesion in UPN388 before and 1 month after PSCA-CAR T cell infusion. Red circles denote pancreatic lesion around stent. Measured size of lesion before infusion, 40.2 × 24.8 mm. The lesion regressed 1 month after infusion and was not measurable. f, scRNA-seq analysis of CD3+ T cell subsets in the infused product and in PB T cells at the indicated time points after T cell infusion. g, Single-cell analysis of TCRα/β repertoire diversity in PB T cells at the indicated time points after T cell infusion. Top 40 clonotypes with the greatest fractions at day 28. Source data
Extended Data Fig. 1
Extended Data Fig. 1. PSCA-CAR T cell product characterization.
(a) Flow cytometric analysis of expression of CD3, CD4, CD8, CD19 (CD19t transduction marker), Fc (extracellular spacer domain in CAR) in CAR T cell manufactured products (individual dots are a single patient product). (b) Analysis of T cell subsets (Tn: CD62L + /CD45RA+ naïve, Tcm: CD62L + /CD45RA- central memory, Tem: CD62L-/CD45RA- effector memory, and Temra: CD62L-/CD45RA+ terminally differentiated effector memory) in CAR T cell manufactured products. Data are from n = 14. Source data
Extended Data Fig. 2
Extended Data Fig. 2. Serum cytokine analysis.
Heat map showing relative fold change from baseline to peak cytokine levels of G-CSF, IFNy, IL-2R, IL-4, IL-6, IL-8, and IP-10 in each subject on study. Source data
Extended Data Fig. 3
Extended Data Fig. 3. Serum cytokines and chemistry in UPN388.
(a) Serum cytokine analysis for UPN388. (b-g) Quantification of white blood cells (WBCs) (b), lymphocytes (%) (c), C-reactive protein (CRP) (d), ALT/AST (e), lactate dehydrogenase (LDH) (f), and alkaline phosphatase (g) in serum for UPN388. Source data
Extended Data Fig. 4
Extended Data Fig. 4. Analysis of UPN388 bone metastasis biopsy.
(a) H&E (top) and PSCA IHC (bottom), and (b) immunofluorescence imaging before infusion and 1 month after infusion of PSCA-CAR T cells. Images shown are representative of the whole evaluable tissue region on slide. Source data
Extended Data Fig. 5
Extended Data Fig. 5. T cell infiltration and PD-L1 expression in biopsies.
Quantification of CD8+ (a) and PD-L1+ (b) areas in biopsies by immunofluorescence imaging. Data shown includes all evaluable tissue on slide. Source data
Extended Data Fig. 6
Extended Data Fig. 6. Flow cytometric analysis of peripheral blood CD8 + PD-1 + CAR and non-CAR T cells in UPN388, UPN375, and UPN394.
(a) Flow cytometric analysis of peripheral blood T cells pre- and post-CAR T cell infusion for UPN388. Populations are categorized as CD8+, CD4+, and T cell subsets (Tn: CD62L + /CD45RA+ naïve, Tcm: CD62L + /CD45RA- central memory, Tem: CD62L-/CD45RA- effector memory, and Temra: CD62L-/CD45RA+ terminally differentiated effector memory). (b) Expression of PD-1, LAG3, and TIM3 on non-CAR (CAR-) and CAR + T cells at indicated time points. (c) Expression of CX3CR1 and CD27 at day 14 post-CAR T cell infusion. (d-f) Same as (a-c) for UPN375 (DL1). (g-i) Same as (a-c) for UPN394 (DL3). Source data
Extended Data Fig. 7
Extended Data Fig. 7. Single-cell analysis of CD3 + T cell subsets and TCRα/β repertoire diversity in the peripheral blood.
(a) scRNA-seq analysis of CD3 + T cell subsets in the infused product and in the peripheral blood T cells at indicated time points post-T cell infusion of UPN375. (b) Single-cell analysis of TCRα/β repertoire diversity in the peripheral blood T cells of UPN375 at indicated time points post-T cell infusion. (c-d) Same as (a-b) for UPN394. (e) Legend for Fig. 4g. (f) Legend for Extended Data Fig. 7b. (g) Legend for Extended Data Fig. 7d. Source data
Extended Data Fig. 8
Extended Data Fig. 8. TCR repertoire diversity in peripheral blood T cells.
Number of cells per clonotype at day 0 versus day 28 following therapy in UPN388 (a), UPN375 (b), and UPN394 (c). Source data

References

    1. Siegel RL, Miller KD, Fuchs HE, Jemal A. Cancer statistics, 2021. CA Cancer J. Clin. 2021;71:7–33. doi: 10.3322/caac.21654. - DOI - PubMed
    1. Higano CS, et al. Phase 1-2 dose-escalation study of a GM-CSF-secreting, allogeneic, cellular immunotherapy for metastatic hormone-refractory prostate cancer. Cancer. 2008;113:975–984. doi: 10.1002/cncr.23669. - DOI - PubMed
    1. Gulley JL, et al. Phase III trial of PROSTVAC in asymptomatic or minimally symptomatic metastatic castration-resistant prostate cancer. J. Clin. Oncol. 2019;37:1051–1061. doi: 10.1200/JCO.18.02031. - DOI - PMC - PubMed
    1. Antonarakis ES, et al. Pembrolizumab for treatment-refractory metastatic castration-resistant prostate cancer: multicohort, open-label phase II KEYNOTE-199 study. J. Clin. Oncol. 2020;38:395–405. doi: 10.1200/JCO.19.01638. - DOI - PMC - PubMed
    1. Kwon ED, et al. Ipilimumab versus placebo after radiotherapy in patients with metastatic castration-resistant prostate cancer that had progressed after docetaxel chemotherapy (CA184-043): a multicentre, randomised, double-blind, phase 3 trial. Lancet Oncol. 2014;15:700–712. doi: 10.1016/S1470-2045(14)70189-5. - DOI - PMC - PubMed

Publication types

MeSH terms

Associated data