. 2024 Jun 12;7(1):725.
doi: 10.1038/s42003-024-06414-z.

Polyester degradation by soil bacteria: identification of conserved BHETase enzymes in Streptomyces

Affiliations

Polyester degradation by soil bacteria: identification of conserved BHETase enzymes in Streptomyces

Jo-Anne Verschoor et al. Commun Biol. .

Abstract

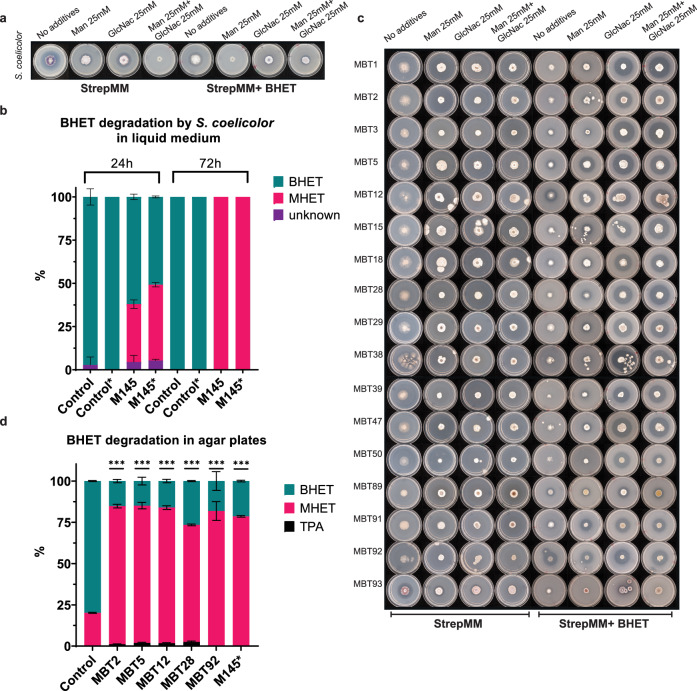
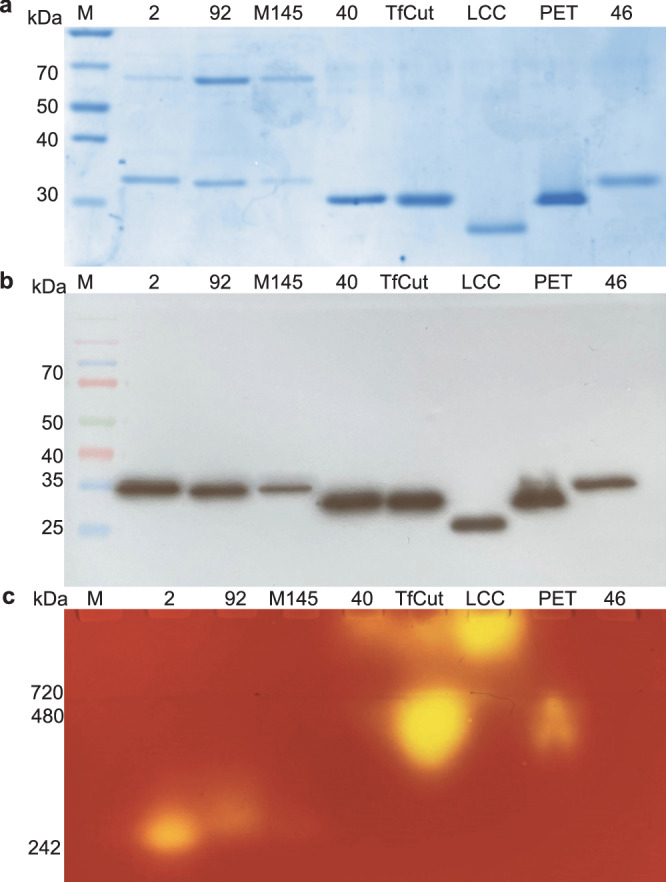
The rising use of plastic results in an appalling amount of waste which is scattered into the environment. One of these plastics is PET which is mainly used for bottles. We have identified and characterized an esterase from Streptomyces, annotated as LipA, which can efficiently degrade the PET-derived oligomer BHET. The Streptomyces coelicolor ScLipA enzyme exhibits varying sequence similarity to several BHETase/PETase enzymes, including IsPETase, TfCut2, LCC, PET40 and PET46. Of 96 Streptomyces strains, 18% were able to degrade BHET via one of three variants of LipA, named ScLipA, S2LipA and S92LipA. SclipA was deleted from S. coelicolor resulting in reduced BHET degradation. Overexpression of all LipA variants significantly enhanced BHET degradation. All variants were expressed in E. coli for purification and biochemical analysis. The optimum conditions were determined as pH 7 and 25 °C for all variants. The activity on BHET and amorphous PET film was investigated. S2LipA efficiently degraded BHET and caused roughening and indents on the surface of PET films, comparable to the activity of previously described TfCut2 under the same conditions. The abundance of the S2LipA variant in Streptomyces suggests an environmental advantage towards the degradation of more polar substrates including these polluting plastics.


Conflict of interest statement

The authors declare no competing interests.

Figures

Fig. 1
Fig. 1. Sequence comparison of ScLipA with several PHEs.
a Sequence comparison of ScLipA with PET40, TfCut2, LCC, and the IsPETase indicating the binding sites with yellow asterisks and highlights and the catalytic triad highlighted in orange with orange asterisks. The percent identity was displayed behind the alignments. b Predicted model of the structure of ScLipA constructed with AlphaFold (blue) overlayed with the structure of PET40 as provided by PDB (8A2C). The catalytic triads are enlarged and shown in green (ScLipA) and orange (PET40). The enlarged binding domains are displayed in cyan (ScLipA) and yellow (PET40).
Fig. 2
Fig. 2. The ability of S. coelicolor M145 and other Streptomycetes to degrade BHET.
a Degradation of BHET by S. coelicolor after 18 days of growth on StrepMM Difco agar with and without Mannitol, BHET, and GlcNAc. b The degradation of BHET by S. coelicolor in liquid medium (n = 3). The control samples are displayed as control and only contain NMM with BHET [10 mM]. The addition of GlcNAc [25 mM] to the cultures is indicated with an asterisk. The area percentages were calculated using GraphPad. The areas are presented in percentage compounds present in the culture. BHET is indicated in turquoise and MHET is indicated in magenta. Some impurities are present as a peak around 9.5 min retention time, this compound is called unknown and is presented in purple. c Individual screen of all active strains on StrepMM Difco agar with and without mannitol, BHET, and GlcNAc after 10 days of growth. d Analysis of BHET degradation in agar plugs after 15 days of growth using LC-MS. The area percentage was calculated using GraphPad. *The agar plug of M145 was taken after 18 days. BHET is indicated in turquoise and MHET is indicated in magenta, TPA is represented in black. The statistical significance of the BHET degradation compared to the control is indicated with three asterisks. All error bars display the standard deviation, n = 3, and ***p < 0,0001. Individual data points are shown in Supplementary Fig. 4.
Fig. 3
Fig. 3. Comparison of the Lipase A variants.
a Sequence comparison of the ScLipA, S2LipA, and S92LipA indicating the binding residues with yellow asterisks/highlight and the catalytic triad with orange asterisks/highlight. Sequence differences from the different lipases are highlighted in gray, when only one sequence differs, the conserved amino acids are highlighted in black. bd Predicted model of the structure of ScLipA (b), S2LipA (c) and S92LipA (d) constructed with AlphaFold 2. The catalytic triad residues are displayed in green and the binding domain residues are displayed in cyan.
Fig. 4
Fig. 4. Expression of the LipA variants in S. coelicolor M145 ΔlipA in NMM and TSBS medium.
a SDS-PAGE of concentrated samples on NMM medium, faint band around ~32 kDa in the overexpression strains, this band is not present in wild-type strain M145. b Western blot of NMM samples showing clear signal around ~32 kDa. c Analysis of BHET degradation in NMM of the wild-type strain, ΔlipA, S3, S5, and S7 using LC-MS (n = 3). Samples were taken at 24 h, 48 h and 72 h. The percentage of BHET is presented in turquoise, the percentage of MHET in magenta, and the percentage of TPA in black. The area percentage was calculated using GraphPad. d SDS-PAGE of concentrated samples on TSBS medium, a faint band around ~32 kDa was observed in the overexpression strains this band was not present in wild-type strain M145. e Western blot of TSBS samples showing a clear signal around 32 kDa. f Analysis of BHET degradation in TSBS of the wild-type strain, ΔlipA, S3, S5 and S7 using LC-MS. Samples were taken at 24 h, 48 h and 72 h. The percentage of BHET is presented in turquoise, the percentage of MHET in magenta, and the percentage of TPA in black. The error bars display the standard deviation. All original gel pictures are shown in Supplementary Fig. 8. The graphs containing all individual data points are shown in Supplementary Fig. 9.
Fig. 5
Fig. 5. Time-lapse images of BHET degradation by S. coelicolor M145, ΔlipA, S3, S5, and S7.
Time-lapse images at 5-h intervals of wild-type and ΔlipA mutant and overexpression strains S3, S5, and S7 in the presence of BHET particles (diamond-shaped particles). A negative control lacking bacterial inoculation was used to demonstrate that the BHET particles do not undergo natural degradation over time (indicated as control). The scale bar in the top right corner is 10 µm.
Fig. 6
Fig. 6. Expression and purification of Lipase A enzymes in E. coli.
a SDS-PAGE of the purified Lipase A variants, along with the PET40 (40), TfCut2, LCC, IsPETase (PET) and PET46 (46); 1: Ladder, multicolor broad range protein ladder; 2: S2LipA sample (30 kDa); 3: S92LipA (30 kDa); 4: ScLipA (30 kDa), 5: PET40 (28 kDa), 6: TfCut2 (28 kDa), 7: LCC (27 kDa), IsPETase (27 kDa), 8: PET46 (30 kDa). The Lipase variants show two bands one around 60 kDa and one around 35 kDa. b Western blot using a His-antibody was conducted to identify the purified enzymes of the Lipase A variants. 1: ladder, Spectra multicolor broad range protein marker; 2 till 8: same samples as for the SDS-PAGE c Zymogram of 750 ng of purified enzymes and LipA variants on 1% tributyrin. The Lipase A variants, PET40, TfCut2, LCC, and PETase show degradation of tributyrin (yellow spots). NativeMarker used as a marker and visualized by overlaying Native SDS-PAGE with a zymogram. All original gel pictures are shown in Supplementary Fig. 10.
Fig. 7
Fig. 7. Determination of optimal enzyme conditions and BHET degradation under optimum conditions.
ac Relative activity on para-nitrophenol dodecanoate at different pH for S2LipA (a), S92LipA (b) and ScLipA (c) (n = 3). The graphs are overlays of the graph containing the error bars and the same graph with the individual data points original graphs are displayed as Supplementary Fig. 13. d Enzymatic BHET degradation using colorimetric assay after 24 and 48 h. The activity of buffer control (black) as a negative control, S2LipA (magenta) S92LipA (turquoise), and ScLipA (dark purple), the positive controls are displayed as PET40 (lavender), TfCut2 (light blue) LCC (black), PET46 (dark blue), and IsPETase (purple). The activity was displayed as the concentration of BHET degraded in mM. The indicated significance displays the significant difference with the buffer (n = 3). The error bars display the standard deviation, ***p < 0,0001.
Fig. 8
Fig. 8. Effect of IsPETase, TfCut2, S2LipA, S92LipA, and ScLipA on amorphous PET film.
Amorphous PET films after 7 days of incubation with 15 µg/ml enzyme at 25 °C pH 7 at 1000–10.000× magnification. The scalebars in the left panels are equal to 1 µm and apply to all images of the same magnification. Each row displays a different magnification whereas the columns show a different enzyme of incubation.

Similar articles

Cited by

References

    1. Geyer R, Jambeck JR, Law KL. Production, use, and fate of all plastics ever made. Sci. Adv. 2017;3:e1700782. doi: 10.1126/sciadv.1700782. - DOI - PMC - PubMed
    1. Verschoor J-A, Kusumawardhani H, Ram AFJ, de Winde JH. Toward microbial recycling and upcycling of plastics: prospects and challenges. Front. Microbiol. 2022;0:701. - PMC - PubMed
    1. Plastics Europe. Plastics the Facts2023. https://plasticseurope.org/knowledge-hub/plastics-the-fast-facts-2023/ (2023).
    1. Walker TR, Fequet L. Current trends of unsustainable plastic production and micro(nano) plastic pollution. TrAC Trends Anal. Chem. 2023;160:116984. doi: 10.1016/j.trac.2023.116984. - DOI
    1. Bahl S, Dolma J, Singh JJ, Sehgal S. Biodegradation of plastics: a state of the art review. Mater. Today Proc. 2021;39:31–34. doi: 10.1016/j.matpr.2020.06.096. - DOI

Publication types

MeSH terms