

Prevalence of self-reported hearing difficulty on the Revised Hearing Handicap Inventory and associated factors
- PMID: 38867166
- PMCID: PMC11167844
- DOI: 10.1186/s12877-024-04901-w
Prevalence of self-reported hearing difficulty on the Revised Hearing Handicap Inventory and associated factors
Abstract
Background: Hearing loss is common in aging adults and is an important public health concern. Self-reported measures of hearing difficulty are often used in research and clinical practice, as they capture the functional impacts of hearing loss on individuals. However, little research has evaluated the prevalence or factors associated with self-reported hearing difficulty. Therefore, the purpose of this study was to determine the prevalence of self-reported hearing difficulty, measured by the Revised Hearing Handicap Inventory (RHHI), and associated factors.
Methods: This study was conducted in a community-based cohort study based in Charleston, SC. We determined the prevalence of RHHI self-reported hearing difficulty (score ≥ 6 points) and evaluated associated factors with logistic regression models. Results are presented as odds ratios (OR) with corresponding 95% confidence intervals (95% CI).
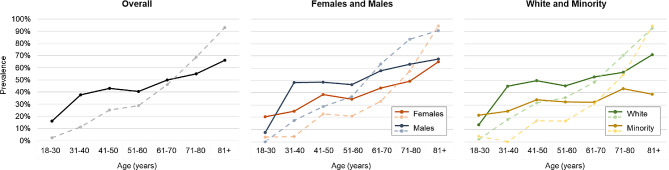
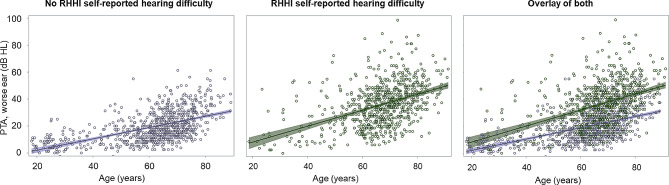
Results: There were 1558 participants included in this study (mean age 63.7 [SD 14.4], 56.9% female, 20.0% Minority race). The prevalence of RHHI self-reported hearing difficulty was 48.8%. In a multivariable model, older age (per + 1 year; OR 0.97 [95% CI 0.96, 0.98]), Minority (vs. White) race (OR 0.68 [95% CI 0.49, 0.94]), and speech-in-noise scores that are better than predicted (OR 0.99 [95% CI 0.98, 1.00]) were associated with lower odds of RHHI self-reported hearing difficulty. Furthermore, female (vs. male) sex (OR 1.39 [95% CI 1.03, 1.86]), higher PTA in the worse ear (per + 1 dB; OR 1.10 [95% CI 1.09, 1.12]), more comorbid conditions (vs. 0; 1 condition: OR 1.50 [95% CI 1.07, 2.11]; 2 conditions: OR 1.96 [95% CI 1.32, 2.93]; 3 + conditions: OR 3.00 [95% CI 1.60, 5.62]), noise exposure (OR 1.54 [95% CI 1.16, 2.03]), bothersome tinnitus (OR 2.16 [95% CI 1.59, 2.93]), and more depressive symptoms (OR 1.04 [95% CI 1.01, 1.07]) were associated with higher odds of RHHI self-reported hearing difficulty.
Conclusions: The prevalence of RHHI self-reported hearing difficulty is high, and associated factors included demographics, audiometric hearing and other hearing-related factors, and physical and mental health. The RHHI likely captures functional impacts of hearing loss that are not captured by audiometry alone. Study findings can support the correct interpretation of the RHHI in research and clinical settings.
Keywords: Audiology; Cohort study; Demographics; Hearing loss; Patient reported outcome measures; Self-report.
© 2024. The Author(s).
Conflict of interest statement
Authors have no competing interests to declare.
Figures
References
-
- Dillard LK, Pinto A, Mueller KD, Schubert CR, Paulsen AJ, Merten N, Fischer ME, Tweed TS, Cruickshanks KJ. Associations of hearing loss and hearing aid use with cognition, health-related quality of life, and depressive symptoms. J Aging Health. 2023;35(7–8):455–65. doi: 10.1177/08982643221138162. - DOI - PMC - PubMed
-
- Hickson L, Allen J, Beswick R, Fulton M, Wolf D, Worrall L, Scarinci N. Relationships between hearing disability, quality of life and wellbeing in older community-based australians. Aust N Z J Audiol. 2008;30(2):99–111. doi: 10.1375/audi.30.2.99. - DOI
MeSH terms
Grants and funding
LinkOut - more resources
Full Text Sources
Miscellaneous
