. 2024 Jun 12;29(1):87.
doi: 10.1186/s11658-024-00600-x.

APOE2 protects against Aβ pathology by improving neuronal mitochondrial function through ERRα signaling

Affiliations

APOE2 protects against Aβ pathology by improving neuronal mitochondrial function through ERRα signaling

Zhiyuan Ning et al. Cell Mol Biol Lett. .

Abstract

Background: Alzheimer's disease (AD) is a progressive neurodegenerative disease and apolipoprotein E (APOE) genotypes (APOE2, APOE3, and APOE4) show different AD susceptibility. Previous studies indicated that individuals carrying the APOE2 allele reduce the risk of developing AD, which may be attributed to the potential neuroprotective role of APOE2. However, the mechanisms underlying the protective effects of APOE2 is still unclear.

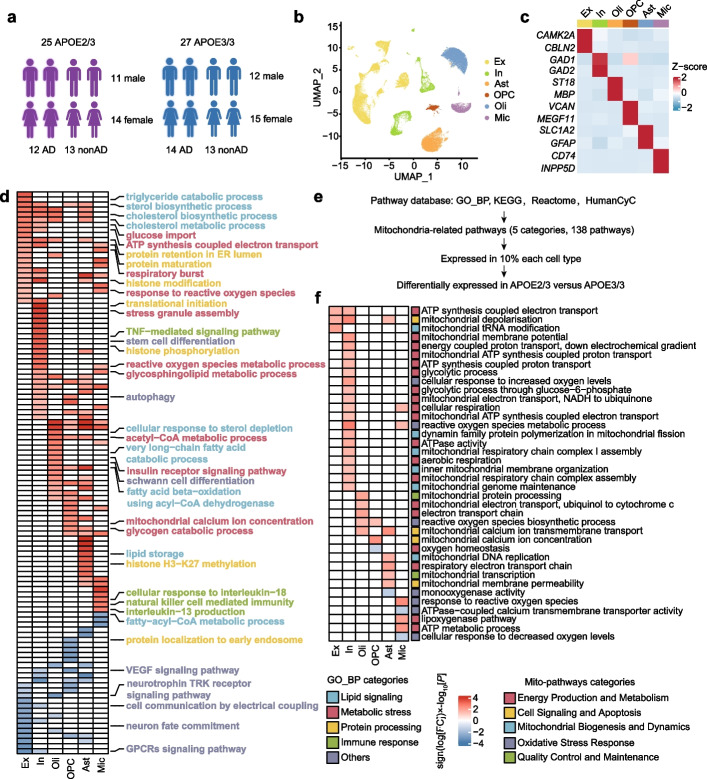
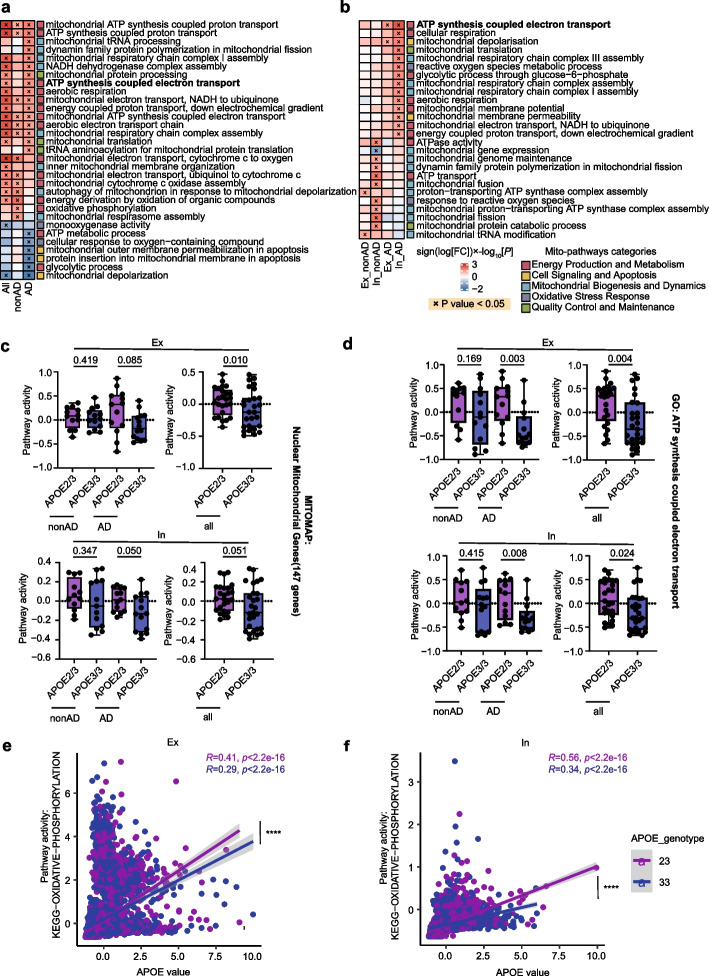
Methods: We analyzed single-nucleus RNA sequencing and bulk RNA sequencing data of APOE2 and APOE3 carriers from the Religious Orders Study and Memory and Aging Project (ROSMAP) cohort. We validated the findings in SH-SY5Y cells and AD model mice by evaluating mitochondrial functions and cognitive behaviors respectively.

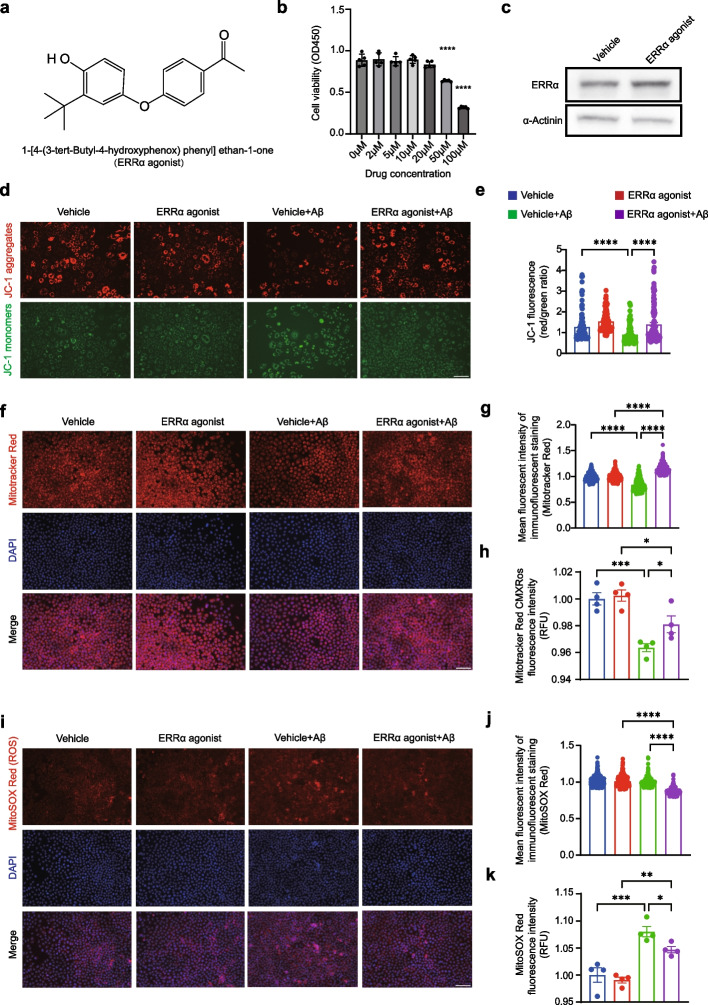
Results: The pathway analysis of six major cell types revealed a strong association between APOE2 and cellular stress and energy metabolism, particularly in excitatory and inhibitory neurons, which was found to be more pronounced in the presence of beta-amyloid (Aβ). Moreover, APOE2 overexpression alleviates Aβ1-42-induced mitochondrial dysfunction and reduces the generation of reactive oxygen species in SH-SY5Y cells. These protective effects may be due to ApoE2 interacting with estrogen-related receptor alpha (ERRα). ERRα overexpression by plasmids or activation by agonist was also found to show similar mitochondrial protective effects in Aβ1-42-stimulated SH-SY5Y cells. Additionally, ERRα agonist treatment improve the cognitive performance of Aβ injected mice in both Y maze and novel object recognition tests. ERRα agonist treatment increased PSD95 expression in the cortex of agonist-treated-AD mice.

Conclusions: APOE2 appears to enhance neural mitochondrial function via the activation of ERRα signaling, which may be the protective effect of APOE2 to treat AD.

Keywords: Alzheimer's disease; Apolipoprotein E; Beta-amyloid (Aβ); ESRRA; Mitochondria; Neuron.


Conflict of interest statement

The authors declare that they have no competing interests.

Figures

Fig. 1
Fig. 1
APOE2 single-nucleus profiling and pathway-level alterations. a Detailed information of APOE carriers from The Religious Orders Study and Memory and Aging Project (ROSMAP) (Created with https://www.biorender.com). b The UMAP plot displayed six main cell types in DLPFC. Ex: excitatory neurons; In: inhibitory neurons; Oli: oligodendrocytes; OPC: oligodendrocyte precursor cells; Ast: astrocytes; Mic: microglia. c Heatmap showed the expression of representative marker genes in each cell type. d Heatmap showed top Gene Ontology biological processes with expression changes associated with APOE2 (nominal P < 0.05, linear model, APOE32/3 versus APOE3/3), with red indicating APOE2 upregulation and blue indicating APOE2 downregulation. The color scale represented sign (log [FC]) × log10[P] values. e The curation process of mitochondrion-associated pathways, GO_BP, GO_Biological_Process_2021 database; KEGG, KEGG_2021_Human database; Reactome: Reactome_2022 database; HumanCyc: HumanCyc_2016 database. f Heatmap showed mitochondrion-associated pathways altered across major six cell types in APOE2 versus APOE3 individual (nominal P < 0.05, linear model). Red indicated APOE2 upregulation and blue indicated APOE2 downregulation. The color scale represents sign (log [FC]) × log10[P] values. Pathways with absolute value of sign (log [FC]) × log10[P] > 1.3 were shown in the heatmap
Fig. 2
Fig. 2
APOE2 drives mitochondrial changes in neurons especially when accompanied by AD pathology. a, b Heatmap showed mitochondrion-associated pathways altered in APOE2 versus APOE3 brain in bulk RNA-seq (a) and altered in excitatory and inhibitory neurons in APOE2 versus APOE3 individuals (b) stratified by amyloid. Red indicated APOE2 upregulation and blue indicated APOE2 downregulation. The color scale represents sign (log [FC]) × log10[P] values. P < 0.05 indicated (x). c, d Box plots showed pathway activity scores for ‘MITOMAP: Nuclear Mitochondrial Genes (147 genes associated with mitochondrion)’ (c) and for ‘GO: ATP synthesis coupled electron’(d) stratified by APOE genotype and/or AD pathology (nominal P-values, linear model). Boxplots indicates median, 25th and 75th percentiles. e Correlation analysis between oxidative phosphorylation pathway scores and the APOE expression values in excitatory neurons (Ex, APOE2: R = 0.41, P < 2.2e−16; APOE2: R = 0.29, P = 2.2e−16), with APOE2 excitatory neurons demonstrating a more significant correlation in comparison to APOE3 (z = 5.7837, P = 0.0000); ****P < 0.0001. f Correlation analysis between oxidative phosphorylation pathway scores and the APOE expression values in inhibitory neurons (In, APOE2: R = 0.56, P < 2.2e−16; APOE2: R = 0.34, P = 2.2e−16), with APOE2 inhibitory neurons demonstrating a more significant correlation in comparison to APOE3 (Z = 11.7636, P = 0.0000); ****P < 0.0001
Fig. 3
Fig. 3
APOE2 alters mitochondrial functions in Aβ1-42 stimulated SH-SY5Y cells. a Experimental design for detecting mitochondrial functions of overexpressed APOE2 or APOE3 in Aβ1-42 or vehicle treated SH-SY5Y cells (Created with https://www.biorender.com). b Representative fluorescence images of JC-1in Aβ1-42 or vehicle treated SH-SY5Y cells. JC-1 aggregates (red) and monomers (green) distributions after loading with JC-1 (1 μg/ml). Scale bars, 100 μm. c Ratios of the fluorescence intensities of JC-1 labelling. JC-1 aggregates and JC-1 monomers were measured by average cell fluorescence intensity by fluorescence microscopy. d Representative fluorescence images of mitochondrial membrane potential (MMP) in SH-SY5Y cells using end-point assay. DAPI (blue) and MitoTracker (red). Scale bars, 100 μm. e, f Quantification of MMP using MitoTracker-Red fluorescent probes. The MMP was measured by average cell fluorescence intensity by fluorescence microscopy (e) and fluorescence light intensity tested by fluoresce microplate reader (f). g. Representative fluorescence images of mitochondrial levels of reactive oxygen species (ROS) in SH-SY5Y cells. DAPI (Blue) and MitoSox (Red). Scale bars, 100 μm. h, i. Quantification of mitochondrial ROS levels using MitoSox-Red fluorescent probes. The ROS level was measured by average cell fluorescence intensity by fluorescence microscopy (h) and fluorescence light intensity tested by fluoresce microplate reader (i). c, e, h Data are presented as the mean ± S.E. The experiment had three independent biological replicates (Kruskal-Wallis test). *P < 0.05; ***P < 0.001; ****P < 0.0001. f, i Data are presented as the mean ± S.E. The experiment had three independent biological replicates (One-way ANOVA). *P < 0.05; ***P < 0.001; ****P < 0.0001
Fig. 4
Fig. 4
ApoE2 interacts with ERRα. a SCENIC analysis of different transcription factors (TFs) activity between APOE2 versus APOE3 neurons under AD pathology (adjusted. P value < 0.05). b The predicted target genes of ESRRA. c The distribution of ESRRA gene expression in dorsolateral prefrontal cortex (DLPFC). d Co-localization of the ERRα protein (green) with the neuronal marker NeuN (red) in mouse cortex. Scale bars, 100 μm for low magnification, 25 μm for high magnification. e Co-localization of the ERRα protein (green) with ApoE (red) in mouse cortex. Scale bars, 100 μm for low magnification, 25 μm for high magnification. f, g Binding mode of ApoE2 (e) or ApoE3 (f) and ERRα predicted by HDOCK. Left: overall structure of ApoE2 or ApoE3 bound to ERRα in cartoon view. ApoE2, ApoE3, and ERRα were colored in pink, dark green, and orange, respectively. Right: detailed interaction network between ApoE2 or ApoE3 and ERRα. Key residues of ApoE2 (pink) or ApoE3 (green) and ERRα (orange) were displayed as sticks. H-bonds are displayed in black dashed lines, and the distances (acceptor to donor heavy atom) of H-bonds are labeled. h, i Co-IP indicating the direct bind of ERRα protein and ApoE2 protein in HEK-293 T cells (h) and hAPOE2-TR mouse cortex (i). j Representative immunoblotting images of ERRα protein expression after APOE2 or APOE3 plasmid transfection and Aβ1-42 stimulation. Data were presented as the mean ± S.E.M. The experiment had three independent biological replicates (One-way ANOVA); *P < 0.05; **P < 0.01. k The correlation between ESRRA activity and CERAD pathology between APOE genotypes in Ex-PYR neurons (APOE2: R = 0.0073, P = 0.88; APOE3: R = 0.14, P = 0.00053). A significant difference between these two groups was confirmed through Cocor (Z = -2.1449, P = 0.0320); *P < 0.05. l The correlation between ESRRA activity and CERAD pathology between APOE genotypes in In-PV (Basket) neurons (APOE2: R = -0.053, P = 0.3; APOE3: R = 0.11, P = 0.023). A significant difference between these two groups was confirmed through Cocor (Z = -2.2957, P = 0.0217); *P < 0.05
Fig. 5
Fig. 5
ESRRA overexpression affects mitochondrial function in Aβ1-42-stimulated SH-SY5Y cells. a Representative fluorescence images of JC-1 in SH-SY5Y cells. JC-1 aggregates (red) and monomers (green) distributions after loading with JC-1 (1 μg/ml) probes. Scale bars, 100 μm. b Ratios of the fluorescence intensities of JC-1 labelling. JC-1 aggregates and JC-1 monomers were measured by average cell fluorescence intensity by fluorescence microscopy. c Representative fluorescence images of MMP in SH-SY5Y cells. DAPI (blue) and MitoTracker (red). Scale bars, 100 μm. d, e Quantification of MMP using MitoTracker-Red fluorescent probes. The MMP was measured by average cell fluorescence intensity by fluorescence microscopy (d) and fluorescence light intensity tested by fluoresce microplate reader (e). f Representative fluorescence images of mitochondrial levels of ROS in SH-SY5Y cells. DAPI (blue) and MitoSox (red). Scale bars, 100 μm. g, h Quantification of mitochondrial ROS levels using MitoSox-Red fluorescent probes. The ROS level was measured by average cell fluorescence intensity by fluorescence microscopy (g) and fluorescence light intensity tested by fluoresce microplate reader (h). e, h Data are presented as the mean ± S.E. The experiment had three independent biological replicates (Kruskal-Wallis test). *P < 0.05; ***P < 0.001; ****P < 0.0001. b, d, g Data were presented as the mean ± S.E. The experiment had three independent biological replicates (One-way ANOVA); *P < 0.05; ****P < 0.0001
Fig. 6
Fig. 6
ERRα agonist alters mitochondrial functions in Aβ1-42 stimulated SH-SY5Y cells. a The structural formula of 1-[4-(3-tert-Butyl-4-hydroxyphenox) phenyl] ethan-1-one (ERRα agonist). b Cell viability of SH-SY5Y cells treated with ERRα agonist at indicated concentrations was determined by CCK8 assay. c Representative immunoblotting images of ERRα protein expression after agonist treatment in SH-SY5Y cells. d Representative fluorescence images of JC-1. JC-1 aggregates (red) and monomers (green) distributions after loading with JC-1 (1 μg/ml). Scale bars, 100 μm. e Ratios of the fluorescence intensities of JC-1 labelling. JC-1 aggregates and JC-1 monomers were measured by average cell fluorescence intensity by fluorescence microscopy. f Representative fluorescence images of end-point MMP in SH-SY5Y cells. DAPI (blue) and MitoTracker (red). Scale bars, 100 μm. g, h Quantification of MMP using MitoTracker-Red fluorescent probes. The MMP was measured by average cell fluorescence intensity by fluorescence microscopy (g) and fluorescence light intensity tested by fluoresce microplate reader (h). i Representative fluorescence images of mitochondrial ROS levels in SH-SY5Y cells. DAPI (blue) and MitoSox (red). Scale bars, 100 μm. j, k Quantification of mitochondrial ROS levels using MitoSox-Red fluorescent probes. The ROS level was measured by average cell fluorescence intensity by fluorescence and fluorescence light intensity tested by fluoresce microplate reader. e, g, j Data were presented as the mean ± S.E. The experiment had three independent biological replicates (Kruskal–Wallis test); *P < 0.05; **P < 0.01; ***P < 0.001; ****P < 0.0001. b, h, k Data were presented as the mean ± S.E. The experiment had three independent biological replicates (One-way ANOVA); *P < 0.05; **P < 0.01; ***P < 0.001; ****P < 0.0001
Fig. 7
Fig. 7
ERRα agonist treatment ameliorate cognitive function in Aβ1-42 ICV injected mice. a Experimental design for Aβ1-42 injection and behavioral test (Created with https://www.biorender.com). b Schematic representation of Y-maze task. ce The spontaneous alternation rates of all mice (c, n = 13, sham group; n = 13, Aβ + vehicle group; n = 14, Aβ + agonist group), male mice (d, n = 7, sham group; n = 7, Aβ + vehicle group; n = 7, Aβ + agonist group), and female mice (e, n = 6, sham group; n = 6, Aβ + vehicle group; n = 7, Aβ + agonist group) in Y-maze were showed. f Schematic representation of NOR task. gi The novel objective recognition rates of all mice (g, n = 13, sham group; n = 13, Aβ + vehicle group; n = 14, Aβ + agonist group) male mice (h, n = 7, sham group; n = 7, Aβ + vehicle group; n = 7, Aβ + agonist group), and female mice (i, n = 6, sham group; n = 6, Aβ + vehicle group; n = 7, Aβ + agonist group) were showed. j. Representative immunoblotting images of ERRα protein expression from cortex, with the top image representing males and the bottom image representing females. k, l Quantification analysis of cortex ERRα protein expression in male mice (k, n = 4, sham group; n = 3, Aβ + vehicle group; n = 3, Aβ + agonist group) and female mice (l, n = 3, sham group; n = 3, Aβ + vehicle group; n = 4, Aβ + agonist group). m Representative immunoblotting images of PSD95 protein expression from cortex, with the top image representing males and the bottom image representing females. n, o Quantification analysis of cortex PSD95 protein expression in male mice (n n = 4, sham group; n = 3, Aβ + vehicle group; n = 3, Aβ + agonist group) and female mice (o, n = 4, sham group; n = 3, Aβ + vehicle group; n = 4, Aβ + agonist group). c, d, e, g, h, i, k, l, n, o Data were presented as the mean ± S.E; One-way ANOVA; *P < 0.05; **P < 0.01; ***P < 0.001; ****P < 0.0001

Similar articles

Cited by

References

    1. Belloy ME, Napolioni V, Greicius MD. A quarter century of APOE and Alzheimer’s disease: progress to date and the path forward. Neuron. 2019;101(5):820–838. doi: 10.1016/j.neuron.2019.01.056. - DOI - PMC - PubMed
    1. Genin E, Hannequin D, Wallon D, Sleegers K, Hiltunen M, Combarros O, et al. APOE and Alzheimer disease: a major gene with semi-dominant inheritance. Mol Psychiatry. 2011;16(9):903–907. doi: 10.1038/mp.2011.52. - DOI - PMC - PubMed
    1. Nagy Z, Esiri MM, Jobst KA, Johnston C, Litchfield S, Sim E, et al. Influence of the apolipoprotein E genotype on amyloid deposition and neurofibrillary tangle formation in Alzheimer's disease. Neuroscience. 1995;69(3):757–761. doi: 10.1016/0306-4522(95)00331-C. - DOI - PubMed
    1. Bennett DA, De Jager PL, Leurgans SE, Schneider JA. Neuropathologic intermediate phenotypes enhance association to Alzheimer susceptibility alleles. Neurology. 2009;72(17):1495–1503. doi: 10.1212/WNL.0b013e3181a2e87d. - DOI - PMC - PubMed
    1. Serrano-Pozo A, Qian J, Monsell SE, Betensky RA, Hyman BT. APOEε2 is associated with milder clinical and pathological Alzheimer disease. Ann Neurol. 2015;77(6):917–929. doi: 10.1002/ana.24369. - DOI - PMC - PubMed

MeSH terms