. 2024 Jun 12;22(1):561.
doi: 10.1186/s12967-024-05243-2.

Lysine acetyltransferase 14 mediates TGF-β-induced fibrosis in ovarian endometrioma via co-operation with serum response factor

Affiliations

Lysine acetyltransferase 14 mediates TGF-β-induced fibrosis in ovarian endometrioma via co-operation with serum response factor

Yi Gong et al. J Transl Med. .

Abstract

Background: Fibrogenesis within ovarian endometrioma (endometrioma), mainly induced by transforming growth factor-β (TGF-β), is characterized by myofibroblast over-activation and excessive extracellular matrix (ECM) deposition, contributing to endometrioma-associated symptoms such as infertility by impairing ovarian reserve and oocyte quality. However, the precise molecular mechanisms that underpin the endometrioma- associated fibrosis progression induced by TGF-β remain poorly understood.

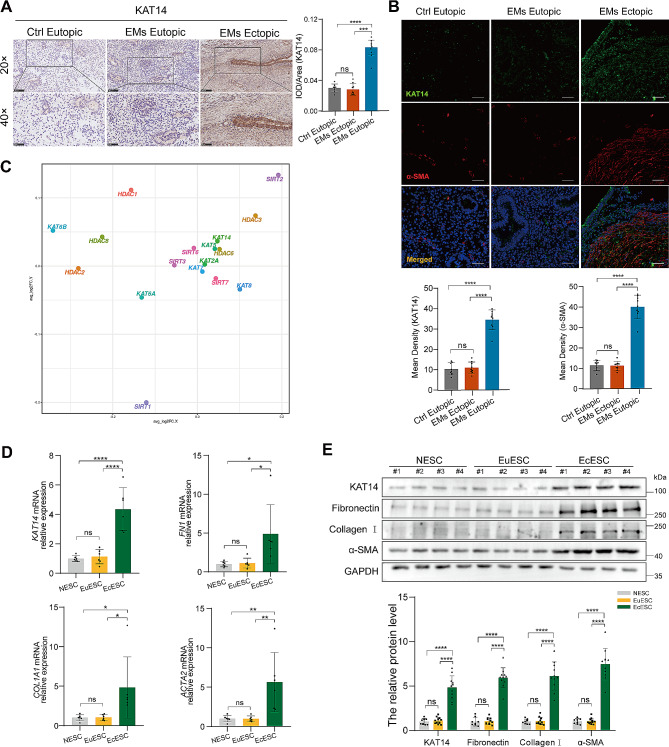
Methods: The expression level of lysine acetyltransferase 14 (KAT14) was validated in endometrium biopsies from patients with endometrioma and healthy controls, and the transcription level of KAT14 was further confirmed by analyzing a published single-cell transcriptome (scRNA-seq) dataset of endometriosis. We used overexpression, knockout, and knockdown approaches in immortalized human endometrial stromal cells (HESCs) or human primary ectopic endometrial stromal cells (EcESCs) to determine the role of KAT14 in TGF-β-induced fibrosis. Furthermore, an adeno-associated virus (AAV) carrying KAT14-shRNA was used in an endometriosis mice model to assess the role of KAT14 in vivo.

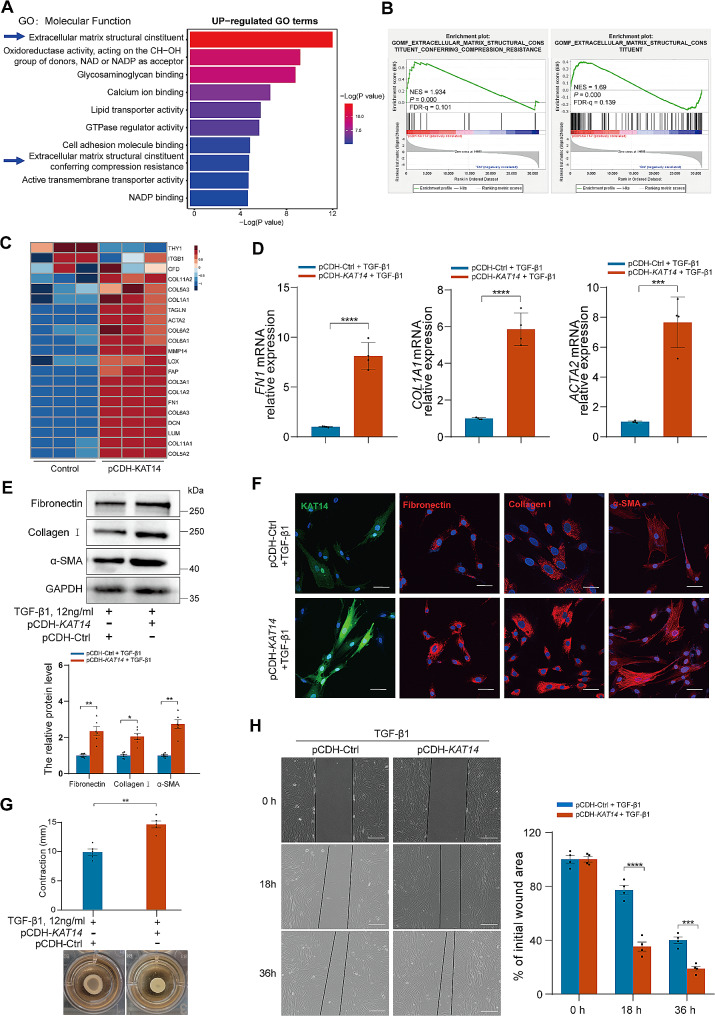
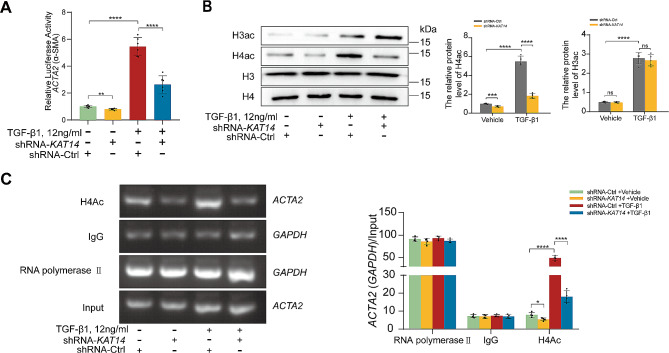
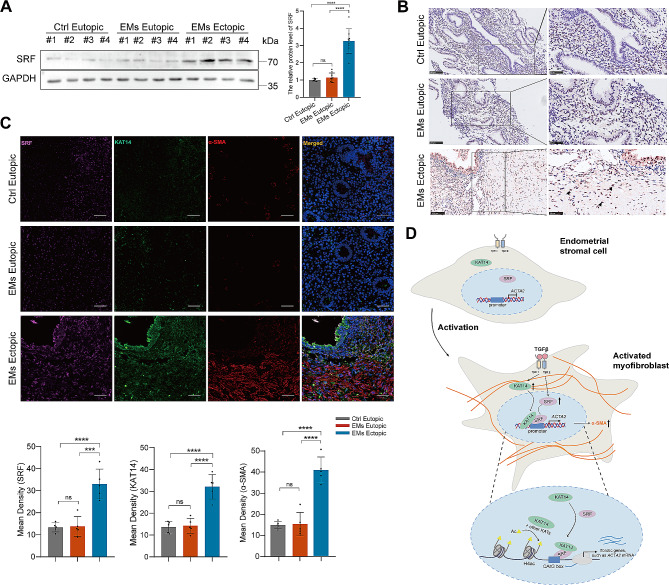
Results: KAT14 was upregulated in ectopic lesions from endometrioma patients and predominantly expressed in activated fibroblasts. In vitro studies showed that KAT14 overexpression significantly promoted a TGF-β-induced profibrotic response in endometrial stromal cells, while KAT14 silencing showed adverse effects that could be rescued by KAT14 re-enhancement. In vivo, Kat14 knockdown ameliorated fibrosis in the ectopic lesions of the endometriosis mouse model. Mechanistically, we showed that KAT14 directly interacted with serum response factor (SRF) to promote the expression of α-smooth muscle actin (α-SMA) by increasing histone H4 acetylation at promoter regions; this is necessary for TGF-β-induced ECM production and myofibroblast differentiation. In addition, the knockdown or pharmacological inhibition of SRF significantly attenuated KAT14-mediating profibrotic effects under TGF-β treatment. Notably, the KAT14/SRF complex was abundant in endometrioma samples and positively correlated with α-SMA expression, further supporting the key role of KAT14/SRF complex in the progression of endometrioma-associated fibrogenesis.

Conclusion: Our results shed light on KAT14 as a key effector of TGF-β-induced ECM production and myofibroblast differentiation in EcESCs by promoting histone H4 acetylation via co-operating with SRF, representing a potential therapeutic target for endometrioma-associated fibrosis.

Keywords: Endometrioma-associated fibrosis; Epigenetic modification; KAT14; SRF; TGF-β.


Conflict of interest statement

The authors declare no competing interests.

Figures

Fig. 1
Fig. 1
KAT14 was upregulated in human ovarian endometrioma lesions and primary human EcESCs. (A) Representative immunohistochemical staining for KAT14 in human normal endometrium tissue (n = 8), eutopic endometrium (n = 9), and ectopic lesions (n = 9) from human ovarian endometrioma. Scale bar: 100 μm (upper panel), scale bar: 50 μm (lower panel). (B) Double labeling immunofluorescence analysis showing the expression and distribution of KAT14 and α-SMA within normal endometrial tissues (n = 8), eutopic endometrium tissues (n = 9), and ectopic lesions (n = 9) from patients with ovarian endometrioma. Scale bar: 50 μm. (C) Single-cell differential expression analyses of histone acetylation genes in endometriomas, endometriosis, and eutopic endometrium. Each point (hollow circle) represents a single histone acetylation gene. The X-axis displays the average logarithm of fold change (logFC) values for genes measured in activated fibroblasts derived from endometrioma and endometriosis compared to those from the eutopic endometrium. The Y-axis represents the average logFC values for genes measured in all activated fibroblasts from endometrioma and endometriosis in relation to other cell populations from the same conditions. (D) qRT-PCR analysis of KAT14, FN1, COL1A1, and ACTA2 transcripts in primary EcESCs (n = 6) compared to NESCs (n = 6) and EuESCs (n = 6). Relative quantification of gene expression was calculated using the 2−∆∆Ct method and normalized to GAPDH as the internal control. (E) Western blot was used to measure the protein level of KAT14, Fibronectin1, Collagen I, and α-SMA in primary EcESCs (n = 11) compared to NESCs (n = 8) and EuESCs (n = 11). Data are representative of three or more independent experimental replicates. For all panels, data are presented as the mean ± SD. P-values were determined by one-way ANOVA. *P < 0.05, **P < 0.01, ***P < 0.001, ****P < 0.0001, ns: Not significant. EMs: endometriomas, EcESCs: ectopic endometrial stromal cells, EuESCs: eutopic endometrial stromal cells, NESCs: normal endometrial stromal cells
Fig. 2
Fig. 2
KAT14 overexpression exacerbated TGF-β1-induced fibrogenesis in immortalized HESCs. (A) Bar graph showing the enrichment analysis of upregulated genes after KAT14 overexpression in terms of GO molecular function. (B) Gene set enrichment analysis (GSEA) of DEGs induced by KAT14 overexpression compared to the negative control showing significant enrichment in gene sets associated with extracellular matrix structural constituents and ECM component pathways. Normalized enrichment score (NES), false discovery rate (FDR), and P-values are shown. (C) Heatmap profile of DEGs associated with fibroblast activation and ECM remodeling in KAT14-overexpressed cells compared to control cells based on RNA-Seq (n = 3). (D) qRT-PCR analysis of the relative mRNA expression of FN1, COL1A1, and ACTA2 in HESCs infected with the indicated lentiviruses harboring KAT14 expression vector (pCDH-KAT14) or empty vector control (pCDH-Ctrl) treated with TGF-β1 for 24 h. Relative quantification of gene expression was calculated using the 2−∆∆Ct method and normalized to GAPDH as the internal control. (E) Western blots measuring the protein level of fibronectin, collagen I, and α-SMA in HESCs infected with pCDH-KAT14 or pCDH-Ctrl lentiviruses under TGF-β1 stimulation for 48 h. (F) Immunofluorescence staining showing the expression of KAT14, α-SMA, and the ECM molecules fibronectin and collagen I in HESCs infected with pCDH-KAT14 or pCDH-Ctrl lentiviruses under TGF-β1 stimulation for 48 h. Scale bar: 50 μm. (G) Collagen gel contractility assay showing the cell contraction capacity of HESCs infected with pCDH-KAT14 or pCDH-Ctrl lentiviruses under TGF-β1 stimulation for 24 h. The degree of collagen gel contraction was determined as the difference between the diameters of the well and the released gels. (H) Wound healing assay showing the migration ability of HESCs infected with lentiviral vector containing pCDH-KAT14 or pCDH-Ctrl treated with TGF-β1 for 0, 18, and 36 h. Wound healing was assessed by calculating the area in µm2 between the lesion edges. Scale bar: 200 μm. TGF-β1 was used at a concentration of 12 ng/ml. Data are representative of three or more independent experimental replicates. For all panels, data are presented as the mean ± SD. P-values were determined by Student’s t-test in panels (D, E, G, H). *P< 0.05, **P < 0.01, ***P < 0.001, ****P < 0.0001. HESC: human endometrial stromal cell, GO: gene ontology, DEGs: differentially expressed genes, Ctrl: control
Fig. 3
Fig. 3
Knockdown of KAT14 attenuated TGF-β1-induced fibrogenesis in primary human EcESCs. (A) Western blot showing the protein levels of fibronectin, collagen 1, and α-SMA in primary EcESCs infected with shRNA-KAT14 or shRNA-Ctrl lentiviruses treated with TGF-β1 or vehicle for 0, 48, and 72 h. **P < 0.01, ***P < 0.001, and ****P < 0.0001 shRNA-KAT14 group versus shRNA-Ctrl group; #P < 0.05, ##P < 0.01, ###P < 0.001, ####P < 0.0001 shRNA-Ctrl group at 48–72 h versus shRNA-Ctrl at 0 h. (B) qRT-PCR analysis of the relative mRNA expression of FN1, COL1A1, and ACTA2 in primary EcESCs infected with shRNA-KAT14 or shRNA-Ctrl lentiviruses treated with TGF-β1 or vehicle for 24 h. Relative quantification of gene expression was calculated using the 2−∆∆Ct method and normalized to GAPDH as the internal control. (C) Western blots were used to measure the protein level of fibronectin, collagen I, and α-SMA in primary EcESCs infected with shRNA-KAT14 or shRNA-Ctrl lentiviruses stimulated by TGF-β1 or vehicle for 24 h. (D) Immunofluorescence staining showing the expression of KAT14, HESC activation marker, α-SMA, and the ECM molecules fibronectin and collagen I in primary EcESCs infected with shRNA-KAT14 or shRNA-Ctrl lentiviruses stimulated by TGF-β1 or vehicle for 48 h. Scale bar: 50 μm. (E) Collagen gel contractility assay showing the cell contraction capacity of primary EcESCs transfected with shRNA-KAT14 or shRNA-Ctrl lentiviruses stimulated by TGF-β1 or vehicle for 24 h. The degree of collagen gel contraction was determined as the difference between the diameters of the well and the released gels. (F) Wound healing assay showing the migration ability of primary EcESCs infected with shRNA-KAT14 or shRNA-Ctrl lentiviruses stimulated by TGF-β1 or vehicle for 0, 24, and 48 h. Wound healing was assessed by calculating the area in µm2 between the lesion edges. Scale bar: 200 μm. The concentration of TGF-β1 used for panels (AF) was 12 ng/ml. Data are representative of three or more independent experimental replicates. For all panels, data are presented as the mean ± SD. P-values were determined by Student’s t-test in panel (A) and by one-way ANOVA in panels (AC, E, F). *P < 0.05, **P < 0.01, ***P < 0.001, ****P < 0.0001. EcESCs: ectopic endometrial stromal cells, Ctrl: control
Fig. 4
Fig. 4
KAT14 knockdown ameliorates endometriosis-associated fibrosis in vivo. (A) Schematic diagram of the in vivo experiments. (B) qRT-PCR analysis of Fn1, Col1a1, and Acta2 expression in eutopic endometrium tissues from sham control, ectopic endometrial-like lesions, and eutopic endometrium tissues from endometriosis mice locally injected with AAV9-shKAT14 or its negative control (AAV9-shCtrl). Relative quantification of gene expression was calculated using the 2−∆∆Ct method and normalized to Gapdh as the internal control; n = 6 mice per group. (C) Western blotting analysis of fibronectin, collagen I, and α-SMA expression in eutopic endometrium tissues from sham control, ectopic endometrial-like lesions, and eutopic endometrium tissues from endometriosis mice injected with AAV9-shCtrl or AAV9-shKAT14; n = 6 mice per group. (D) Representative images of collagen I and α-SMA immunohistochemistry and Masson’s staining in eutopic endometrium tissues from sham control, ectopic endometrial-like lesions, and eutopic endometrium tissues from AAV9-shCtrl injected or AAV9-shKAT14 injected endometriosis mice; n = 6 mice per group, Scale bars: 50 μm. (E) Representative triple immunofluorescence staining images of collagen I, α-SMA, and fibronectin in eutopic endometrium tissues from sham control, eutopic endometrium tissues from sham control, ectopic endometrial-like lesions, and eutopic endometrium tissues from AAV9-shCtrl injected or AAV9-shKAT14 injected endometriosis mice; n = 6 mice per group, Scale bars: 50 μm. Data are shown as the mean ± SD. P-values were determined by one-way ANOVA. **P < 0.01, ***P < 0.001, ****P < 0.0001, ns: Not significant, AAV: adeno-associated virus
Fig. 5
Fig. 5
TGF-β1 induces KAT14-dependent ACTA2 transcription in primary human EcESCs. (A) Luciferase reporter assay showing ACTA2 promoter activity in primary EcESCs infected with shRNA-KAT14 or shRNA-Ctrl lentiviruses and treated with TGF-β1 (12 ng/ml) or vehicle for 24 h. (B) Primary EcESCs (n = 6) infected with shRNA-KAT14 or shRNA-Ctrl lentiviruses were treated with TGF-β1 or vehicle for 24 h. Western blot assay was performed to examine the effects of KAT14 knockdown on total histone H3, histone H4, acetylated histone H3 (H3ac), and acetylated histone H4 (H4ac) levels. (C) ChIP-qPCR was used to analyze α-SMA promoter occupancy by H4ac in primary EcESCs (n = 4) infected with shRNA-KAT14 or shRNA-Ctrl lentiviruses under treatment with TGF-β1 or vehicle for 24 h. The binding of RNA polymerase II and IgG to the GAPDH promoter was used as a positive and negative control, respectively. For stimulation, TGF-β1 was used at a concentration of 12 ng/ml. Data are representative of three or more independent experimental replicates. For all panels, data are presented as the mean ± SD. P-values were determined by Student’s t-test in panel (B), and one-way ANOVA in panels (A, C). *P < 0.05, **P < 0.01, ***P < 0.001, ****P < 0.0001, ns: Not significant, EcESCs: ectopic endometrial stromal cells, Ctrl: control, ChIP: chromatin immunoprecipitation
Fig. 6
Fig. 6
TGF-β1 increases SRF expression and promotes KAT14 nuclear translocation through co-operating with SRF in primary human EcESCs. (A) qRT-PCR analysis of SRF expression in primary NESCs (n = 5), EuESCs (n = 5), and EcESCs (n = 5). Relative quantification of gene expression was calculated using the 2−∆∆Ct method and normalized to GAPDH as the internal control. (B) Western blotting assay analysis showing the SRF protein levels in primary NESCs (n = 8), EuESCs (n = 11), and EcESCs (n = 11). (C) Western blotting analysis showing the SRF protein level in primary human EcESCs infected with shRNA-KAT14 or shRNA-Ctrl lentiviruses under TGF-β1 stimulation for 0, 48, and 72 h, respectively. ****P < 0.0001 versus shRNA-Ctrl at 0 h; ####P < 0.0001 versus shRNA-KAT14 at 0 h. (D) Immunofluorescence staining assay showing the co-localization of KAT14 and SRF in primary EcESCs incubated with TGF-β1 or vehicle for 48 h. Scale bar: 50 μm. (E) Total cell lysate was prepared and cytoplasmic and nuclear proteins were isolated from primary EcESCs, and the proteins were subjected to immunoblotting with KAT14 and SRF antibodies. The purity of the cytoplasmic and nuclear fractions was confirmed by GAPDH and Histone-H3 antibodies. (F) Cytoplasmic and nuclear proteins were isolated from primary EcESCs treated with TGF-β1 or vehicle for 48 h, immunoblotting assay showing KAT14 and SRF expression in the cytosol and nucleus. (G) Immunoprecipitation with SRF antibodies shows pull down of KAT14 in primary EcESCs treated with or without TGF-β1, using isotype-matched immunoglobulin G (IgG) antibody as a negative control. For stimulation, TGF-β1 was used at a concentration of 12 ng/ml. Data are representative of three or more independent experimental replicates. For all panels, data are presented as the mean ± SD. P-values were determined by Student’s t-test in panel (C), and one-way ANOVA in panels (AC). ****P < 0.0001, ns: Not significant, EcESCs: ectopic endometrial stromal cells, EuESCs: eutopic endometrial stromal cells, NESCs: normal endometrial stromal cells, Ctrl: control
Fig. 7
Fig. 7
KAT14-mediated TGF-β1-induced fibrogenic responses are regulated through SRF. (A) ChIP assay showing the binding of KAT14 to the CArG box of the ACTA2 promoter (left panel) in primary human EcESCs co-transfected with siRNA-SRF or siRNA-Ctrl under stimulation with TGF-β1 or vehicle for 24 h. The KPNA2 promoter (right panel) served as the negative control. (B)KAT14-KD primary EcESCs infected with pCDH-KAT14 or pCDH-Ctrl lentiviruses in the presence of siRNA-SRF or siRNA-Ctrl stimulated with TGF-β1 and then subjected to luciferase reporter assay. (C) qRT-PCR analysis showing the mRNA levels of FN1, COL1A1, ACTA2, KAT14, and SRF in KAT14-KD primary EcESCs infected with pCDH-KAT14 or pCDH-Ctrl lentiviruses in the presence of siRNA-SRF or siRNA-Ctrl stimulated with TGF-β1 for 24 h. Relative quantification of gene expression was calculated using the 2−∆∆Ct method and normalized to GAPDH as the internal control. (D) Immunoblotting analysis showing the protein levels of fibronectin, collagen 1, KAT14, SRF, and α-SMA in KAT14-KD primary EcESCs infected with lentiviruses harboring pCDH-KAT14 or pCDH-Ctrl vectors in the presence of siRNA-SRF or siRNA-Ctrl stimulated with TGF-β1 for 24 h. (E, F) Collagen gel contractility and wound healing assays were performed to assess (E) the cell contraction capacity and (F) cell migration ability of KAT14-KD primary EcESCs infected with pCDH-KAT14 or pCDH-Ctrl lentiviruses in the presence of siRNA-SRF or siRNA-Ctrl stimulated with TGF-β1 (collagen gel contractility assay for 24 h; wound healing assay for 0, 24, and 48 h). Scale bar: 200 μm. The concentration of TGF-β1 used for stimulation was 12 ng/ml. Data are representative of three or more independent experimental replicates. For all panels, data are presented as the mean ± SD. P-values were determined by one-way ANOVA test. *P < 0.05, **P < 0.01, ***P < 0.001, ****P < 0.0001, ns: Not significant, Ac: acetylation, EcESCs: ectopic endometrial stromal cells, Ctrl: control, ChIP: chromatin immunoprecipitation, KD: knockdown
Fig. 8
Fig. 8
Aberrant expression of SRF co-localizing with KAT14 was found in ovarian endometrioma lesions. (A) Western blot analysis of SRF protein expression in the eutopic endometrial tissues from healthy controls (n = 8), ectopic lesions (n = 9), and eutopic endometrial (n = 9) tissues from patients with endometrioma. (B) Representative images of SRF immunohistochemistry staining in the eutopic endometrial tissues from healthy controls (n = 8), ectopic lesions (n = 9), and eutopic endometrial (n = 9) tissues from patients with endometrioma. Bar: 100 μm (left panel), 50 μm (right panel); arrows indicate positive SRF expression. (C) Representative triple immunofluorescence staining images of α-SMA, SRF, and KAT14 protein in the eutopic endometrial tissues from healthy controls (n = 5), ectopic lesions (n = 5), and eutopic endometrial (n = 5) tissues from patients with endometrioma. Bar: 50 μm. (D) Schematic summary of the proposed profibrotic mechanisms by which KAT14 contributes to the pathogenesis of endometrioma-associated fibrosis. TGF-β1 stimulation of primary human EcESCs increases KAT14 and SRF expression, induces the interaction between KAT14 and SRF, and the acetylation of histone H4 at ACTA2 promoter regions to activate α-SMA expression, thus promoting EcESC transition into myofibroblasts, along with ECM deposition, ultimately resulting in endometrioma-associated fibrosis. Data are representative of three or more independent experimental replicates. For all panels, data are presented as the mean ± SD. P-values were determined through one-way ANOVA. ***P < 0.001, ****P < 0.0001, ns: Not significant, Ac: acetylation, Ctrl: control, EcESCs: ectopic endometrial stromal cells, EMs: endometriomas

Similar articles

Cited by

References

    1. Taylor HS, Kotlyar AM, Flores VA. Endometriosis is a chronic systemic disease: clinical challenges and novel innovations. Lancet. 2021;397(10276):839–52. doi: 10.1016/S0140-6736(21)00389-5. - DOI - PubMed
    1. Zondervan KT, Becker CM, Missmer AS, Endometriosis N Engl J Med. 2020;382(2):1244–56. doi: 10.1056/NEJMra1810764. - DOI - PubMed
    1. Saunders-Philippa TK, Horne AW. Endometriosis: etiology, pathobiology, and therapeutic prospects. Cell. 2021;184(11):2807–24. doi: 10.1016/j.cell.2021.04.041. - DOI - PubMed
    1. Simoens S, Dunselman G, Dirksen C, Hummelshoj L, Bokor A, Brandes I, et al. The burden of endometriosis: costs and quality of life of women with endometriosis and treated in referral centres. Hum Reprod. 2012;27(5):1292–9. doi: 10.1093/humrep/des073. - DOI - PubMed
    1. Sanchez AM, Viganò P, Somigliana E, Vercellini P, Candiani M. The distinguishing cellular and molecular features of the endometriotic ovarian cyst: from pathophysiology to the potential endometrioma-mediated damage to the ovary. Hum Reprod Update. 2014;20(2):217–30. doi: 10.1093/humupd/dmt053. - DOI - PubMed