Phosphoproteomic profiling of early rheumatoid arthritis synovium reveals active signalling pathways and differentiates inflammatory pathotypes
- PMID: 38867295
- PMCID: PMC11167927
- DOI: 10.1186/s13075-024-03351-4
Phosphoproteomic profiling of early rheumatoid arthritis synovium reveals active signalling pathways and differentiates inflammatory pathotypes
Abstract
Background: Kinases are intracellular signalling mediators and key to sustaining the inflammatory process in rheumatoid arthritis (RA). Oral inhibitors of Janus Kinase family (JAKs) are widely used in RA, while inhibitors of other kinase families e.g. phosphoinositide 3-kinase (PI3K) are under development. Most current biomarker platforms quantify mRNA/protein levels, but give no direct information on whether proteins are active/inactive. Phosphoproteome analysis has the potential to measure specific enzyme activation status at tissue level.
Methods: We validated the feasibility of phosphoproteome and total proteome analysis on 8 pre-treatment synovial biopsies from treatment-naive RA patients using label-free mass spectrometry, to identify active cell signalling pathways in synovial tissue which might explain failure to respond to RA therapeutics.
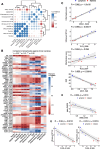
Results: Differential expression analysis and functional enrichment revealed clear separation of phosphoproteome and proteome profiles between lymphoid and myeloid RA pathotypes. Abundance of specific phosphosites was associated with the degree of inflammatory state. The lymphoid pathotype was enriched with lymphoproliferative signalling phosphosites, including Mammalian Target Of Rapamycin (MTOR) signalling, whereas the myeloid pathotype was associated with Mitogen-Activated Protein Kinase (MAPK) and CDK mediated signalling. This analysis also highlighted novel kinases not previously linked to RA, such as Protein Kinase, DNA-Activated, Catalytic Subunit (PRKDC) in the myeloid pathotype. Several phosphosites correlated with clinical features, such as Disease-Activity-Score (DAS)-28, suggesting that phosphosite analysis has potential for identifying novel biomarkers at tissue-level of disease severity and prognosis.
Conclusions: Specific phosphoproteome/proteome signatures delineate RA pathotypes and may have clinical utility for stratifying patients for personalised medicine in RA.
© 2024. The Author(s).
Conflict of interest statement
The authors declare no competing interests.
Figures


References
-
- Alcolea MP, Casado P, Rodriguez-Prados JC, Vanhaesebroeck B, Cutillas PR. Phosphoproteomic analysis of leukemia cells under basal and drug-treated conditions identifies markers of kinase pathway activation and mechanisms of resistance. Mol Cell Proteomics. 2012;11(8):453–466. doi: 10.1074/mcp.M112.017483. - DOI - PMC - PubMed
MeSH terms
Substances
Grants and funding
- 523/819/Barts and The London School of Medicine and Dentistry
- 523/819/Barts and The London School of Medicine and Dentistry
- 523/819/Barts and The London School of Medicine and Dentistry
- 523/819/Barts and The London School of Medicine and Dentistry
- 523/819/Barts and The London School of Medicine and Dentistry
- 523/819/Barts and The London School of Medicine and Dentistry
- 523/819/Barts and The London School of Medicine and Dentistry
- 523/819/Barts and The London School of Medicine and Dentistry
- G0800648, MR/K015346/1 and MR/V012509/1/MRC_/Medical Research Council/United Kingdom
- G0800648, MR/K015346/1 and MR/V012509/1/MRC_/Medical Research Council/United Kingdom
- G0800648, MR/K015346/1 and MR/V012509/1/MRC_/Medical Research Council/United Kingdom
- G0800648, MR/K015346/1 and MR/V012509/1/MRC_/Medical Research Council/United Kingdom
- G0800648, MR/K015346/1 and MR/V012509/1/MRC_/Medical Research Council/United Kingdom
- G0800648, MR/K015346/1 and MR/V012509/1/MRC_/Medical Research Council/United Kingdom
- G0800648, MR/K015346/1 and MR/V012509/1/MRC_/Medical Research Council/United Kingdom
- G0800648, MR/K015346/1 and MR/V012509/1/MRC_/Medical Research Council/United Kingdom
- 131575 and 203330/National Institute for Health and Care Research
- 131575 and 203330/National Institute for Health and Care Research
- 131575 and 203330/National Institute for Health and Care Research
- 131575 and 203330/National Institute for Health and Care Research
- 131575 and 203330/National Institute for Health and Care Research
- 131575 and 203330/National Institute for Health and Care Research
- 131575 and 203330/National Institute for Health and Care Research
- 131575 and 203330/National Institute for Health and Care Research
- 20022 and 20670/ARC_/Arthritis Research UK/United Kingdom
- 20022 and 20670/ARC_/Arthritis Research UK/United Kingdom
- 20022 and 20670/ARC_/Arthritis Research UK/United Kingdom
- 20022 and 20670/ARC_/Arthritis Research UK/United Kingdom
- 20022 and 20670/ARC_/Arthritis Research UK/United Kingdom
- 20022 and 20670/ARC_/Arthritis Research UK/United Kingdom
- 20022 and 20670/ARC_/Arthritis Research UK/United Kingdom
- 20022 and 20670/ARC_/Arthritis Research UK/United Kingdom
- C15966/A24375 and C16420/A18066/CRUK_/Cancer Research UK/United Kingdom
- C15966/A24375 and C16420/A18066/CRUK_/Cancer Research UK/United Kingdom
LinkOut - more resources
Full Text Sources
Medical
Molecular Biology Databases
Miscellaneous

