. 2024 Jun 12;23(1):199.
doi: 10.1186/s12933-024-02288-x.

Bidirectional modulation of TCA cycle metabolites and anaplerosis by metformin and its combination with SGLT2i

Affiliations

Bidirectional modulation of TCA cycle metabolites and anaplerosis by metformin and its combination with SGLT2i

Makoto Harada et al. Cardiovasc Diabetol. .

Abstract

Background: Metformin and sodium-glucose-cotransporter-2 inhibitors (SGLT2i) are cornerstone therapies for managing hyperglycemia in diabetes. However, their detailed impacts on metabolic processes, particularly within the citric acid (TCA) cycle and its anaplerotic pathways, remain unclear. This study investigates the tissue-specific metabolic effects of metformin, both as a monotherapy and in combination with SGLT2i, on the TCA cycle and associated anaplerotic reactions in both mice and humans.

Methods: Metformin-specific metabolic changes were initially identified by comparing metformin-treated diabetic mice (MET) with vehicle-treated db/db mice (VG). These findings were then assessed in two human cohorts (KORA and QBB) and a longitudinal KORA study of metformin-naïve patients with Type 2 Diabetes (T2D). We also compared MET with db/db mice on combination therapy (SGLT2i + MET). Metabolic profiling analyzed 716 metabolites from plasma, liver, and kidney tissues post-treatment, using linear regression and Bonferroni correction for statistical analysis, complemented by pathway analyses to explore the pathophysiological implications.

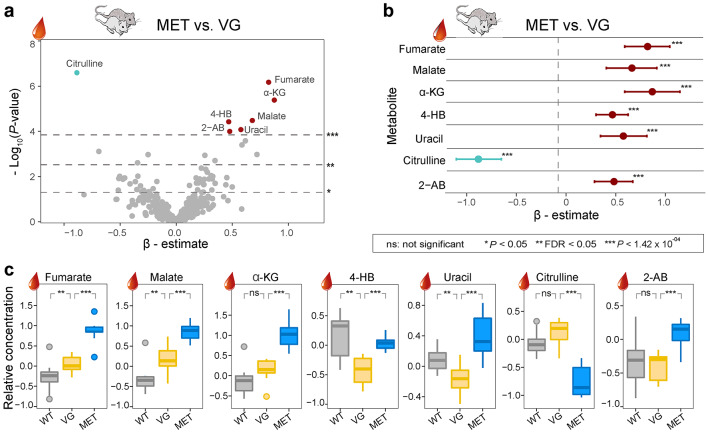
Results: Metformin monotherapy significantly upregulated TCA cycle intermediates such as malate, fumarate, and α-ketoglutarate (α-KG) in plasma, and anaplerotic substrates including hepatic glutamate and renal 2-hydroxyglutarate (2-HG) in diabetic mice. Downregulated hepatic taurine was also observed. The addition of SGLT2i, however, reversed these effects, such as downregulating circulating malate and α-KG, and hepatic glutamate and renal 2-HG, but upregulated hepatic taurine. In human T2D patients on metformin therapy, significant systemic alterations in metabolites were observed, including increased malate but decreased citrulline. The bidirectional modulation of TCA cycle intermediates in mice influenced key anaplerotic pathways linked to glutaminolysis, tumorigenesis, immune regulation, and antioxidative responses.

Conclusion: This study elucidates the specific metabolic consequences of metformin and SGLT2i on the TCA cycle, reflecting potential impacts on the immune system. Metformin shows promise for its anti-inflammatory properties, while the addition of SGLT2i may provide liver protection in conditions like metabolic dysfunction-associated steatotic liver disease (MASLD). These observations underscore the importance of personalized treatment strategies.

Keywords: Anaplerosis; Anti-inflammatory effects; Metabolic dysfunction-associated steatotic liver disease (MASLD); Metformin; Pharmacometabolomics; SGLT2 inhibitors; TCA cycle; Type 2 diabetes.


Conflict of interest statement

M.F.S. was employed at Helmholtz Munich during the execution of this study. He is currently an employee of the Global Medical Affairs and Pharmacovigilance Department of BAYER AG Pharmaceuticals (Berlin, Germany), however, the company was not involved in work related to data generation and manuscript generation. S.N. was employed by the Helmholtz Munich during the execution of this study. She is currently an employee of Sanofi Aventis Deutschland GmbH; however, the company was not involved in work related to data and manuscript generation.

Figures

Fig. 1
Fig. 1
Effects of metformin and leptin receptor mutation in murine plasma. a Volcano plot of linear regression analysis result (β-estimate and P value) for 351 plasma metabolites in pairwise comparison of MET with VG diabetic mice. The upper, middle and lower dashed lines represent Bonferroni-corrected, FDR and nominal (P = 0.05) significance levels, respectively. b Seven metformin-associated metabolites of β-estimates with confidence intervals are shown. c Boxplots of seven metabolites in three groups. WT wild type mice, VG vehicle gavaged diabetic mice, MET metformin-treated diabetic mice, FDR false discovery rate, 2-AB 2-aminobutyrate, 4-HB 4-hydroxybutyrate, α-KG α-ketoglutarate. See also Supplementary Table 2, Additional File 1
Fig. 2
Fig. 2
Cross-sectional and longitudinal analyses reveal specific pattern of metformin action in human serum and plasma. a, b β-estimates with confidence intervals of three metabolites in KORA and QBB cross-sectional human studies. c Mean relative residue of two metabolites in longitudinal KORA study. All analyses are based on the fully adjusted model (age, sex, BMI, physical activity, high alcohol intake, smoking status, systolic blood pressure, HbA1C, fasting glucose levels, high density lipoprotein cholesterol, triglycerides). 2-AB 2 aminobutyrate. See also Supplementary Tables 3, 4, Additional File 1
Fig. 3
Fig. 3
Hepatic and renal effects of metformin. Volcano plots of linear regression results for 391 hepatic (a) and 447 renal (b) metabolites for the comparison between MET and VG. The upper, middle and lower dashed lines represent Bonferroni-corrected, FDR and nominal (P = 0.05) significance levels, respectively. Boxplots of selected metformin-associated metabolites in WT, VG and MET mice are shown. MET metformin-treated db/db mice, VG vehicle-gavaged db/db mice, WT wild type mice, 2-AB 2-aminobutyrate, 2-HG 2-hydroxyglutarate. See also Supplementary Table 2, Additional File 1
Fig. 4
Fig. 4
Metabolic effects of combination therapy in the three murine tissues. Volcano plots in plasma (a), liver (b) and kidney (c) when compare SGLT2i + MET with MET mice. The upper, middle and the lower dashed lines represent Bonferroni-corrected, FDR and nominal (P = 0.05) significance levels, respectively. Boxplots of selected metabolites in MET and SGLT2i + MET mice are shown. MET metformin-treated db/db mice, SGLT2i + MET SGLT2i and metformin treated db/db mice. See also Supplementary Table 5, Additional File 1
Fig. 5
Fig. 5
Alteraration of TCA cycle metabolites and related pathways. a Boxplots showing selected metabolites across four db/db mouse groups. b Schematic overview of metformin’s effects on TCA cycle related metabolites in liver, kidney, and plasma of db/db mice and serum/plasma in humans. c Schematic of combined SGLT2i and metformin therapy in the same mouse tissues. This figure provides a simplified overview intended to facilitate general understanding of the alterations in TCA cycle metabolites across different tissues and treatment modalities. It is not meant to depict precise metabolic flows or fully detailed pathway interactions. Each organ has unique metabolic functions; thus, interpretations should consider the specific metabolic context of each tissue. 2-HG 2-hydroxyglutarate, α-KG α-ketoglutarate, TCA citric acid, NO nitric oxide

References

    1. Lin H, Ao H, Guo G, Liu M. The role and mechanism of metformin in inflammatory diseases. J Inflamm Res. 2023;16:5545–5564. doi: 10.2147/JIR.S436147. - DOI - PMC - PubMed
    1. Griss T, Vincent EE, Egnatchik R, Chen J, Ma EH, Faubert B, et al. Metformin antagonizes cancer cell proliferation by suppressing mitochondrial-dependent biosynthesis. PLoS Biol. 2015;13:e1002309. doi: 10.1371/journal.pbio.1002309. - DOI - PMC - PubMed
    1. Oh S, Cho Y, Chang M, Park S, Kwon H. Metformin decreases 2-HG production through the MYC-PHGDH pathway in suppressing breast cancer cell proliferation. Metabolites. 2021;11:480. doi: 10.3390/metabo11080480. - DOI - PMC - PubMed
    1. Xu T, Brandmaier S, Messias AC, Herder C, Draisma HHM, Demirkan A, et al. Effects of metformin on metabolite profiles and LDL cholesterol in patients with type 2 diabetes. Diabetes Care. 2015;38:1858–1867. doi: 10.2337/dc15-0658. - DOI - PubMed
    1. O’Neill LAJ, Hardie DG. Metabolism of inflammation limited by AMPK and pseudo-starvation. Nature. 2013;493:346–355. doi: 10.1038/nature11862. - DOI - PubMed

Publication types

MeSH terms