. 2024 Jul 1;4(7):1625-1642.
doi: 10.1158/2767-9764.CRC-24-0240.

Claudin-4 Modulates Autophagy via SLC1A5/LAT1 as a Mechanism to Regulate Micronuclei

Affiliations

Claudin-4 Modulates Autophagy via SLC1A5/LAT1 as a Mechanism to Regulate Micronuclei

Fabian R Villagomez et al. Cancer Res Commun. .

Abstract

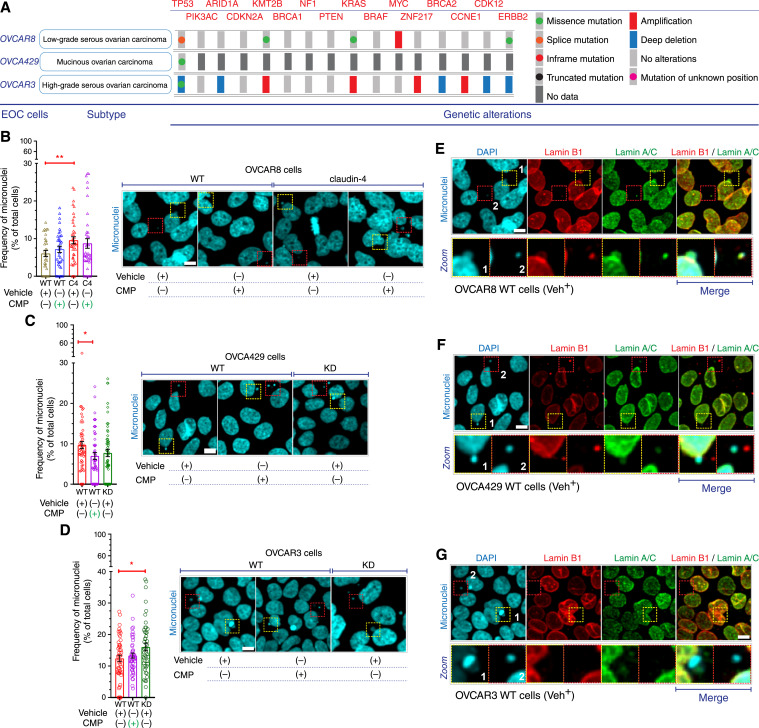
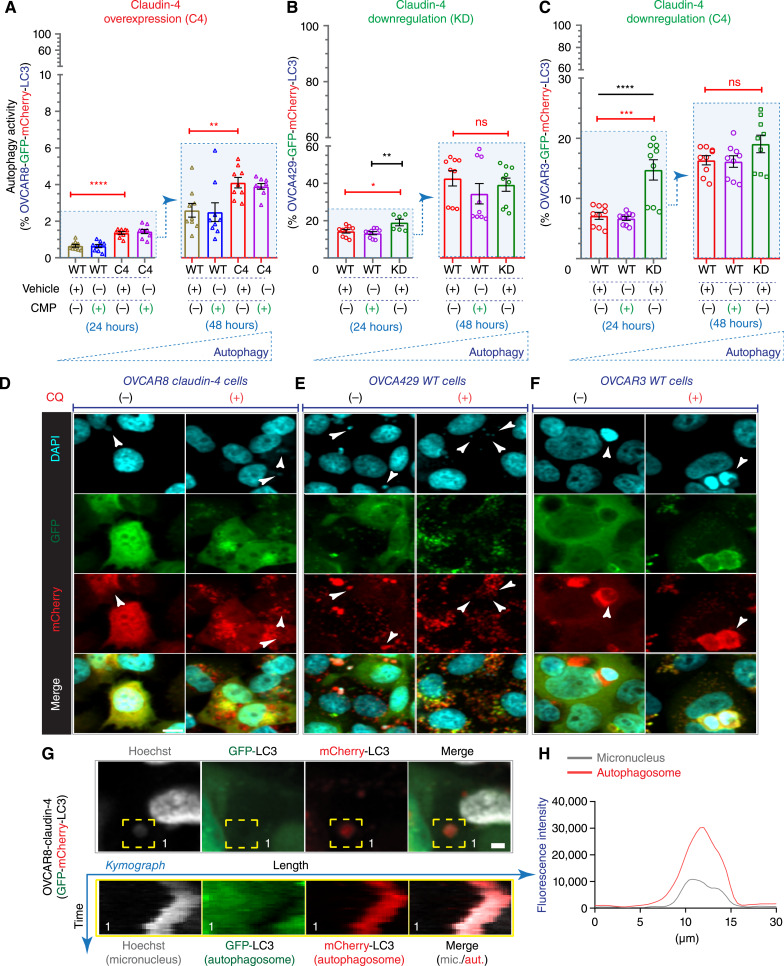
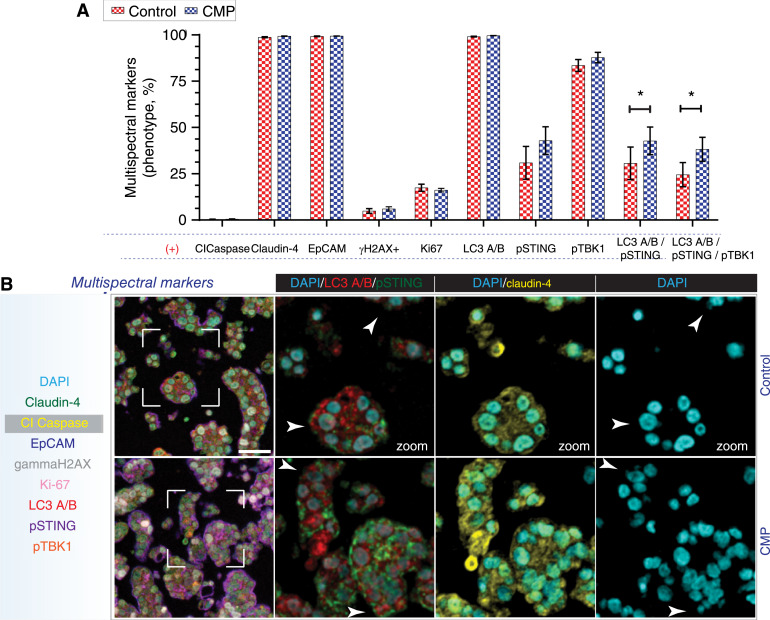
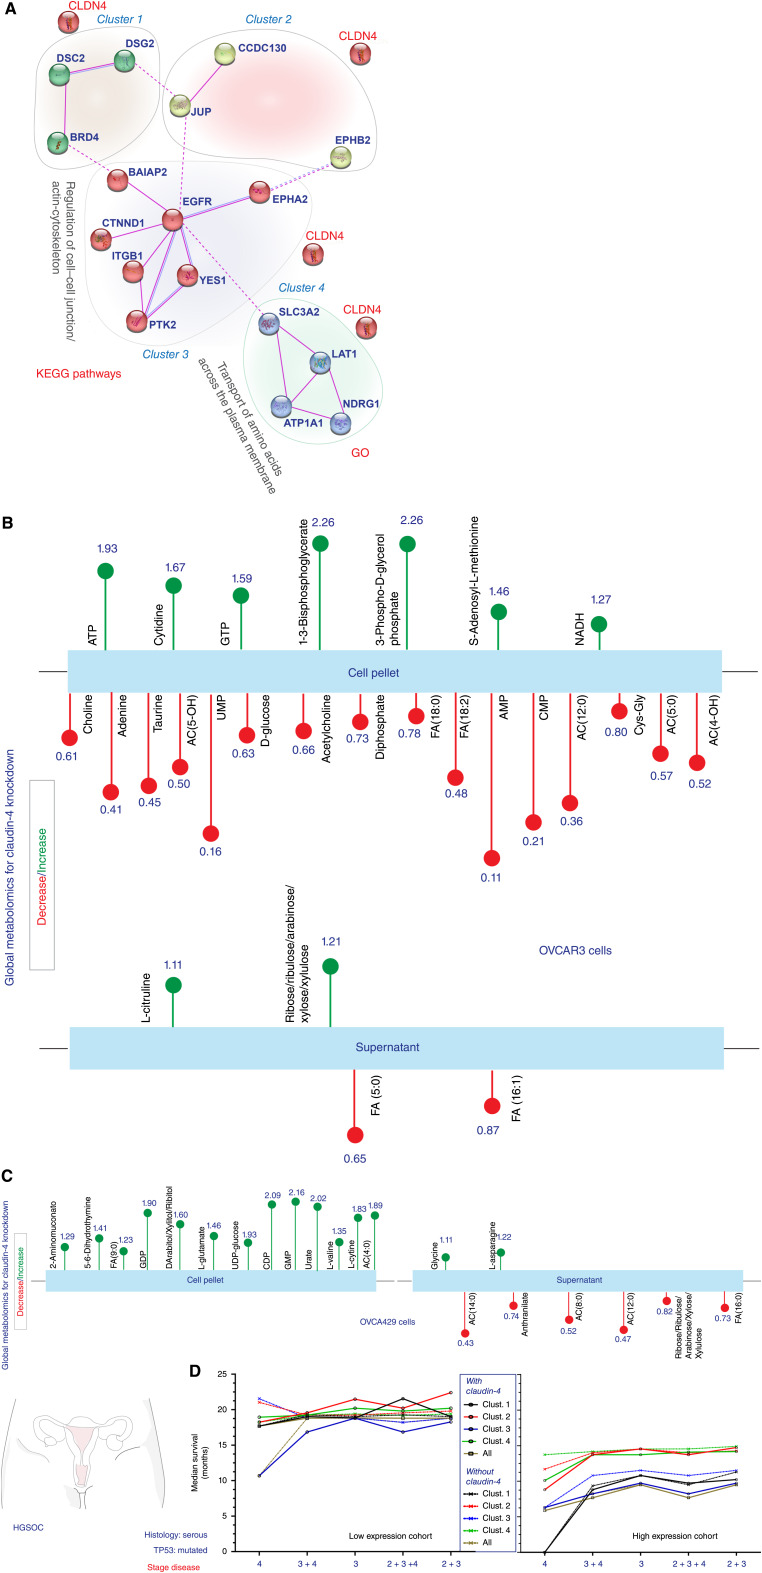
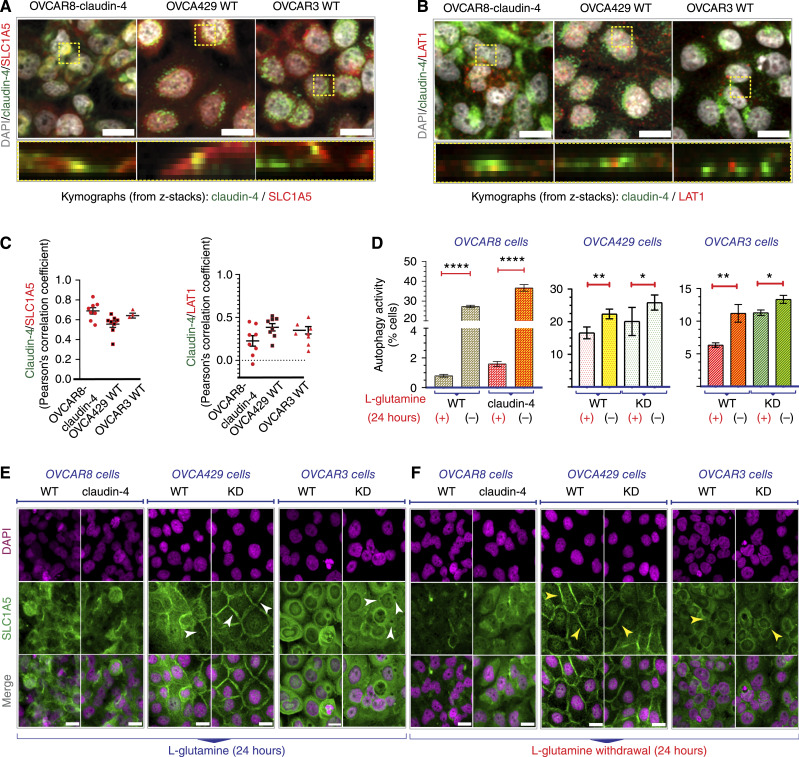
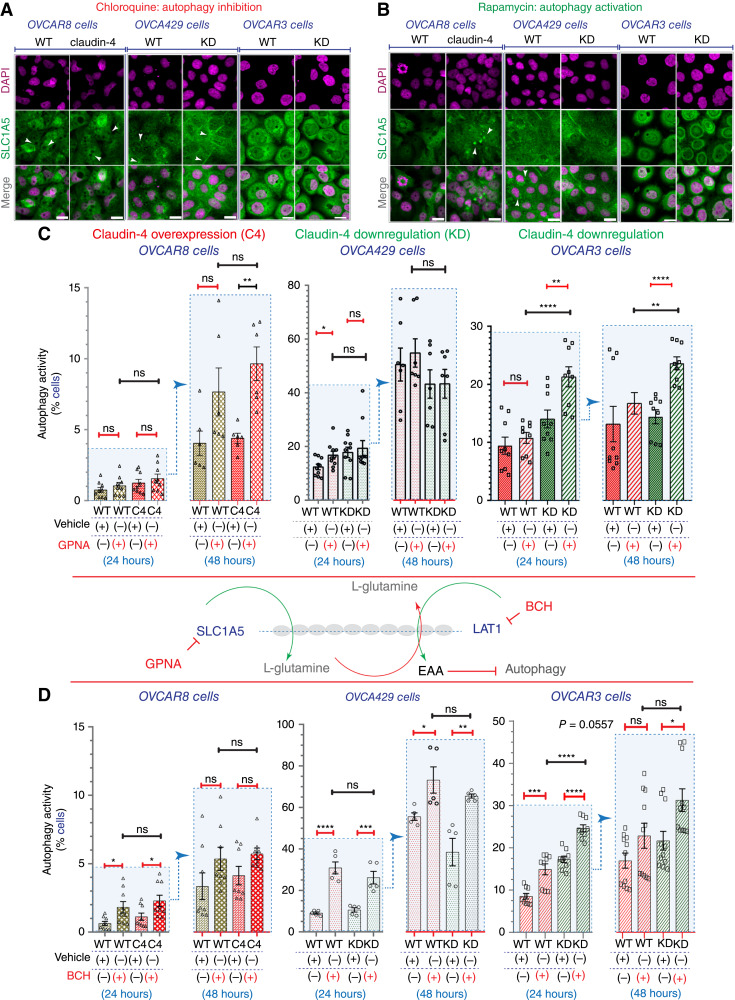
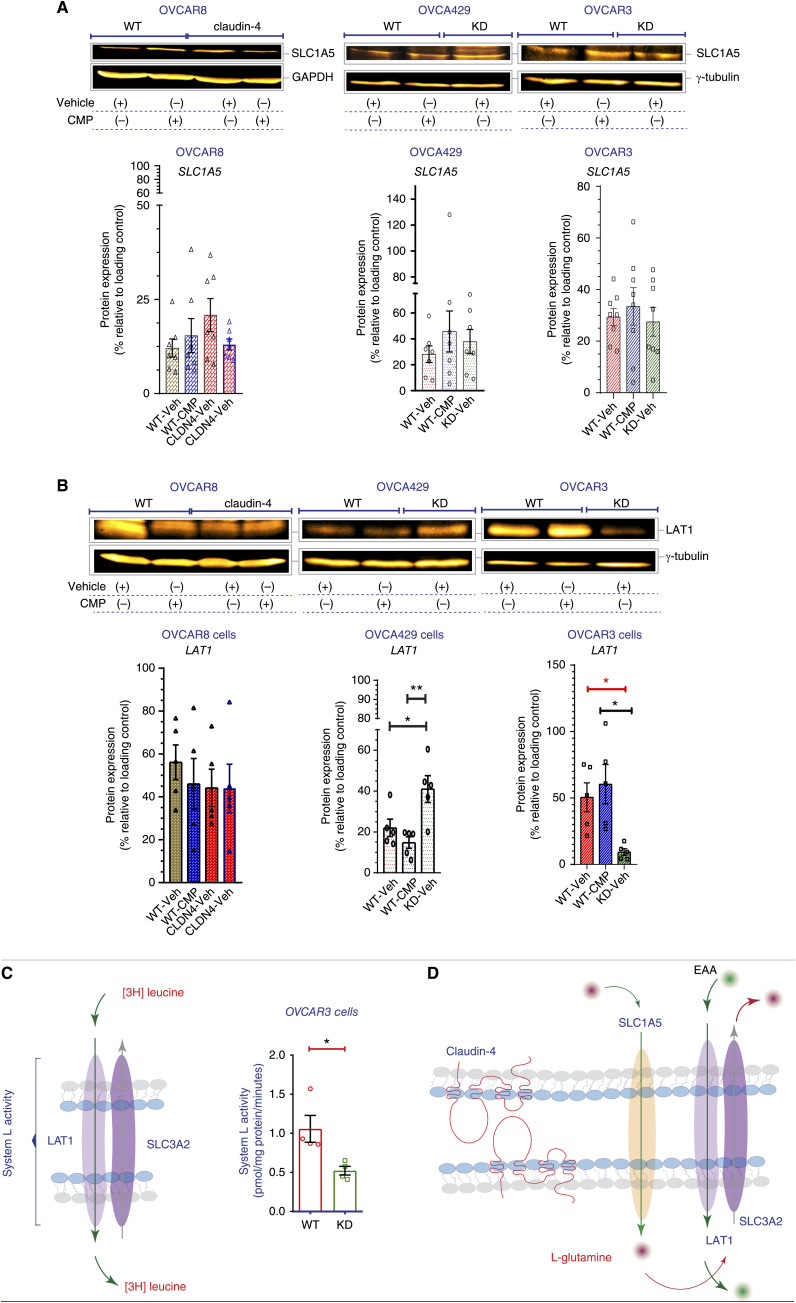
Genome instability is a hallmark of cancer crucial for tumor heterogeneity and is often a result of defects in cell division and DNA damage repair. Tumors tolerate genomic instability, but the accumulation of genetic aberrations is regulated to avoid catastrophic chromosomal alterations and cell death. In ovarian cancer tumors, claudin-4 is frequently upregulated and closely associated with genome instability and worse patient outcomes. However, its biological association with regulating genomic instability is poorly understood. Here, we used CRISPR interference and a claudin mimic peptide to modulate the claudin-4 expression and its function in vitro and in vivo. We found that claudin-4 promotes a tolerance mechanism for genomic instability through micronuclei generation in tumor cells. Disruption of claudin-4 increased autophagy and was associated with the engulfment of cytoplasm-localized DNA. Mechanistically, we observed that claudin-4 establishes a biological axis with the amino acid transporters SLC1A5 and LAT1, which regulate autophagy upstream of mTOR. Furthermore, the claudin-4/SLC1A5/LAT1 axis was linked to the transport of amino acids across the plasma membrane as one of the potential cellular processes that significantly decreased survival in ovarian cancer patients. Together, our results show that the upregulation of claudin-4 contributes to increasing the threshold of tolerance for genomic instability in ovarian tumor cells by limiting its accumulation through autophagy.

Significance: Autophagy regulation via claudin-4/SLC1A5/LAT1 has the potential to be a targetable mechanism to interfere with genomic instability in ovarian tumor cells.


Conflict of interest statement

All authors have completed and submitted the ICMJE Form for Disclosure of Potential Conflicts of Interest. J. Lang reports grants from DOD during the conduct of the study. B.G. Bitler reports grants from NCI/NIH, ACS, DOD, and OCRA during the conduct of the study. No other disclosures were reported.

Figures

Figure 1
Figure 1
Characterization of micronuclei during claudin-4 manipulation in HGSOC cells. HGSOC cells were treated with CMP (400 µmol/L; 48 hours). Then, cells were fixed and stained with DAPI to mark DNA and the components of the nuclear lamina, lamin B1 and lamin A/C. Subsequently, a morphometric characterization was performed through confocal microscopy. A, Illustration indicating the histological subtype of EOC cells used as in vitro system, as well as certain genetic alterations. B, (Left), frequency of micronuclei during claudin-4 overexpression; (right), confocal images (maximum projections) highlighting (dotted squares) micronuclei. Similar data is presented for claudin-4 downregulation in OVCA429 (C) and OVCAR3 cells (D). (n = 4,134 OVCAR8 cells; n = 3,315 OVCA429 cells; n = 4,653 OVCAR3 cells; Two-tailed Mann–Whitney test). E, Selected confocal images (OVCAR8 WT cells treated with the vehicle from (B) showing lamin B1 and lamin A/C. It is highlighted the lack of nuclear lamina in some micronuclei. Similar data is presented in (F and G) for OVCA429 and OVCAR3 cells, respectively. (three independent experiments; Kruskal–Wallis test with Dunn's multiple comparisons, P < 0.05). Graphs show mean and SEM, scale bar, 10 µm.
Figure 2
Figure 2
Claudin-4 links genomic instability to autophagy in HGSOC cells. We analyzed the functional role of claudin-4, establishing a link between autophagy and micronuclei (indicator of genomic instability) in HGSOC cells. This analysis was conducted both in vitro (HGSOC-GFP-mCherry-LC3 expressing cells) and in vivo (PDX in a humanized mice model). The assessment involved techniques such as flow cytometry, confocal microscopy (CM), and multispectral immunofluorescence. A–C, show percentage autophagy flux in HGSOC cells (flow cytometry) during CMP treatment (400 µmol/L), and claudin-4 genetic manipulation at 24 and 48 hours of culture (four independent experiments; Dotted blue triangles suggest an increase in autophagy). D–F, show confocal images of HGSOC cells expressing GFP-mCherry-LC3 and stained with DAPI (white arrow indicates the convergence of autophagy flux (mCherry) with micronuclei. G, Top, shows confocal images (from live-cell imaging) highlighting (yellow dotted square) a micronucleus; (bottom), kymographs generated from live-cell confocal imaging (from yellow dotted square). It shows the mobility pattern over time of the same region in every channel (Hoechst, GFP, and mCherry). H, Shows a line scan that indicates the fluorescence pattern for the micronucleus and autophagosomes (mCherry) from (G). (significance, P < 0.05). Graphs show mean and SEM, scale bar, 10 and 5 µm.
Figure 3
Figure 3
In vivo association between indicators of autophagy and genomic instability during CMP treatment. Ascites was obtained from tumor-bearing mice treated or not with CMP (4 mg/kg) and prepared in histogel, followed paraffin embedding and multispectral staining (eight proteins plus DAPI). Afterward, a phenotypic characterization was performed. A, Frequency of cells obtained from ascites samples at the end of the study (30 days) showing individual markers as well as cells positive for LC3 A/B and pSTING, and LC3 A/B, pSTING, and pTBK1. B, Representative multispectral IF images (all markers used are indicated in the blue-light box) are shown, where a region of interest (white square) is amplified to show specific markers (white arrow are highlighting the overlay of nuclei and the marker of autophagy, LC3 A/B). (Multiple t test; significance; P < 0.05). Graphs show mean and SEM, scale bar, 50 µm.
Figure 4
Figure 4
Correlation of amino acids transport with the clinical significance of claudin-4 in ovarian cancer. Reported proteins interacting with claudin-4 in HGSOC cells were employed to construct PPN, aiming to identify key elements and cellular functions associated with the clinical significance of claudin-4 in HGSOC tumors. This analysis utilized publicly available data from HGSOC tumors, sourced from cBioPortal and Kaplan–Meier plotter. A, PPN (based on BioID) of claudin-4-interacting proteins (experimentally determined using STRING) and highly mutated proteins (cBioPortal) in HGSOC tumors shows clusters of proteins and distinctive associated cellular functions. B, Significantly different metabolites in OVCAR3 cells associated to claudin-4 downregulation (from global metabolomics using cell pellets and supernatants; claudin-4 KD/WT, where values close to 1 are similar results between KD and WT). It also indicates the corresponding mean fold change in the (top) of circles, (red and green; red indicates decreased while greed indicates increase of metabolites). C, Same as (B) but in OVCA429 cells. D, The median survival of HGSOC patients (criteria: p53 mutated; serous histology) was correlated with each identified cluster (based on claudin-4; continue lines) and without claudin-4 (dotted lines; significance, P < 0.05; P values and false discovery rate is indicated in Supplementary Tables S3 and S4).
Figure 5
Figure 5
Effect of claudin-4 manipulation on the intracellular distribution of transporters of amino acids. We studied the association of claudin-4 with the amino acid transporters, SLC1A5 and LAT1 (which regulate autophagy) in HGSOC cells using confocal microscopy, immunoblotting, and flow cytometry. A, Top, confocal images showing the intracellular distribution of SLC1A5 and claudin-4 in HGSOC cells; bottom, kymographs (from z-stacks and dotted yellow squares) highlighting colocalization. A similar phenotype is shown for LAT1 and claudin-4 in (B). The Pearson’s correlation coefficient for SLC1A5 and claudin-4, and LAT1 and claudin-4 is shown in (C). D, Percentage of HGSOC cells with autophagic flux during L-glutamine withdrawal measured by flow cytometry (two-tailed unpaired t test and Mann–Whitney test; three independent experiments; significance, P < 0.05). E and F, show representative confocal images (maximum projections) of the intracellular distribution of SLC1A5 before claudin-4 overexpression (OVCAR8 claudin-4) and downregulation (OVCA429 claudin-4 KD and OVCAR3 claudin-4 KD) in HGSOC cells with and without L-glutamine, respectively. Graphs show mean and SEM, scale bar, 20 µm.
Figure 6
Figure 6
Association of autophagy and the activity of transporters of amino acids. The association of autophagy with the activity of SLC1A5 and LAT1 was evaluated through confocal microscopy and flow cytometry and by using both an activator of autophagy (rapamycin 8 µmol/L, 24 hours) and an inhibitor (chloroquine, 40 µmol/L, 24 hours) as well as the specific inhibition of SLC1A5 and LAT1 using GPNA (25 mmol/L) and BCH (5 mmol/L), respectively. A, Confocal images showing SLC1A5 intracellular distribution in HGSOC cells during autophagy blocking autophagy induction (B). C, Graphs indicate percentages of autophagy flux in HGSOC cells during specific inhibition of SLC1A5 activity (GNPA, 5 mmol/L) and manipulation of claudin-4 expression. D, Graphs indicate percentages of autophagy flux in HGSOC cells during specific inhibition of LAT1 (BCH, 25 mmol/L). (Two-tailed Unpaired t test and Mann–Whitney test; Kruskal–Wallis test with Dunn’s multiple comparisons; One way ANOVA and Tukey’s multiple comparison test; three independent experiments; significance, P < 0.05). Graphs show mean and SEM, scale bar, 20 µm.
Figure 7
Figure 7
Impact of claudin-4 in the expression of transporters of amino acids and the uptake of essential amino acids in HGSOC cells. The effect of claudin-4 manipulation (overexpression and downregulation) in the expression of SLC1A5 and LAT1 was measured via immunoblotting in HGSOC cells (OVCAR8, OVCA429, and OVCAR3). Direct amino acid uptake (essential amino acids, EAA; [3H]leucine) was analyzed in OVCAR3 cells (culture for 24 hours). A and B, Top, show representative immunoblots for SLC1A5 and LAT1 in HGSOC cells during claudin-4 disruption, respectively; (bottom), corresponding quantification (four independent experiments). C, Left, illustration highlighting a heterodimer formed by LAT and SLC3A2 which internalizes essential amino acids; right, uptake measurement of the essential amino acid leucine ([3H]leucine; three independent experiments; Two-tail t test). D, Model [adapted from reference: (54)] proposing an axis formed by claudin-4, SLC1A5, and LAT1 which could regulate autophagy in HGSOC cells. In this model, claudin-4 is contributing to determine the intracellular localization of theses transporters of amino acids, and possibly stabilizing their function in membranes. (significance, P < 0.05). Graphs show mean and SEM.

Similar articles

Cited by

References

    1. McCabe A, Zaheed O, McDade SS, Dean K. Investigating the suitability of in vitro cell lines as models for the major subtypes of epithelial ovarian cancer. Front Cell Dev Biol 2023;11:1104514. - PMC - PubMed
    1. Yamamoto TM, Webb PG, Davis DM, Baumgartner HK, Woodruff ER, Guntupalli SR, et al. . Loss of claudin-4 reduces DNA damage repair and increases sensitivity to PARP inhibitors. Mol Cancer Ther 2022;21:647–57. - PMC - PubMed
    1. Ortiz M, Wabel E, Mitchell K, Horibata S. Mechanisms of chemotherapy resistance in ovarian cancer. Cancer Drug Resist 2022;5:304–16. - PMC - PubMed
    1. Ovarian Cancer Research Alliance . Ovarian cancer statistics; 2024. [cited Dec 1 2024].
    1. Arora T, Mullangi S, Lekkala MR. Ovarian cancer. Treasure Island (FL): StatPearls2023; 2024.

Publication types