. 2024 Jun;30(6):e14796.
doi: 10.1111/cns.14796.

Peripheral cytokine interleukin-10 alleviates perihematomal edema after intracerebral hemorrhage via interleukin-10 receptor/JAK1/STAT3 signaling

Affiliations

Peripheral cytokine interleukin-10 alleviates perihematomal edema after intracerebral hemorrhage via interleukin-10 receptor/JAK1/STAT3 signaling

Yao Xu et al. CNS Neurosci Ther. 2024 Jun.

Abstract

Aims: The extent of perihematomal edema following intracerebral hemorrhage (ICH) significantly impacts patient prognosis, and disruption of the blood-brain barrier (BBB) exacerbates perihematomal edema. However, the role of peripheral IL-10 in mitigating BBB disruption through pathways that link peripheral and central nervous system signals remains poorly understood.

Methods: Recombinant IL-10 was administered to ICH model mice via caudal vein injection, an IL-10-inhibiting adeno-associated virus and an IL-10 receptor knockout plasmid were delivered intraventricularly, and neurobehavioral deficits, perihematomal edema, BBB disruption, and the expression of JAK1 and STAT3 were evaluated.

Results: Our study demonstrated that the peripheral cytokine IL-10 mitigated BBB breakdown, perihematomal edema, and neurobehavioral deficits after ICH and that IL-10 deficiency reversed these effects, likely through the IL-10R/JAK1/STAT3 signaling pathway.

Conclusions: Peripheral IL-10 has the potential to reduce BBB damage and perihematomal edema following ICH and improve patient prognosis.

Keywords: Interleukin‐10; blood–brain barrier; intracerebral hemorrhage; perihematomal edema; tight junction.


Conflict of interest statement

The authors declare that they have no competing interests.

Figures
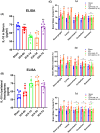
FIGURE 1
FIGURE 1
Changes in the expression of IL‐10 and the effect on perihematomal edema after ICH. (A) Quantitative analysis of the change in IL‐10 levels in the serum over time. (B) Quantitative analysis of the change in IL‐10 levels over time on the side of the cerebral hemorrhage. (C) Statistical analysis of brain water content in different brain regions on the side of cerebral hemorrhage, including the basal ganglia, cortex, cerebellum, hippocampus, and brainstem, at 1, 3, and 7 days after ICH. The data are expressed as the mean ± SD. Sham, sham‐operated group; ICH‐6 h, 6 h after ICH; ICH‐1 day, 1 day after ICH; ICH‐3 day, 3 day after ICH; ICH‐7 day, 7 day after ICH. *p < 0.05 versus the sham group; # p < 0.05 versus the ICH group; & p < 0.05 versus the ICH + rmIL‐10 group; ns: no significance.
FIGURE 2
FIGURE 2
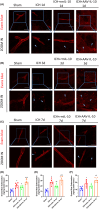
Peripheral IL‐10 alleviated BBB damage at 1, 3, and 7 days after ICH. (A–C) EB fluorescence images and magnified images; scale bar = 100 μm. The arrows in the magnified images indicate EB dye extravasated from the vessels. (D–F) Quantitative analysis of EB extravasation. The data are expressed as the mean ± SD. *p < 0.05 versus the sham group; # p < 0.05 versus the ICH group; & p < 0.05 versus the ICH + rmIL‐10 group; ns: no significance.
FIGURE 3
FIGURE 3
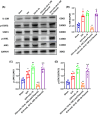
Peripheral IL‐10 upregulated the expression of the tight junction proteins ZO‐1 and CLDN5 3 days after ICH. (A) Western blot images and quantitative analysis of ZO‐1 expression. The data are expressed as the mean ± SD.*p < 0.05 versus the sham group; # p < 0.05 versus the ICH group; & p < 0.05 versus the ICH + rmIL‐10 group; ns, no significance. (B) Double immunofluorescence staining images and magnified representative pictures of ZO‐1 (green) staining in endothelial cells (CD31, red). (C) Western blot images and quantitative analysis of CLDN5 expression. The data are expressed as the mean ± SD. *p < 0.05 versus the sham group; # p < 0.05 versus the ICH group; & p < 0.05 versus the ICH + rmIL‐10 group; ns, no significance. (D) Double immunofluorescence staining images and magnified representative images of CLDN5 (green) staining in endothelial cells (CD31, red). Scale bar = 100 μm. The arrows in the magnified images indicate regions in which tight junction protein levels were significantly decreased in vessels.
FIGURE 4
FIGURE 4
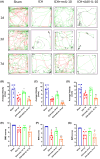
Peripheral IL‐10 alleviated apoplectic dyskinesia at 1, 3, and 7 days after ICH, and IL‐10 deficiency had the opposite effect. (A) Trajectories in the open field test and (B–D) statistical analysis of the average velocity of the mice. According to the preset parameters, the trajectories of the mice are presented in three colors: black (low speed), green (medium speed), and red (high speed). (E–G) Statistical analysis of the BMS scores of the mice. The data are expressed as the mean ± SD or median and range. *p < 0.05 versus the sham group; # p < 0.05 versus the ICH group; & p < 0.05 versus the ICH + rmIL‐10 group; ns: no significance.
FIGURE 5
FIGURE 5
IL‐10R Cas9 plasmid‐mediated IL‐10R knockdown aggravated cerebral damage 3 days after ICH. (A) EB fluorescence images (scale bar = 100 μm) and trajectories in the OFT. According to the preset parameters, the trajectories of the mice are presented in three colors: black (low speed), green (medium speed), and red (high speed). (B–D) Statistical analysis of BMS scores, average velocity and EB extravasation. The data are expressed as the mean ± SD. *p < 0.05 versus the sham group; # p < 0.05 versus the ICH group; & p < 0.05 versus the ICH + rmIL‐10 group; & p < 0.05 versus the ICH + rmIL‐10 + IL‐10R Cas9‐Plasmid group; ns, no significance.
FIGURE 6
FIGURE 6
IL‐10R Cas9 plasmid‐mediated IL‐10R knockdown aggravated cerebral damage at 3 days after ICH via inhibition of the IL‐10R/JAK1/STAT3 signaling pathway. (A–D) Western blot images and quantitative analysis of IL‐10R, JAK1, p‐JAK1, STAT3, and p‐STAT3 levels on the side of cerebral hemorrhage in the sham, ICH, ICH + rmIL‐10, ICH + rmIL‐10 + IL‐10R Ctr‐Plasmid, and ICH + rmIL‐10 + IL‐10R Cas9‐Plasmid groups at 3 days after ICH.

References

    1. Collaborators GBDNSD . Global, regional, and national burden of disorders affecting the nervous system, 1990‐2021: a systematic analysis for the global burden of disease study 2021. Lancet Neurol. 2024;23(4):344‐381. doi:10.1016/S1474-4422(24)00038-3 - DOI - PMC - PubMed
    1. Zhu H, Wang Z, Yu J, et al. Role and mechanisms of cytokines in the secondary brain injury after intracerebral hemorrhage. Prog Neurobiol. 2019;178:101610. doi:10.1016/j.pneurobio.2019.03.003 - DOI - PubMed
    1. Sheth KN. Spontaneous intracerebral hemorrhage. N Engl J Med. 2022;387(17):1589‐1596. doi:10.1056/NEJMra2201449 - DOI - PubMed
    1. Li Q, Lan X, Han X, et al. Microglia‐derived interleukin‐10 accelerates post‐intracerebral hemorrhage hematoma clearance by regulating CD36. Brain Behav Immun. 2021;94:437‐457. doi:10.1016/j.bbi.2021.02.001 - DOI - PMC - PubMed
    1. Short WD, Steen E, Kaul A, et al. IL‐10 promotes endothelial progenitor cell infiltration and wound healing via STAT3. FASEB J. 2022;36(7):e22298. doi:10.1096/fj.201901024RR - DOI - PMC - PubMed

Publication types

MeSH terms