. 2024 Aug 20;123(16):2455-2475.
doi: 10.1016/j.bpj.2024.06.009. Epub 2024 Jun 11.

Transient pores in hemifusion diaphragms

Affiliations

Transient pores in hemifusion diaphragms

Russell K W Spencer et al. Biophys J. .

Abstract

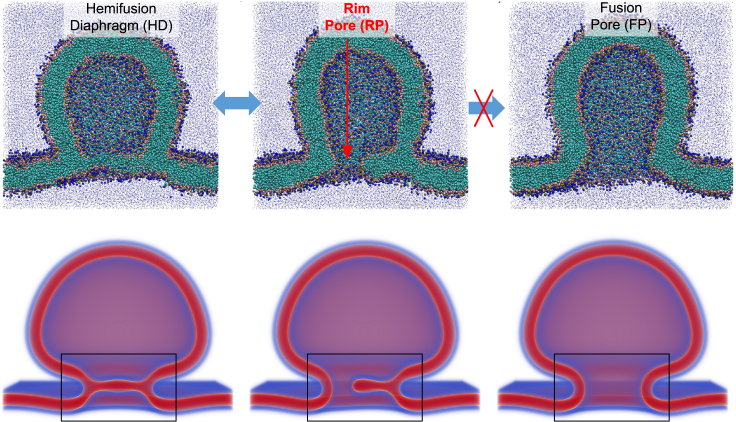
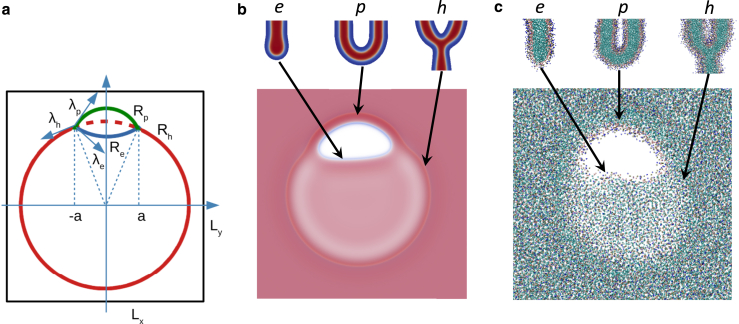
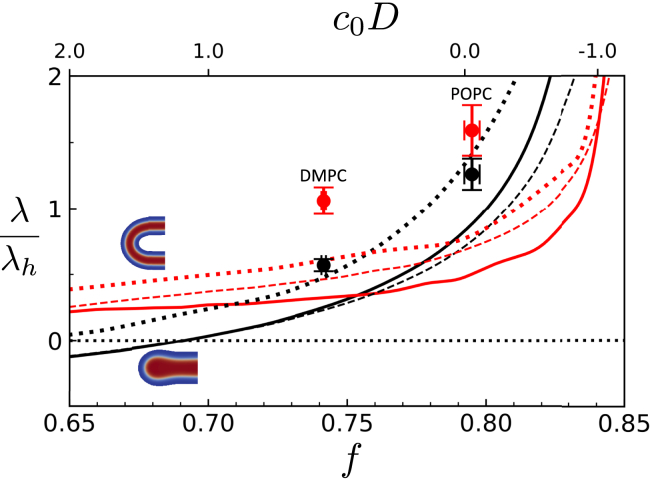
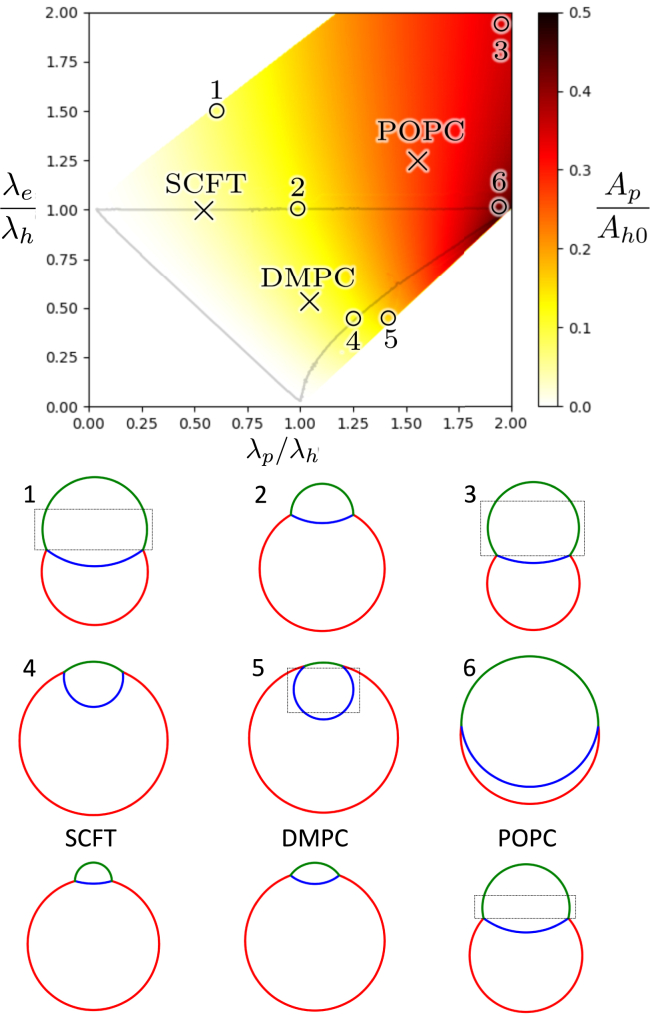
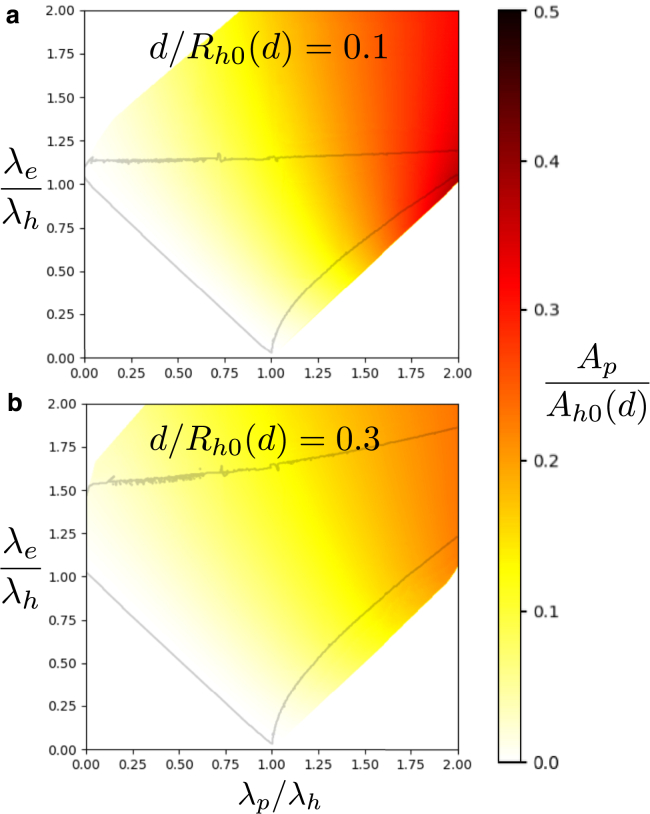
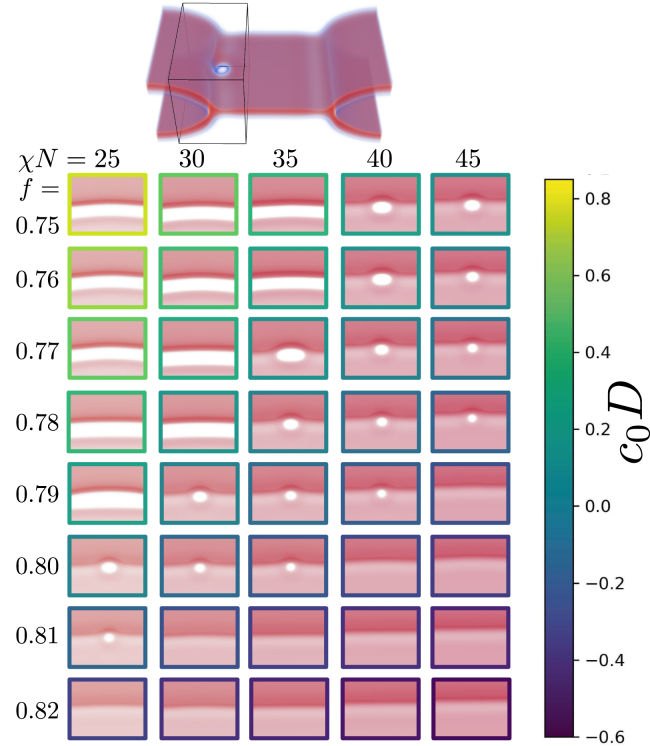
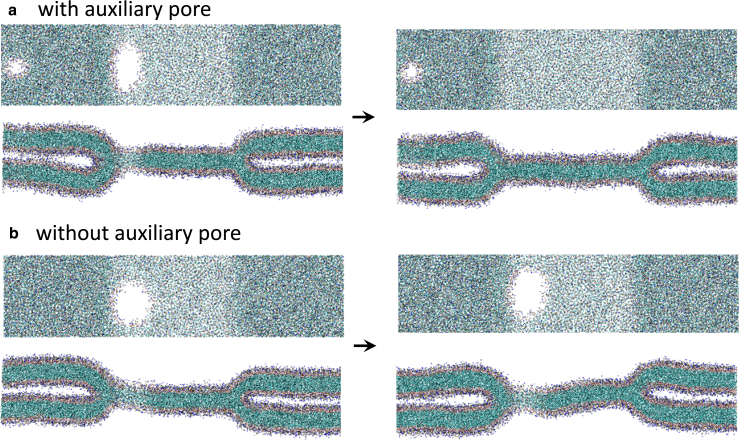
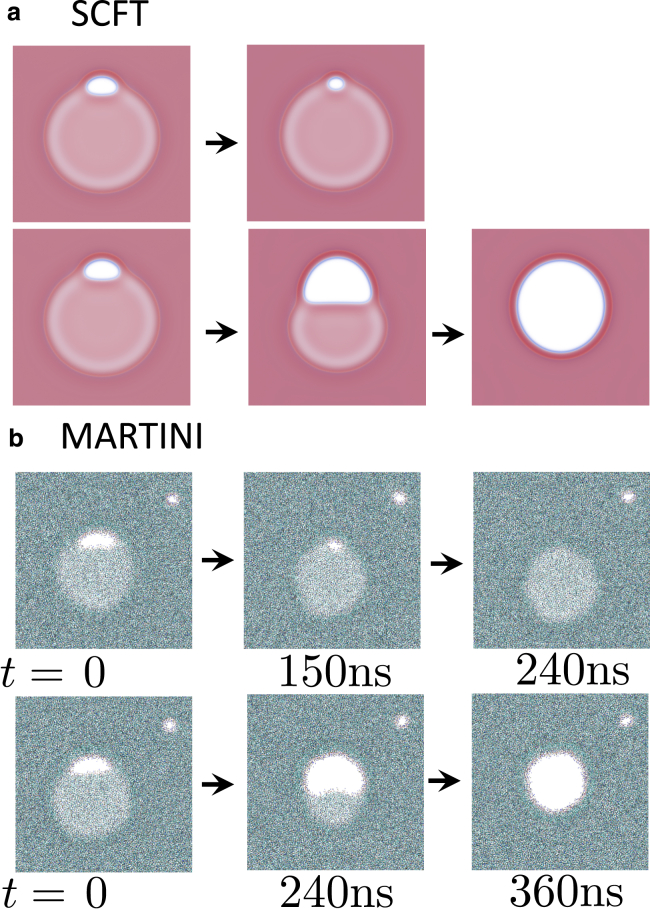
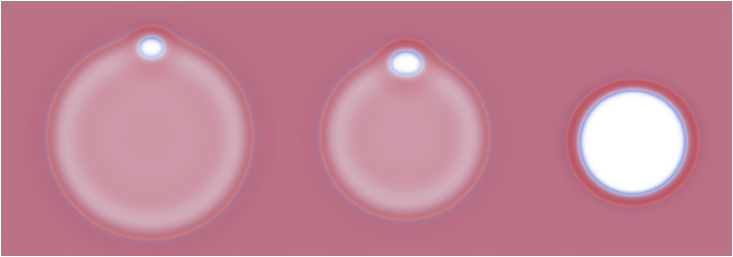
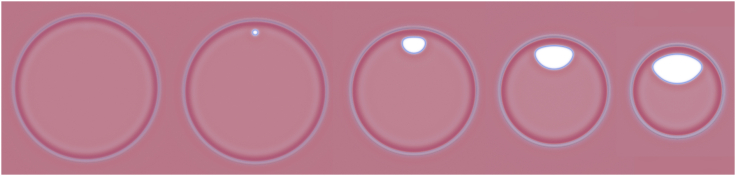
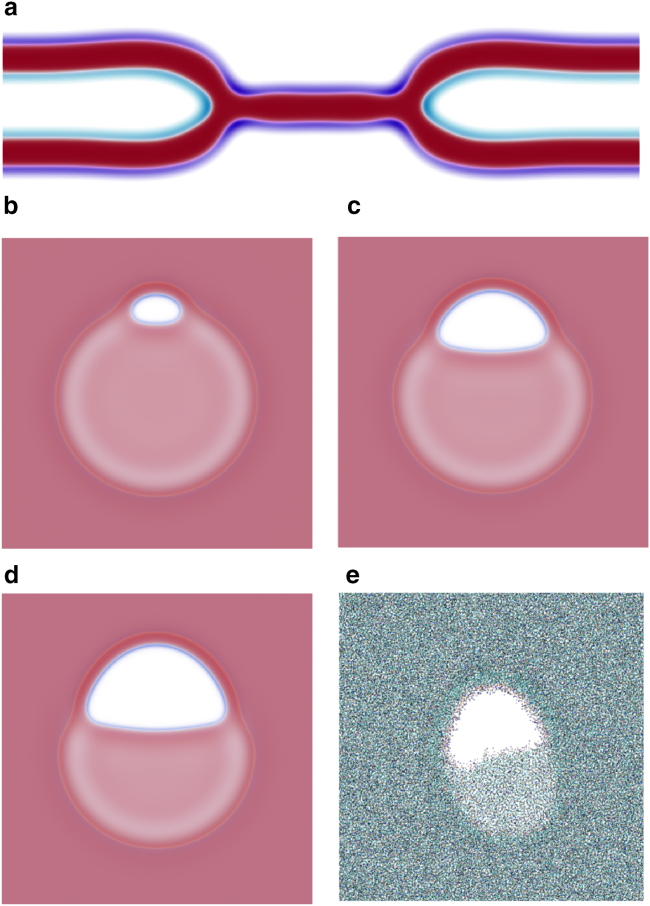
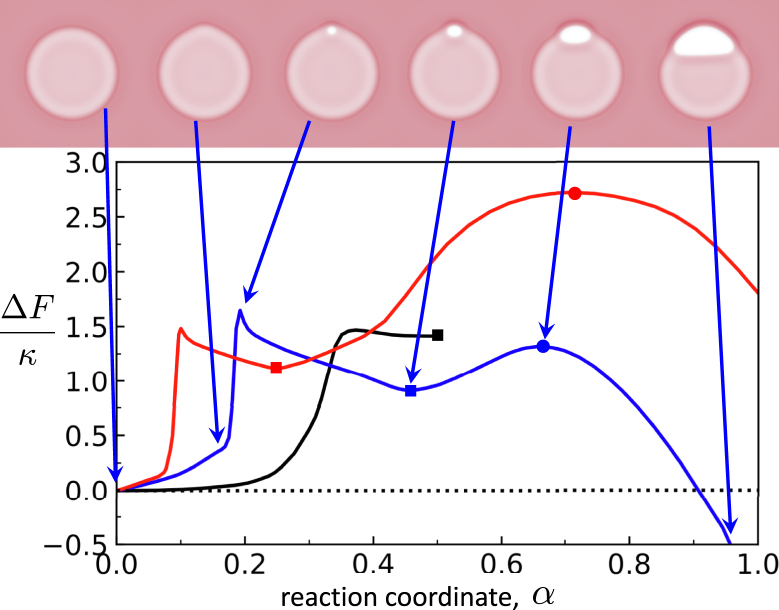
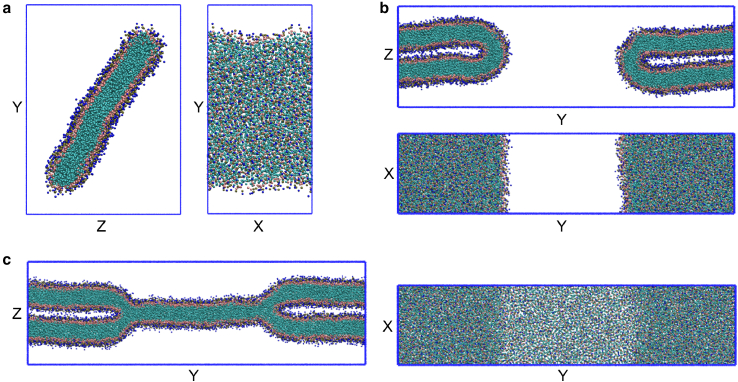
Exchange of material across two membranes, as in the case of synaptic neurotransmitter release from a vesicle, involves the formation and poration of a hemifusion diaphragm (HD). The nontrivial geometry of the HD leads to environment-dependent control, regarding the stability and dynamics of the pores required for this kind of exocytosis. This work combines particle simulations, field-based calculations, and phenomenological modeling to explore the factors influencing the stability, dynamics, and possible control mechanisms of pores in HDs. We find that pores preferentially form at the HD rim, and that their stability is sensitive to a number of factors, including the three line tensions, membrane tension, HD size, and the ability of lipids to "flip-flop" across leaflets. Along with a detailed analysis of these factors, we discuss ways that vesicles or cells may use them to open and close pores and thereby quickly and efficiently transport material.


Conflict of interest statement

Declaration of interests The authors declare no competing interests.

Figures

Figure 1
Figure 1
Qualitative illustration of the fusion of a vesicle with a membrane, as described using particle-based simulations of the coarse-grained MARTINI model (upper row) and self-consistent field theory (SCFT) (lower row). The vesicle starts locally fused with the membrane, by way of a hemifusion diaphragm (HD). A pore then forms at the rim of the HD and expands to form a fusion pore. This work focuses on the HD itself, which is highlighted in a box. To see this figure in color, go online.
Figure 2
Figure 2
Rim pores are shown (a) as described in the phenomenological model and in (b) SCFT and (c) particle-based simulations with depictions of each type of bounds: pore edge, e, fusion pore, p, and three-bilayer junction, h. The sketch, (a), shows a HD, with radius Rh (outlined in red), which has a rim pore (RP) of width 2a. The outer (green) and inner (blue) interfaces of the RP have radii of curvature Rp and Re, respectively. Line tensions, labeled λ exert forces along the blue arrows. The dimensions of the system along x and y axes are denoted as Lx and Ly, respectively. The widths of the SCFT and particle-based simulations are 60 and 45nm, respectively. To see this figure in color, go online.
Figure 3
Figure 3
Line tensions from SCFT (lines) and particle-based simulations (points). Data correspond to dimensionless ratios, λp/λh (red) and λe/λh (black). Error bars indicate uncertainties in the spontaneous curvature and line tension from MARTINI calculations. Line tensions from SCFT are shown as functions of the volume fraction of the hydrophobic tail, f, or the spontaneous monolayer curvature, c0, in units of the membrane thickness, D4 nm (alternate abscissa), and are calculated for χN=30 and 2d2.75D11nm (solid), χN=30 and 2d1.75F7nm (dashed), and χN=45 and 2d2.75D11nm (dotted). The majority of this work uses DMPC lipids in particle-based simulations and f=0.8 and χN=30 for SCFT, where the preferred spacing near HDs is typically 2d2.75D11nm. Note that λpπκ/2d, thus the corresponding value is λp/λhπκ/2dλh. Absolute line tensions are shown in Fig. 15. To see this figure in color, go online.
Figure 4
Figure 4
Critical rim pore area fraction as a function of the two line-tension ratios, λe/λh and λp/λh. Critical pore geometries are shown for our simulated systems and key points to illustrate the nature of instabilities. These data are calculated from the phenomenological model as saddlepoints, dF/dRe=dF/dRp=dF/dRh=0, with a chosen to satisfy the area constraint. The membrane separation is negligible, d=0. Data are absent where no saddlepoints exists. The gray line denotes where the pore goes from recessed to protruding either inward or outward. The extra “protruding” portions (see Λ terms discussed in the appendix) are highlighted by a rectangular box in illustrations 1, 3, and 5, and POPC. To see this figure in color, go online.
Figure 5
Figure 5
Critical rim pore area fractions similar to those shown in Fig. 4, but accounting for the finite separation, 2d, between the apposing membranes. Data are shown for (a) d/Rh0(d)=0.1 and (b) d/Rh0(d)=0.3, where Rh0(d) is the radius of an HD without rim pore. The outlined region is shifted and expanded compared with Fig. 4. Note that the reference HD area, Ah0(d), increases with d as described in the appendix. To see this figure in color, go online.
Figure 6
Figure 6
Rim pores under zero tension (linear three-bilayer junction) for different lipid architectures (tail-volume fraction, f) and interaction strengths, χN. Each image was extracted from a system like the one shown at the top, seen from above. For small f the line tensions are such that the system can reduce its free energy by growing a rim pore, converting the three-bilayer junction (h-type interface with line tension, λh) into a segment of a fusion pore, λp, and a membrane pore/edge, λe. For larger f this is no longer true, and the pore shrinks. The headgroup repulsion, however, prevents the rim pore from shrinking away entirely, making it metastable. For even larger f, the lipid head is not large enough to hold the pore open and it closes. There is thus a small band, in the χNf plane, where the rim pore is metastable at zero tension. The spontaneous monolayer curvature, c0, is shown in units of the membrane thickness, D. A more detailed plot is shown in Fig. 16. To see this figure in color, go online.
Figure 7
Figure 7
Systems similar to Fig. 6 in molecular dynamics simulations of DMPC lipids. Rim pores are introduced and allowed to stabilize either (a) with or (b) without an auxiliary pore, which allows lipid exchange between the cis and trans leaflets. The presence of the auxiliary pore (a, left boundary) dictates the stability of the rim pore. To see this figure in color, go online.
Figure 8
Figure 8
Progression of (a) SCFT at χN=30 and f=0.8 and (b) molecular dynamics simulations of DMPC membranes started with (top) subcritical and (bottom) supercritical pores, which therefore shrink or grow, respectively. The molecular dynamics simulations were both initialized by creating a pore of size Ap=0.18Ah0(d) but small fluctuations lead to the pore growing or shrinking to become super- or subcritical. The auxiliary pores on the top-right corner allow for lipid flip-flop in the molecular dynamics simulation. To see this figure in color, go online.
Figure 9
Figure 9
Pre-rim-pore behavior in circular HDs, obtained by SCFT. Large HDs may contain small, metastable pre-rim pores, similar in size to the zero-tension case. In smaller HDs (higher tension) the pre-rim pore grows. Even smaller HDs become unstable to transformation into a full fusion pore. To see this figure in color, go online.
Figure 10
Figure 10
Images of HDs held at fixed radii using a ring, which wraps around them. Each calculation was done with the same number of lipids in the NVT ensemble. The leftmost image illustrates an equilibrium-sized HD, whereas the others are constricted by the ring. To see this figure in color, go online.
Figure 11
Figure 11
HDs with rim pores are shown for systems without flip-flops for (a–d) SCFT and (e) molecular dynamics simulations. Flip-flops are forbidden in SCFT through a repulsion between headgroups on the inner cis (a, light blue) and outer trans (a, dark blue) leaflets. An HD cross section is illustrated in (a) followed by (b–d) membranes with different numbers of lipids in the two, outer trans leaflets. Small and larger rim pores (b and d) are easily stabilized in SCFT, due to the lack of fluctuations. To see this figure in color, go online.
Figure 12
Figure 12
Free energy along the minimum free-energy pathway for the formation of a rim pore and its growth into a fusion pore. The metastable pre-rim pore and the critical rim pore are indicated by a square and a circle, respectively. Data are shown for a rim pore forming on a linear three-bilayer junction (black) at zero tension, corresponding to the limit as the HD radius diverges (see Fig. 7), in a small circular HD (blue) with Rh020nm, and a larger circular HD (red), with Rh030nm. Rh0 denotes the radius of the HD without rim pore. Key steps, i.e., metastable states (pre-rim pores) and saddlepoints (critical rim pores), are shown for the small circular HD with arrows indicating the point along the path corresponding to each image. Free energies are given in units of the bilayer bending modulus, κ. Pore growth is not shown for the linear, three-bilayer junction, as the pore never becomes stable. To see this figure in color, go online.
Figure 13
Figure 13
Sketch of the area deviation due to the membrane separation, 2d, for the threefold junction. The simple description ignores the membrane area used to connect the different regions, i.e., it treats the threefold junction as depicted in (a). A more realistic scenario is (b), where a semicircular membrane region of length πd replaces a membrane distance of 2d (1 d for each membrane in the double layer).
Figure 14
Figure 14
Example systems used in SCFT calculations to obtain the line tensions for (a) edge, e, (b) rim pore, p, and (c) HD, h, interfaces. Double-layer separation, d, is controlled using periodic boundaries and controlling the system size. Hydration repulsion prevents the double-layer region from expanding into a circular cross section. d is chosen to match the double-layer region, as described further in Fig. 3. To see this figure in color, go online.
Figure 15
Figure 15
Absolute line tensions corresponding to Fig. 3, in units of N¯kBT. Data are shown for λe (black), λp (red), and λh (blue). Calculations are done for χN=30 and 2d2.75D11nm (solid), χN=30 and 2d1.75F7nm (dashed), and χN=45 and 2d2.75D11nm (dotted). The parameters of primary interest, f=0.8 and χN=30, have line tensions of λe=0.288N¯kBT/R0, λh=0.290N¯kBT/R0, and λp=0.160N¯kBT/R0. The absolute line tensions found in MARTINI simulations are POPC: λe=(14.5±0.5)kBT/nm, λh=(11.5±1.0)kBT/nm, λp=(18.3±1.5)kBT/nm, and 2d=4.7±0.1 nm; DMPC: λe=(9.4±0.5)kBT/nm, λh=(16.5±1.0)kBT/nm, λp=(17.5±1.3)kBT/nm, and 2d=4.3±0.1 nm. For comparison between SCFT and particle simulations or experiments, N¯kBT4.78κ96kBT and R00.83D3.3 nm. To see this figure in color, go online.
Figure 16
Figure 16
(a) Monolayer spontaneous curvature, c0, and (b) monolayer bending energy, κm, are shown as functions of lipid tail volume fraction, f, for χN=25 (black), χN=30 (red), χN=35 (green), χN=40 (blue), and χN=45 (purple). To see this figure in color, go online.
Figure 17
Figure 17
Example systems used in MARTINI simulations to calculate the line tensions for (a) edge, e, (b) rim pore, p, and (c) HD, h, interfaces. The separation of the double-layer regions, d, is controlled by the amount of water contained between the layers, as diffusion of water across the membrane is slow on the simulation timescale. d is chosen to match that chosen by the circular HD systems. To see this figure in color, go online.

Similar articles

Cited by

  • Fission of double-membrane tubes under tension.
    Spencer RKW, Santos-Pérez I, Shnyrova AV, Müller M. Spencer RKW, et al. Biophys J. 2024 Nov 19;123(22):3977-3996. doi: 10.1016/j.bpj.2024.10.009. Epub 2024 Oct 15. Biophys J. 2024. PMID: 39410713 Free PMC article.

References

    1. Rizzoli S.O., Jahn R. Kiss-and-run, Collapse and ‘Readily Retrievable’ Vesicles. Traffic. 2007;8:1137–1144. - PubMed
    1. Haucke V., Neher E., Sigrist S.J. Protein scaffolds in the coupling of synaptic exocytosis and endocytosis. Nat. Rev. Neurosci. 2011;12:127–138. - PubMed
    1. Wu L.-G., Hamid E., et al. Chiang H.-C. Exocytosis and Endocytosis: Modes, Functions, and Coupling Mechanisms. Annu. Rev. Physiol. 2014;76:301–331. - PMC - PubMed
    1. Rizzoli S.O. Synaptic vesicle recycling: steps and principles. EMBO J. 2014;33:788–822. - PMC - PubMed
    1. Kononenko N.L., Haucke V. Molecular mechanisms of presynaptic membrane retrieval and synaptic vesicle reformation. Neuron. 2015;85:484–496. - PubMed

LinkOut - more resources