. 2024 Jul;205(1):207-219.
doi: 10.1111/bjh.19563. Epub 2024 Jun 12.

Upregulation of HOXA3 by isoform-specific Wilms tumour 1 drives chemotherapy resistance in acute myeloid leukaemia

Affiliations

Upregulation of HOXA3 by isoform-specific Wilms tumour 1 drives chemotherapy resistance in acute myeloid leukaemia

Basil Allen et al. Br J Haematol. 2024 Jul.

Abstract

Upregulation of the Wilms' tumour 1 (WT1) gene is common in acute myeloid leukaemia (AML) and is associated with poor prognosis. WT1 generates 12 primary transcripts through different translation initiation sites and alternative splicing. The short WT1 transcripts express abundantly in primary leukaemia samples. We observed that overexpression of short WT1 transcripts lacking exon 5 with and without the KTS motif (sWT1+/- and sWT1-/-) led to reduced cell growth. However, only sWT1+/- overexpression resulted in decreased CD71 expression, G1 arrest, and cytarabine resistance. Primary AML patient cells with low CD71 expression exhibit resistance to cytarabine, suggesting that CD71 may serve as a potential biomarker for chemotherapy. RNAseq differential expressed gene analysis identified two transcription factors, HOXA3 and GATA2, that are specifically upregulated in sWT1+/- cells, whereas CDKN1A is upregulated in sWT1-/- cells. Overexpression of either HOXA3 or GATA2 reproduced the effects of sWT1+/-, including decreased cell growth, G1 arrest, reduced CD71 expression and cytarabine resistance. HOXA3 expression correlates with chemotherapy response and overall survival in NPM1 mutation-negative leukaemia specimens. Overexpression of HOXA3 leads to drug resistance against a broad spectrum of chemotherapeutic agents. Our results suggest that WT1 regulates cell proliferation and drug sensitivity in an isoform-specific manner.

Keywords: HOXA3; WT1; biomarkers; chemotherapy resistance.


Conflict of interest statement

CONFLICT OF INTEREST STATEMENT

No competing interests to disclose.

Figures

Figure 1.
Figure 1.
The schematic diagram illustrates the alternative start codons and splicing sites of the 12 major WT1 transcripts.
Figure 2.
Figure 2.
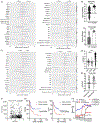
(A) The graph depicts mean ± SEM of WT1 transcript expression levels in the Beat AML cohort. The comparison between l+/+ vs. l−/− and l+/− vs. s+/+ does not yield significant differences. However, all other pairwise comparisons demonstrate significant distinctions, with a p-value of <0.0001. (B) The graph depicts a positive correlation between sWT1+/− and sWT1+/+ or sWT1−/+, as indicated by Pearson Correlation tests, from the Beat AML cohort (n=560). (C) Graph depicts the correlation between specific WT1 transcripts within the Beat AML cohort. (D) The graph depicts the correlation between annotated WT1 exons within the BeatAML cohort. The correspondence between WT1 exons and Ensembl IDs is provided in the supplementary file. (E) The graph depicts 95% confidence interval and mean log fold change of different WT1 transcript expression in leukemia samples with and without common mutations from the Beat AML cohort. (F) The graph depicts 95% confidence interval and mean log fold change of WT1 transcript expression in different cytogenetic, FAB, and clinical outcome subgroups (comparing “yes” vs. “no” for indicated parameters). (G) The graph depicts the distribution of p-values for differential exon expression in WT1 with and without common mutations and separates the distributions by the sign of the log fold change (effect size) when applicable. (H) The graph illustrates a strong consistency in Spearman correlation (r) values between WT1 and all other genes in the TCGA and Beat AML cohorts. (I) Graphs depict positive correlations between WT1 and GATA2/RUNX1 as indicated by Pearson Correlation tests, from the Beat AML (n=493) and TCGA cohort (n=165). (J) Graphs depict mutual exclusive mutation patterns of WT1, RUNX1, and GATA2 mutations in AML/MDS cohorts.
Figure 3.
Figure 3.
(A) MOLM13 cells were infected with lentiviruses encoding doxycycline (DOX)-inducible WT1 transcripts and an empty control with an out of frame green fluorescent protein (GFP) fluorescence marker. The competitive drug graphs depict the normalized percentage of transduced cells (normalized to no drug treatment, drug induced change%) treated with dose gradients of cytarabine in the presence or absence of Dox for 48 hours measured by flow cytometry. (B) MOLM14, OCIAML2, and OCIAML3 cells were infected with lentiviruses encoding doxycycline (Dox)-inducible sWT1+/− transcripts with a green fluorescent protein (GFP). The competitive drug graphs depict the normalized percentages of transduced cells (normalized to no drug treatment, Drug induced change%) treated with dose gradients of cytarabine in the presence or absence of Dox for 48 hours measured by flow cytometry (C) MOLM13 cells were infected with lentiviruses encoding Dox- inducible sWT1 transcript with a GFP outframe fluorescence marker. The competitive drug graphs depict the normalized percentage of transduced cells (normalized to no drug treatment, drug induced change%) treated with dose gradients of cytarabine in the presence for 2 days measured by flow cytometry. (D) Similar competitive drug assays were performed on MOLM14, OCIAML2, and OCIAML3 leukemia cells transduced with Dox- inducible sWT1+/− transcript. (E) MOLM13, MOLM14, OCIAML2, and OCIAML3 cells were infected with lentiviruses encoding constitutive sWT1+/− transcript and an empty control with a dsred outframe fluorescence marker. The competitive drug graphs depict the normalized percentage of transduced cells (normalized to no drug treatment, drug induced change%) treated with dose gradients of cytarabine in the presence for 2 days measured by flow cytometry. (F) The representative flow contour plots demonstrated increased transduced sWT1+/− (Dsred%) when treated with increased doses of cytarabine for 2 days. (G) The graph depicts the mRNA expression level of WT1 in the presence and absence of Dox measured by reverse transcription of extracted RNA. The housekeeping gene GAPDH was used as an internal loading control. (H) OCIAML2 and MOLM13 cells were infected with lentiviruses encoding a Dox- inducible shRNA targeting WT1 exon 7. Drug curves depict mean ± SEM of viabilities of OCIAML2 and MOLM13 cells transduced with shRNA targeting WT1 exon 7 treated with dose gradients of cytarabine in the presence or absence of Dox. Viability was assessed via MTS assay and normalized to no drug treatment controls.
Figure 4.
Figure 4.
(A) MOLM13, MOLM14, OCIAMl2, OCIAML3, and GDM cell lines were infected with constitutive lentivirus encoding WT1 transcripts or an empty control with a red fluorescent protein (Dsred). The competitive growth graphs depict the percentage changes of transduced cells (Dsred+%) over 11 days in culture measured by flow cytometry. (B) MOLM13, MOLM14, OCIAMl2, OCIAML3, and GDM cell lines were infected with Dox inducible lentivirus encoding sWT1+/−. The dot plots depict the percentage changes of transduced cells (GFP%) at day 6 in the presence or absence of Dox. Significance was determined by a Wilcoxon matched-pairs signed rank test (*p < 0.05). (C) Representative cell cycle histograms for OCIAML3 cells expressing sWT1+/− or sWT1−/− (Dsred+) or non-transduced control cells (Dsred−). (D) The bar graphs show the percentages of cells in different cell cycle stages, calculated by the FlowJo Watson Pragmatic Algorithm from three cell lines (MOLM13, OCIAML2, and OCIAML3). Statistical analyses were determined by paired two-tailed t tests. (E) The immunoblot image shows p53 protein levels in cells expressing either a sgRNA targeting p53 (sgTP53) or a non-specific control sgRNA (sgNT). Vinculin and Actin served as loading controls. (F) OCIAML2 and OCIAML3 cells transduced with sgRNAs targeting TP53 were subsequently transduced with sWT1+/− DsRed plasmid following puromycin selection. Competitive growth curves show the percentage changes in the sWT1+/− expressing population (DsRed+) over time. (G) GDM and MOLM14 cells were treated with increasing doses of the MDM2 inhibitor idasanutlin for one month, generating idasanutlin-resistant cell lines that were found to harbor TP53 mutations through exome sequence analysis (paper in revision). These cells were subsequently transduced with sWT1+/− DsRed plasmid. Competitive growth curves depict percentage changes of sWT1+/− expressing cells (Dsred+%) on these idasanutlin-resistant TP53 mutant cell lines over time. (H) Bar graphs show a significant reduction in colony numbers of mouse hematopoietic stem and progenitor cells (HSPCs) expressing sWT1+/− compared to empty vector controls, both in M3434 pancytokine and M3435 myeloid-enriched methylcellulose media. Statistical analyses were determined by two-tailed t tests.
Figure 5.
Figure 5.
(A) Representative flow cytometry DAPI cell cycle histograms (bottom panel) in different CD71 expression categories (top panel). (B) Representative FACS dot plots of OCIAML2 cells transduced with the indicated overexpression vector (Dsred+) and stained for CD71. (C) Mean Fluorescence Intensity (MFI) of CD71 on sWT1 transcript expressing and non-transduced cells. Significance was determined by paired two-tailed t tests. (D) Schematic illustrating the experimental workflow of evaluating cytarabine sensitivity in CD71high and CD71dim expressing leukemia samples-populations for cytarabine treatment. Cells were treated with cytarabine for 24-48 hours and quantified by MTS viability assay. (E) The graph depicts higher mean ± SEM of cell viabilities of CD71dim cells compared to CD71high patient cells treated with cytarabine for 48 hours determined by MTS assays. (F) Representative FACS histograms depict decreased CD71 expression in both CD71high and CD71dim cells treated with cytarabine. (G) The graph depicts the mean (from four technical replicates) MTS absorbance of both CD71high and CD71dim leukemia cells culture for 48 hours in basal Stemspan medium. Statistical significances were assessed using two-tailed tests and expressed as **p < 0.01. (H) Graphs depict decreased CD71 expression in both CD71high and CD71dim cells treated with cytarabine from three donors. (I) The bar graphs depict real time PCR ∆∆Ct values of WT1, HOXA3, and GATA2 in sorted CD71− cells compared to CD71+ cells from 4 different AML samples. HPRT was used as the reference control. Statistical significance was determined using two-tailed Student’s t-tests (Mann-Whitney test).
Figure 6.
Figure 6.
(A-B) The Venn graph depicts the number of differentially expressed genes between cells expressing sWT1+/− (A) or sWT1−/− (B) and cells expressing other sWT1 transcripts and an empty control vector. (B) RNAseq heatmap indicating differentially expressed genes between sWT1+/− and other transcripts. The average expression of the indicated genes in primary leukemia samples from the BeatAML cohort is also displayed. (C) The competitive growth assay plot demonstrates a growth disadvantage of HOXA3 expressing cells (Dsred+) determined by flow cytometry. (D) Representative flow cytometry plots showing decreased CD71 expression in OCIAML3 and MOLM13 cells transduced expressing HOXA3 (Dsred+). (E) The competitive drug graphs depict increased resistance of HOXA3 expressing cells indicated by increased percentages of Dsred+ cells treated with dose gradients of cytarabine in the presence of doxycycline for 48 hours measured by flow cytometry. (F) The competitive growth assay plot shows a growth disadvantage of cells expressing GATA2. (G) Representative flow cytometry plot showing decreased CD71 expression in OCIAML3 and MOLM13 cells transduced with a GATA2 overexpression vector. (H) The competitive drug graphs depict the percentages of GATA2 expression cells (MOLM13, OCIAML3) treated with dose gradients of cytarabine and venetoclax for 48 hours measured by flow cytometry. (I) The representative immunoblot images showing increased p21 (encoded by CDKN1A) in Dox inducible sWT1−/− overexpressing cells in the presence of Dox for 3 days. (J) RT-qPCR data showing 2^-ΔΔCt changes of HOXA3, GATA2, and WT1 in sWT1+/−, HOXA3, GATA2, or HOXA3 overexpressing cells normalized to HPRT and empty vector control cells. (K) Representative cell cycle histograms depict percentages of cells in different cell cycle stages in HOXA3 or GATA2 overexpressing (Dsred+) or control (Dsred−) cells. The experiments were performed from 2-3 cell lines (OCIAML3, MOLM13, and MOLM14). (L) The graph demonstrates low expression of HOXA3 in CMK and K562 cells compared to other leukemia cell lines. Relative mRNA expression was normalized to HPRT control. (M) The competitive drug curves depict percentage changes of HOXA3, sWT1+/− and GATA2 overexpressing (DsRed+) K562 and CMK cells treated with a gradient dose of cytarabine.
Figure 7.
Figure 7.
(A), (C) The graphs depict 95% confidence interval and mean log fold changes of HOXA3 and GATA2 mRNA expression in leukemia samples with and without indicated mutations (Left), cytogenetic events, specific FAB subtypes, and clinical outcome groups (right) from the Beat AML cohort all samples (A) or only NPM1 WT samples (C). (B) The graphs depict increased HOXA3 expression (MED) in the Beat AML and TCGA AML samples in NPM1 mutation vs. NPM1 WT samples determined by two-tailed t tests, ****p<0.0001. (D) The bar graph compares HOXA3 mRNA expression in Beat AML patient samples that responded (CR+PR) or showed resistance to chemotherapies determined by a Mann-Whitney test. (E) The bar graph compares HOXA3 mRNA expression in de novo or relapsed patient samples from the Beat AML cohort determined by a Mann-Whitney test. (F) The graph depicts a negative correlation between HOXA3 expression and patient OS in the Beat AML cohort determined by a Spearman correlation coefficient test, ***p<0.001. (G) The Kaplan-Meier survival curves depict shorter DFS and OS time in patients with above compared to below HOXA3 expression from the TCGA cohort, determined by Log-rank (Mantel-Cox) tests. (H) The graph illustrates the percentage of viable cells (OCIAML2, MOLM14, and OCIAML3) overexpressing HOXA3 treated with a dose gradient of Platinum, Cisplatin, and Gemcitabine.

Similar articles

References

    1. Wang ZY, Qiu QQ, Deuel TF. The Wilms’ tumor gene product WT1 activates or suppresses transcription through separate functional domains. Journal of Biological Chemistry. 1993;268(13):. - PubMed
    1. Hastie ND. Wilms’ tumour 1 (WT1) in development, homeostasis and disease. Development (Cambridge). 2017;144(16):. - PubMed
    1. Bharathavikru R, Dudnakova T, Aitken S, et al. Transcription factor Wilms’ tumor 1 regulates developmental RNAs through 3′ UTR interaction. Genes Dev. 2017;31(4):. - PMC - PubMed
    1. Varanasi R, Bardeesv N, Ghahremani M, et al. Fine structure analysis of the WT1 gene in sporadic Wilms tumors. Proc Natl Acad Sci U S A. 1994;91(9):. - PMC - PubMed
    1. Mrowka C, Schedl A. Wilms’ tumor suppressor gene WT1: From structure to renal pathophysiologic features. Journal of the American Society of Nephrology. 2000;11(SUPPL. 16): - PubMed

MeSH terms