. 2024 Aug;11(30):e2308393.
doi: 10.1002/advs.202308393. Epub 2024 Jun 13.

Integrated Single-Cell RNA-seq and ATAC-seq Reveals Heterogeneous Differentiation of CD4+ Naive T Cell Subsets is Associated with Response to Antidepressant Treatment in Major Depressive Disorder

Affiliations

Integrated Single-Cell RNA-seq and ATAC-seq Reveals Heterogeneous Differentiation of CD4+ Naive T Cell Subsets is Associated with Response to Antidepressant Treatment in Major Depressive Disorder

Zuoli Sun et al. Adv Sci (Weinh). 2024 Aug.

Abstract

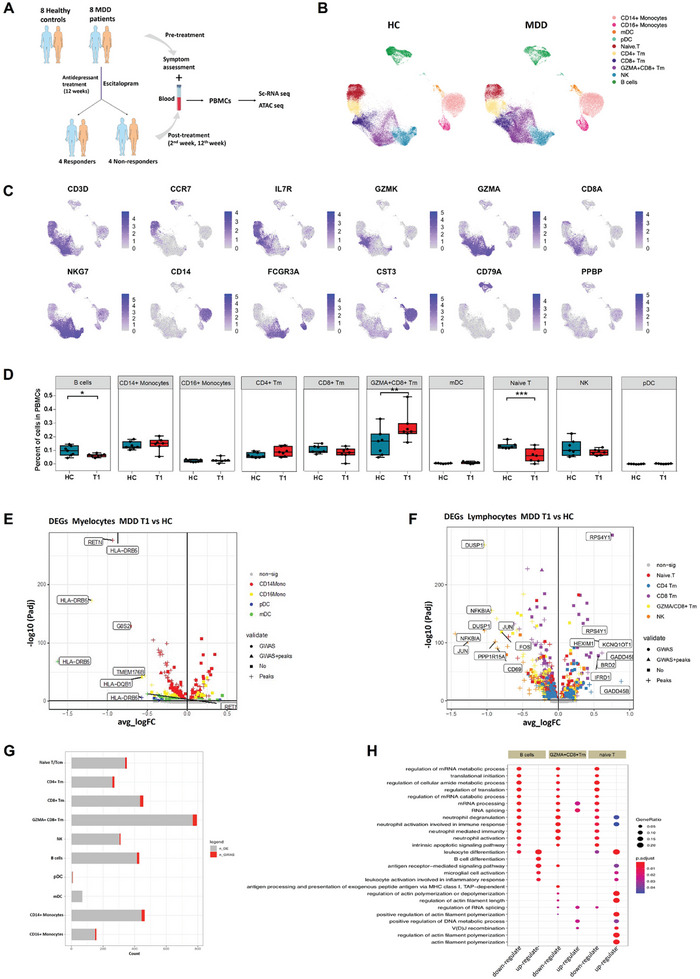
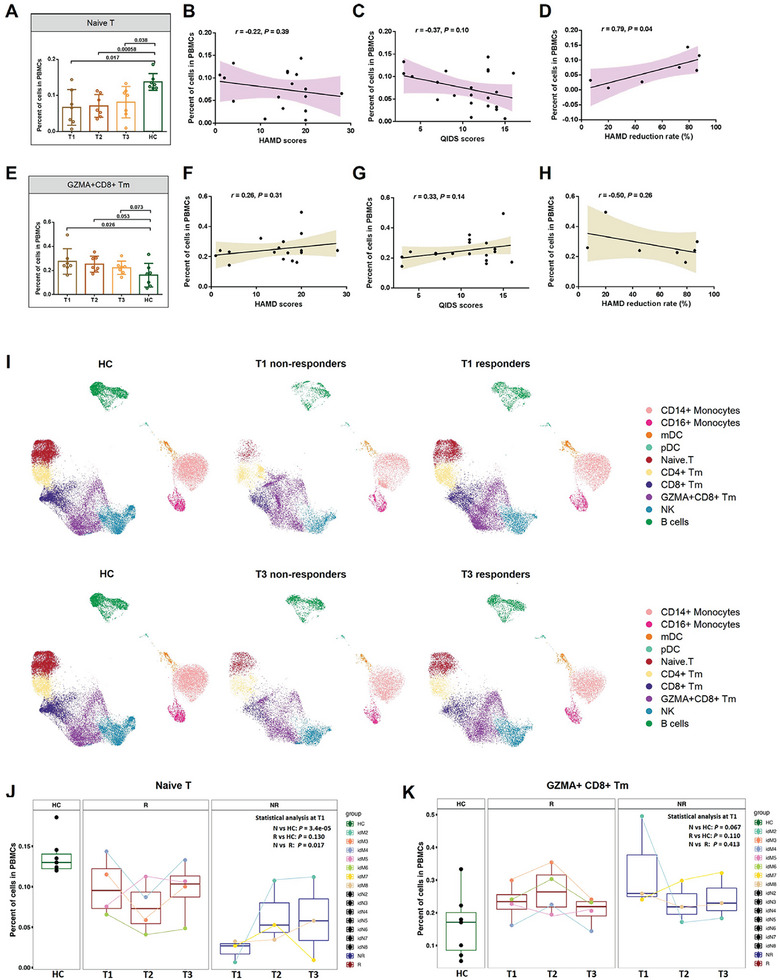
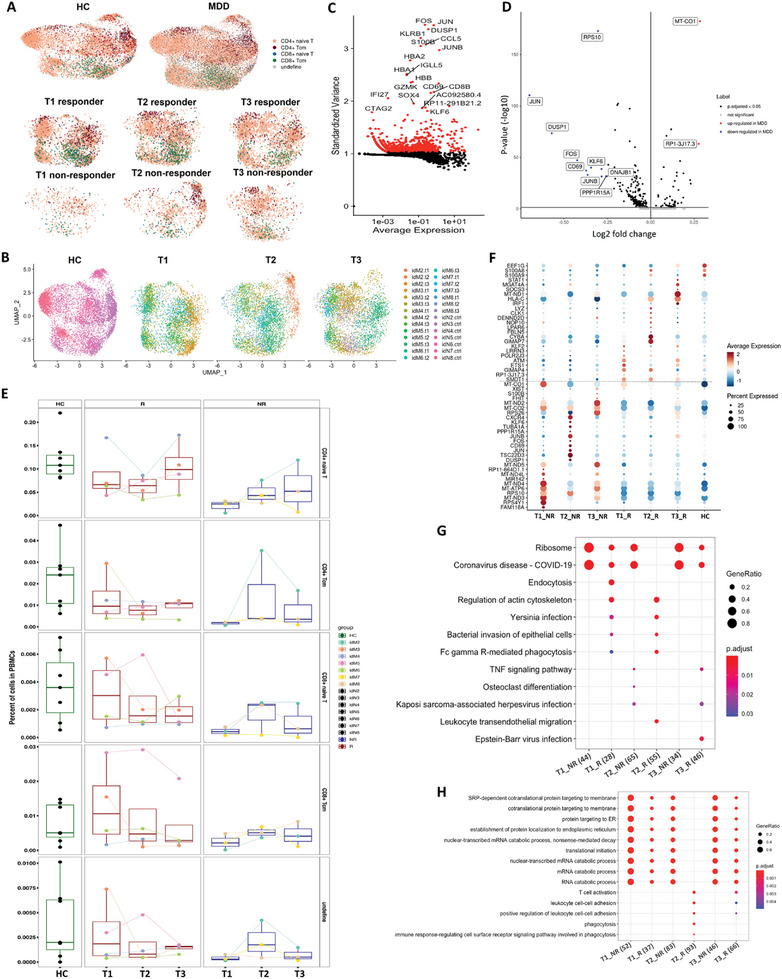
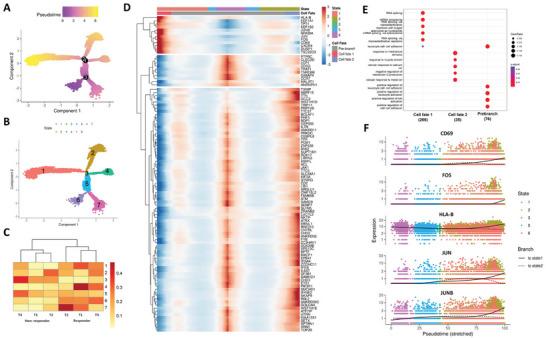
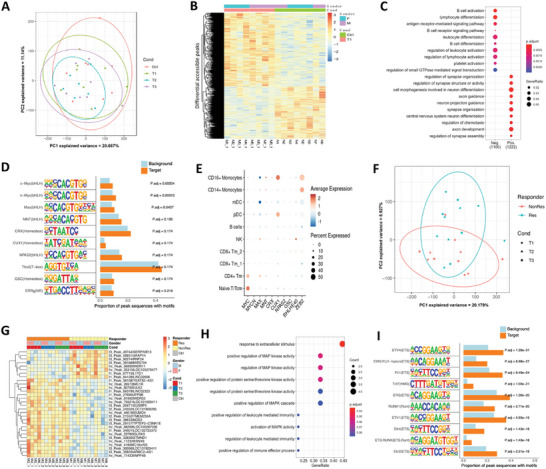
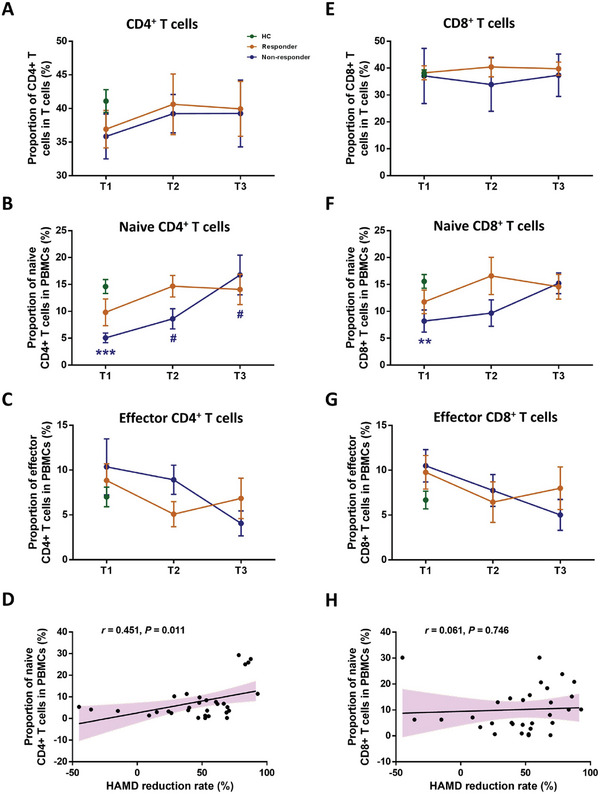
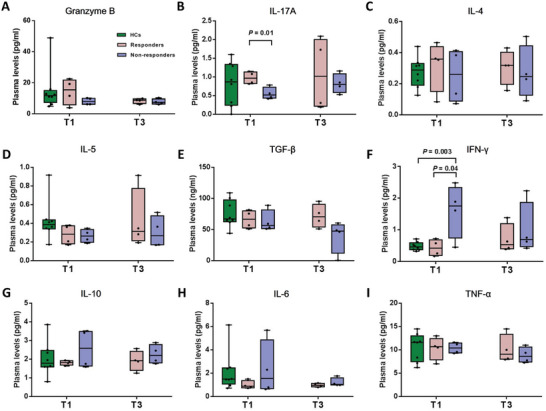
The mechanism involved in major depressive disorder (MDD) is well-studied but the mechanistic origin of the heterogeneous antidepressant effect remains largely unknown. Single-cell RNA-sequencing (scRNA-seq) and assay for transposase-accessible chromatin using sequencing (ATAC-seq) on peripheral blood mononuclear cells from 8 healthy individuals and 8 MDD patients before or after 12 weeks of antidepressant treatment is performed. scRNA-seq analysis reveals a lower proportion of naive T cells, particularly CD4+ naive T cells, in MDD patients compared to controls, and in nonresponders versus responders at the baseline. Flow cytometry data analysis of an independent cohort of 35 patients and 40 healthy individuals confirms the findings. Enrichment analysis of differentially expressed genes indicated obvious immune activation in responders. A specific activated CD4+ naive T population in responders characterized by enhanced mitogen-activated protein kinases (MAPK) pathway is identified. E-twenty six (ETS) is proposed as an upstream regulator of the MAPK pathway and heterogeneous differentiation in activated CD4+ naive T population is associated with the response to antidepressant treatment in MDD patients. A distinct immune feature manifested by CD4+ naive T cells during antidepressant treatment in MDD is identified. Collectively, this proposes the molecular mechanism that underlies the heterogeneous antidepressant outcomes for MDD.

Keywords: ATAC sequencing; CD4+ naive T cells; major depressive disorder; single‐cell RNA sequencing.


Conflict of interest statement

The authors declare no conflict of interest.

Figures

Figure 1
Figure 1
Assessment of major transcriptional profile changes between healthy controls (HCs) and MDD patients at the baseline (before antidepressant treatment). A) A brief experimental flowchart. B) Uniform manifold approximation and projection (UMAP) showing selected marker genes expression derived from scRNA‐seq data; C) UMAPs of MDD patients and HCs, showing the ten main cell types (CD14+ monocytes, CD16+ monocytes, myeloid dendritic cell (mDC), plasmacytoid dendritic cells (pDC), naive or central memory T cells (naive T), CD4+ T memory cells (CD4+ Tm), CD8+ T memory cells (CD8+ Tm), GZMA+CD8+ Tm, natural killer cells (NK) and B cells). D) Comparison of the proportions of 10 major cell types between MDD patients and HCs. E) Volcano plot showing differential gene expression between myelocytes from HCs and MDD patients before antidepressant treatment. F) Volcano plot showing differential gene expression between lymphocytes from HCs and MDD patients before antidepressant treatment. G) Number of differentially expressed genes in major cell types with red and grey bars indicating genes located within or external to the MDD GWAS risk loci. H, Pathway analysis for differentially expressed genes in naive T, GZMA+CD8+ T, and B cells.
Figure 2
Figure 2
Comparison of major cell types across different cohorts and its relationship with clinical phenotypes. A) A comparison of naive T cells across different conditions. B) Correlation analysis of naive T cells and HAMD‐17 scores in MDD patients. C) Correlation analysis of naive T cells and QIDS scores in MDD patients. D) Correlation analysis of naive T cells and HAMD‐17 reduction rate after antidepressant treatment in MDD patients. E) A comparison of GZMA+CD8+ Tm cells across different conditions. F) Correlation analysis of GZMA+CD8+ Tm cells and HAMD‐17 scores in MDD patients. G) Correlation analysis of naive T cells and QIDS scores in MDD patients. H) Correlation analysis of GZMA+CD8+ Tm cells and HAMD‐17 reduction rate after antidepressant treatment in MDD patients. I) UMAP representation of scRNA‐seq data showing the major cell types across conditions. J) Comparison of naive T cells in healthy and MDD patients with different therapeutic outcomes. K) Comparison of GZMA+CD8+ Tm cells in healthy and MDD patients with different therapeutic outcomes. Sample time point: T1 = baseline, T2 = 2 weeks, T3 = 12 weeks.
Figure 3
Figure 3
Subcluster analysis to assess major changes in transcriptional profiles of naive T cells between healthy and MDD patients across cohorts. A) UMAP shows the distribution of cell subclusters in participants across different time points. B) UMAP shows the distribution of cell subclusters colored by different individuals. C) Scatter plot showing high variable genes of naive T cell. The top 2000 genes with the highest variation in gene expression were marked in red. D) Volcano plot showing differential gene expression in CD4+ naive T cells between HCs and MDD patients before antidepressant treatment. E) Comparison of naive T subclusters in HCs and MDD patients with different time points. F) Top differentially expressed genes in CD4+ naive T cells of HCs and MDD patients across conditions. The dotted line separated the up‐regulated expressed genes between responders and non‐responders. G & H) KEGG (G) or GO (H) enrichment pathway or functional analysis of differentially expressed genes in CD4+ naive T cells for HCs and MDD patients across conditions.
Figure 4
Figure 4
Trajectory analysis of CD4+ naive T populations. A) The differentiation trajectory of CD4+ naive T cells, coloured‐coded by pseudotime. B) The differentiation trajectory of CD4+ naive T cells, coloured‐coded by the states. C) Heatmap showing the proportions of CD4+ naive T cells in different states across conditions. D) Heatmap showing different blocks of DEGs in each state of CD4+ naive T population. E) Gene set enrichment analysis of CD4+ naive T population in each cell fate. F) Scatter plots showing the expression of selected transcription factors in different cell states as the pseudotime progresses.
Figure 5
Figure 5
Epigenetically distinct cell subpopulations in MDD patients across conditions. A) Principal Component Analysis (PCA) of ATAC‐seq signals to identify major sources of variation in chromatin accessibility between MDD patients and healthy controls (HCs). B) Hierarchically clustered heatmap of row‐normalized chromatin accessibility in ATAC‐seq for differentially accessible peaks between MDD patients and controls at baseline. C) Pathway enrichment of genes adjacent to differentially accessible peaks between MDD patients and controls at baseline. D) Enrichment of known transcription factor motifs in differentially accessible peaks between MDD patients and controls at baseline. E) Dot plots showing the expression of the top 10 transcription factor motifs in major cell types of MDD patients at baseline from scRNA‐seq data. F, PCA of ATAC‐seq signal to identify major sources of variation in genomics data from patients across disease outcomes. G) Hierarchically clustered heatmap of row‐normalized gene activity in ATAC‐seq for differentially accessible peaks between responders and non‐responders of MDD patients. H, Pathway enrichment of genes flanking differentially accessible peaks for responders and non‐responders. I, Enrichment of known transcription factor motifs in differentially accessible peaks between responders and non‐responders.
Figure 6
Figure 6
Flow cytometry verification of changes in T cell proportions in MDD patients across conditions. Comparison of major cell types between HCs and MDD patients across conditions are shown in A) (CD4+ T cells), B) (naive CD4+ T cells), C) (effector CD4+ T cells), E) (CD8+ T cells), F) (naive CD8+ T cells), G) (effector CD8+ T cells), respectively. D) Correlation analysis of naive CD4+ T cells at baseline and HAMD reduction rate in MDD patients after antidepressant treatment. H) Correlation analysis of naive CD8+ T cells at baseline and HAMD reduction rate in MDD patients after antidepressant treatment.
Figure 7
Figure 7
Comparison of cytokines between controls and all MDD patients across conditions.

Similar articles

Cited by

References

    1. Dudek K. A., Dion‐Albert L., Kaufmann F. N., Tuck E., Lebel M., Menard C., Eur. J. Neurosci. 2021, 53, 183. - PMC - PubMed
    1. Sharma A., Curr. Neuropharmacol. 2016, 14, 749. - PMC - PubMed
    1. Beurel E., Toups M., Nemeroff C. B., Neuron 2020, 107, 234. - PMC - PubMed
    1. Zorrilla E. P., Luborsky L., McKay J. R., Rosenthal R., Houldin A., Tax A., McCorkle R., Seligman D. A., Schmidt K., Brain Behav. Immun. 2001, 15, 199. - PubMed
    1. Patas K., Willing A., Demiralay C., Engler J. B., Lupu A., Ramien C., Schafer T., Gach C., Stumm L., Chan K., Vignali M., Arck P. C., Friese M. A., Pless O., Wiedemann K., Agorastos A., Gold S. M., Front. Immunol. 2018, 9, 291. - PMC - PubMed

MeSH terms

Substances

LinkOut - more resources