. 2024 Sep 1;201(1):85-102.
doi: 10.1093/toxsci/kfae075.

Acute exposure to dihydroxyacetone promotes genotoxicity and chromosomal instability in lung, cardiac, and liver cell models

Affiliations

Acute exposure to dihydroxyacetone promotes genotoxicity and chromosomal instability in lung, cardiac, and liver cell models

Arlet Hernandez et al. Toxicol Sci. .

Abstract

Inhalation exposures to dihydroxyacetone (DHA) occur through spray tanning and e-cigarette aerosols. Several studies in skin models have demonstrated that millimolar doses of DHA are cytotoxic, yet the genotoxicity was unclear. We examined the genotoxicity of DHA in cell models relevant to inhalation exposures. Human bronchial epithelial cells BEAS-2B, lung carcinoma cells A549, cardiomyocyte Ac16, and hepatocellular carcinoma HepG3 were exposed to DHA, and low millimolar doses of DHA were cytotoxic. IC90 DHA doses induced cell cycle arrest in all cells except the Ac16. We examined DHA's genotoxicity using strand break markers, DNA adduct detection by Repair Assisted Damage Detection (RADD), metaphase spreads, and a forward mutation assay for mutagenesis. Similar to results for skin, DHA did not induce significant levels of strand breaks. However, RADD revealed DNA adducts were induced 24 h after DHA exposure, with BEAS-2B and Ac16 showing oxidative lesions and A549 and HepG3 showing crosslink-type lesions. Yet, only low levels of reactive oxygen species or advanced glycation end products were detected after DHA exposure. Metaphase spreads revealed significant increases in chromosomal aberrations in the BEAS-2B and HepG3 with corresponding changes in ploidy. Finally, we confirmed the mutagenesis observed using the supF reporter plasmid. DHA increased the mutation frequency, consistent with methylmethane sulfonate, a mutagen and clastogen. These data demonstrate DHA is a clastogen, inducing cell-specific genotoxicity and chromosomal instability. The specific genotoxicity measured in the BEAS-2B in this study suggests that inhalation exposures pose health risks to vapers, requiring further investigation.

Keywords: DNA adducts; cytotoxicity; dihydroxyacetone; e-cigarettes; genotoxicity.


Conflict of interest statement

None declared.

Figures

Fig. 1.
Fig. 1.
DHA induces cytotoxicity across the cell line panel. Cells were dosed with increasing concentrations of DHA, and the survival percentage was calculated relative to control, mock-treated cells. Survival curves are shown for BEAS-2B (A), A549 (B), Ac16 (C), and HepG3 (D). HepG3 was previously characterized, and the graph was adapted from (Hernandez et al. 2022). The calculated IC50 and IC90 values for each cell line are shown in the table (E).
Fig. 2.
Fig. 2.
DHA exposure promoted cell-type-dependent cell death mechanisms. A) Total and cleaved PARP-1 protein probed in BEAS-2B cells exposed to 12.5 mM DHA at 24, 48, 72 h or 1 µM of camptothecin (CPT) for 24 h. CPT is a positive control for apoptosis. B) LC3BII expression levels were measured in A549 cells exposed to DHA at 24, 48, and 72 h. C) PARP-1 and LC3BII were measured in Ac16 cells exposed to DHA at 24, 48, and 72 h. Graphs are displayed as the mean±SEM over 3 biological replicates. Significance is displayed as follows: *P < 0.05 and ****P < 0.0001.
Fig. 3.
Fig. 3.
Cell-dependent cell cycle arrest was found due to DHA exposure. Cell cycle phases were observed in cells dosed with corresponding IC90 values at 24, 48, or 72 h using propidium iodide (PI) staining and flow cytometry. A) BEAS-2B cells were dosed with 12.5 mM DHA, and the cell population increased in the S-phase starting at 48 h. B) A549 cells were dosed with 10 mM DHA, and an increase in the G1 phase was observed starting at 24 h. C) Ac16 cells were dosed with 4.4 mM DHA, and no cell cycle arrest was observed. Representative cell cycle analysis graphs are displayed for each time point with the mean±SEM over 3 biological replicates in the bar graphs.
Fig. 4.
Fig. 4.
Cell cycle checkpoint markers are altered by DHA exposure. A) BEAS-2B cells were probed with cell cycle markers, cyclin B1, and p21 using immunoblotting after exposure to 12.5 mM DHA for 24, 48, and 72 h. B) Cell cycle marker, p21 was probed using immunoblotting in A549 cells dosed with 10 mM DHA for 24, 48, and 72 h. C) Cell cycle markers, cyclin B1, and cyclin D1 were probed using immunoblotting. Graphs are displayed as the mean ± SEM over 3 biological replicates. Significance displayed: *P < 0.05; **P < 0.01.
Fig. 5.
Fig. 5.
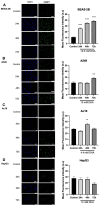
53BP1 recruitment and nuclear intensity after DHA exposure in the cell line panel. Cells were stained with 53BP1, and the nuclear intensity of the 53BP1 immunofluorescence was quantified in cells dosed with their corresponding IC90 concentrations of DHA for 24, 48, and 72 h. BEAS-2B (A), A549 (B), Ac16 (C), and HepG3 cells (D). The scale bar is 50 µM. The graphs are displayed as the mean fluorescence intensity of the cells and SEM. Significance displayed as follows: **P<0.01; ***P<0.001; ****P<0.0001.
Fig. 6.
Fig. 6.
Cell line-dependent changes in total ROS after DHA exposure. Total reactive oxygen species (ROS) measured by CM-H2DCFDA assay in cells exposed to DHA for 1, 4, 24, 48, and 72 h. Tert-butyl hydrogen peroxide (TBHP) is dosed at 250 µM for 1 h and used as a positive control for ROS generation. A) BEAS-2B, B) A549, C) Ac16, and D) HepG3 cells. Graphs are displayed relative to control of the mean intensity ± SEM over 3 biological replicates. Significance is shown as follows: *P < 0.05; **P < 0.01; ***P < 0.001; ****P < 0.0001.
Fig. 7.
Fig. 7.
After DHA exposure, the cell line panel does not significantly produce methylglyoxal (MG) or advanced glycation end products (AGEs). MG and AGEs were quantified by immunofluorescence using specific antibodies after dosing with the IC90 of DHA for 24 or 48 h. MG at 2.5 or 25 µM was used as a positive control for MG generation. A–D) show the MG quantification for the BEAS-2B (A), A549 (B), Ac16 (C), and HepG3 (D). E–H) show the AGE levels for the BEAS-2B (E), A549 (F), Ac16 (G), and HepG3 (H). Total intensity was measured using a binary threshold and fluorescence intensity for a minimum of 100 cells is quantified and averaged over 3 biological replicates. The graph displays the mean fluorescence intensity for the cells ± SEM. Significance displayed as follows: *P < 0.05.
Fig. 8.
Fig. 8.
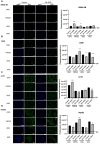
DHA exposure for 24 h induces oxidative and crosslink-type lesions within the cell panel. The Repair Assisted Damage Detection (RADD) assay measured specific classes of DNA adducts after DHA exposure for 24 h across cell lines. The OXO reaction measured oxidative lesions, T4PDG measured crosslink-type lesions, UDG measured uracil lesions, and AAG was used to measure alkylation lesions. Adduct levels are measured by immunofluorescence of the modified nucleotide inserted into the damage site. The total nuclear intensity for at least 100 cells is averaged over 3 biological replicates. The images are representative with a scale bar of 50 µM. The graphs display the fluorescence intensity for the cells ± SEM. A) BEAS-2B cells, B) A549 cells, C) Ac16 cells, and D) HepG3 cells. Significance displayed as follows: *P < 0.05; **P < 0.01; ****P < 0.0001.
Fig. 9.
Fig. 9.
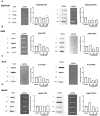
TopI and Top2α related DNA–protein crosslinks in cells dosed with DHA. The rapid approach for DNA adduct recovery (RADAR) assay measured specific DNA–protein crosslinks from topoisomerase I (TOPI) and topoisomerase II-α (TOP2α). The cells were dosed with corresponding IC90 values of DHA for 1, 4, and 24 h in A) BEAS-2B cells, B) A549 cells, C) Ac16 cells, and D) HepG3 cells. A representative image of each type of crosslinks is shown and graphs are displayed relative to control using the mean intensity ± SEM of 3 biological replicates. Significance displayed as follows: *P < 0.05; **P < 0.01.
Fig. 10.
Fig. 10.
Chromosomal aberrations increased across cell lines exposed to DHA. Metaphase spreads are used to measure chromosomal aberrations after DHA dosing. Aberrations were scored by the type of event: A: Chromatid Break, B: Chromatid Gap, C: Chromosome Ring, D: Chromatid Exchange, E: Centromere Disruption. Representative images for A) BEAS-2B, C) A549, and E) HepG3 are shown with aberrations indicated with the letter code noted above. The mean aberration counts for B) BEAS-2B, D) A549, and F) HepG3 are shown. The graph displays the total and categories of aberrations in DHA-dosed cells compared with control, mock-treated cells. Significance displayed as follows: *P < 0.05; **P < 0.01; ****P < 0.0001.
Fig. 11.
Fig. 11.
The chromosomal count is also altered by DHA exposure within the cell panel. Chromosomes were counted for each cell line in the metaphase spreads and categorized as aneuploidy (<2n), normal (2n), or polyploidy (>2n). Ordinal scoring (1 = aneuploid, 2 = normal, and 3 = polyploid) was used to quantify the number of events per metaphase. The graph displays the frequency distribution over all the spreads for the DHA-exposed and control, mock-treated cells. A) BEAS-2B cells, B) A549 cells, and C) HepG3 cells.
Fig. 12.
Fig. 12.
Increased supF mutation in HEK293T cells dosed with DHA. HEK293T cells were transfected with the supF reporter plasmid and then exposed to 10 mM DHA or 100 µM of methyl methanosulfonate (MMS) for 48 h. Plasmids were extracted, transformed into the indicator strain, and plated in parallel on the titer (A) and selection plates (B). C) Mutation frequency in supF is displayed in the graph and averaged over the 3 biological replicates. Significance displayed as follows: ****P < 0.0001.

Similar articles

Cited by

References

    1. Akin FJ, Marlowe E.. 1984. Non-carcinogenicity of dihydroxyacetone by skin painting. J Environ Pathol Toxicol Oncol. 5(4-5):349–351. - PubMed
    1. Braunberger TL, Nahhas AF, Katz LM, Sadrieh N, Lim HW.. 2018. Dihydroxyacetone: a review. J Drugs Dermatol. 17(4):387–391. - PubMed
    1. Conery AR, Harlow E.. 2010. High-throughput screens in diploid cells identify factors that contribute to the acquisition of chromosomal instability. Proc Natl Acad Sci U S A. 107(35):15455–15460. - PMC - PubMed
    1. Danielsen PH, Loft S, Møller P.. 2008. DNA damage and cytotoxicity in Type II lung epithelial (A549) cell cultures after exposure to diesel exhaust and urban street particles. Part Fibre Toxicol. 5(1):6. - PMC - PubMed
    1. Diao F, Li S, Tian Y, Zhang M, Xu LG, Zhang Y, Wang RP, Chen D, Zhai Z, Zhong B, et al. 2007. Negative regulation of MDA5- but not RIG-I-mediated innate antiviral signaling by the dihydroxyacetone kinase. Proc Natl Acad Sci U S A. 104(28):11706–11711. - PMC - PubMed

LinkOut - more resources