

Applications of de Bruijn graphs in microbiome research
- PMID: 38867733
- PMCID: PMC10989854
- DOI: 10.1002/imt2.4
Applications of de Bruijn graphs in microbiome research
Abstract
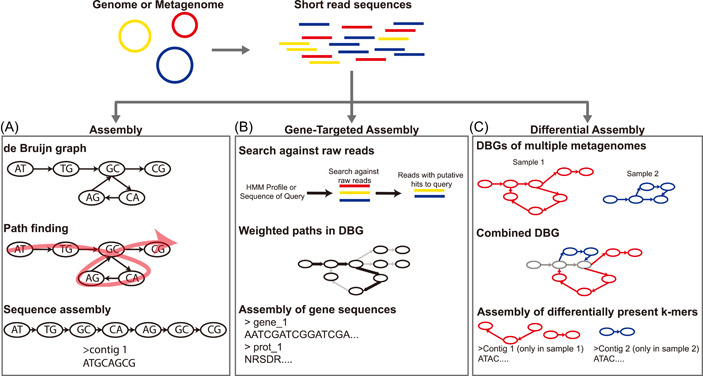
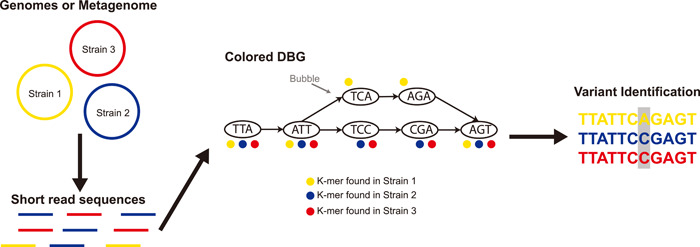
High-throughput sequencing has become an increasingly central component of microbiome research. The development of de Bruijn graph-based methods for assembling high-throughput sequencing data has been an important part of the broader adoption of sequencing as part of biological studies. Recent advances in the construction and representation of de Bruijn graphs have led to new approaches that utilize the de Bruijn graph data structure to aid in different biological analyses. One type of application of these methods has been in alternative approaches to the assembly of sequencing data like gene-targeted assembly, where only gene sequences are assembled out of larger metagenomes, and differential assembly, where sequences that are differentially present between two samples are assembled. de Bruijn graphs have also been applied for comparative genomics where they can be used to represent large sets of multiple genomes or metagenomes where structural features in the graphs can be used to identify variants, indels, and homologous regions in sequences. These de Bruijn graph-based representations of sequencing data have even begun to be applied to whole sequencing databases for large-scale searches and experiment discovery. de Bruijn graphs have played a central role in how high-throughput sequencing data is worked with, and the rapid development of new tools that rely on these data structures suggests that they will continue to play an important role in biology in the future.
Keywords: Omics; de Bruijn graphs; microbiome.
© 2022 The Authors. iMeta published by John Wiley & Sons Australia, Ltd on behalf of iMeta Science.
Conflict of interest statement
The authors declare that there are no conflict of interests.
Figures
Similar articles
-
Efficient parallel and out of core algorithms for constructing large bi-directed de Bruijn graphs.BMC Bioinformatics. 2010 Nov 15;11:560. doi: 10.1186/1471-2105-11-560. BMC Bioinformatics. 2010. PMID: 21078174 Free PMC article.
-
Integrating long-range connectivity information into de Bruijn graphs.Bioinformatics. 2018 Aug 1;34(15):2556-2565. doi: 10.1093/bioinformatics/bty157. Bioinformatics. 2018. PMID: 29554215 Free PMC article.
-
Assembly of long error-prone reads using de Bruijn graphs.Proc Natl Acad Sci U S A. 2016 Dec 27;113(52):E8396-E8405. doi: 10.1073/pnas.1604560113. Epub 2016 Dec 12. Proc Natl Acad Sci U S A. 2016. PMID: 27956617 Free PMC article.
-
Lossless indexing with counting de Bruijn graphs.Genome Res. 2022 Sep 27;32(9):1754-1764. doi: 10.1101/gr.276607.122. Genome Res. 2022. PMID: 35609994 Free PMC article.
-
The present and future of de novo whole-genome assembly.Brief Bioinform. 2018 Jan 1;19(1):23-40. doi: 10.1093/bib/bbw096. Brief Bioinform. 2018. PMID: 27742661 Review.
Cited by
-
Extremely fast construction and querying of compacted and colored de Bruijn graphs with GGCAT.Genome Res. 2023 Jul;33(7):1198-1207. doi: 10.1101/gr.277615.122. Epub 2023 May 30. Genome Res. 2023. PMID: 37253540 Free PMC article.
-
iMeta: Integrated meta-omics for biology and environments.Imeta. 2022 Mar 28;1(1):e15. doi: 10.1002/imt2.15. eCollection 2022 Mar. Imeta. 2022. PMID: 38867730 Free PMC article.
-
Assessing the de novo assemblers: a metaviromic study of apple and first report of citrus concave gum-associated virus, apple rubbery wood virus 1 and 2 infecting apple in India.BMC Genomics. 2024 Nov 8;25(1):1057. doi: 10.1186/s12864-024-10968-x. BMC Genomics. 2024. PMID: 39516740 Free PMC article.
References
-
- Ward, R. Matthew , Schmieder Robert, Highnam Gareth, and Mittelman David. 2013. “Big Data Challenges and Opportunities in High‐Throughput Sequencing.” Systems Biomedicine 1(1): 29–34. 10.4161/sysb.24470 - DOI
-
- Sutton, Granger G. , White Owen, Adams Mark D., and Kerlavage Anthony R.. 1995. “TIGR Assembler: A New Tool for Assembling Large Shotgun Sequencing Projects.” Genome Science and Technology 1(1): 9–19. 10.1089/gst.1995.1.9 - DOI
Publication types
LinkOut - more resources
Full Text Sources