

Contrast sensitivity is resilient to induced fast periodic defocus oscillations
- PMID: 38867768
- PMCID: PMC11166443
- DOI: 10.1364/BOE.521340
Contrast sensitivity is resilient to induced fast periodic defocus oscillations
Abstract
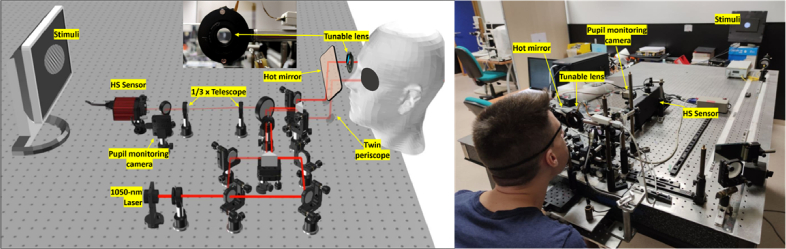
This study investigates the potential effects of periodic defocus oscillations on contrast sensitivity. Sinusoidal fluctuations at 5, 15, and 25 Hz, with defocus peak-to-valley values ranging from 0.15 to 3 D, were induced by means of a focus-tunable lens after calibrating its dynamic behavior. Monocular contrast sensitivity was measured on five young emmetropic subjects. The experimental data shows that contrast sensitivity loss due to defocus fluctuations is low for a wide range of frequencies and amplitudes. Only for the more severe case studied (25 Hz, ± 1.5 D) contrast threshold showed a clear increase in most subjects. Qualitative comparison of the empirical data with a simulation of modulation loss due to time integration of defocused retinal point spread functions, suggests a short integration time by the eye for defocus blur, around or even below a hundredth of a second.
© 2024 Optica Publishing Group.
Conflict of interest statement
The authors declare no conflicts of interest.
Figures


Similar articles
-
Effect of retinal image defocus on the thickness of the human choroid.Ophthalmic Physiol Opt. 2015 Jul;35(4):405-13. doi: 10.1111/opo.12218. Epub 2015 May 24. Ophthalmic Physiol Opt. 2015. PMID: 26010292
-
Impact of temporal fluctuations in optical defocus on visual acuity: Empirical results and modeling outcomes.J Vis. 2023 Mar 1;23(3):14. doi: 10.1167/jov.23.3.14. J Vis. 2023. PMID: 36971683 Free PMC article.
-
Binocular summation improves performance to defocus-induced blur.Invest Ophthalmol Vis Sci. 2011 Apr 25;52(5):2784-9. doi: 10.1167/iovs.10-6545. Invest Ophthalmol Vis Sci. 2011. PMID: 21228386
-
Mechanisms of emmetropization and what might go wrong in myopia.Vision Res. 2024 Jul;220:108402. doi: 10.1016/j.visres.2024.108402. Epub 2024 May 4. Vision Res. 2024. PMID: 38705024 Review.
-
Temporal integration of visual signals in lens compensation (a review).Exp Eye Res. 2013 Sep;114:69-76. doi: 10.1016/j.exer.2013.02.014. Epub 2013 Mar 5. Exp Eye Res. 2013. PMID: 23470505 Free PMC article. Review.
References
-
- Milders M., Sahraie A., Logan S., “Minimum presentation time for masked facial expression discrimination,” Emotion 22(1), 63–82 (2008).10.1080/02699930701273849 - DOI
-
- Bundesen C., Harms L., “Single-letter recognition as a function of exposure duration,” Psychol. Res. 62(4), 275–279 (1999).10.1007/s004260050057 - DOI
LinkOut - more resources
Full Text Sources