. 2024 May 3;15(6):3574-3585.
doi: 10.1364/BOE.521521. eCollection 2024 Jun 1.

hydro SIM: super-resolution speckle illumination microscopy with a hydrogel diffuser

Affiliations

hydro SIM: super-resolution speckle illumination microscopy with a hydrogel diffuser

Zijun Gao et al. Biomed Opt Express. .

Abstract

Super-resolution microscopy has emerged as an indispensable methodology for probing the intricacies of cellular biology. Structured illumination microscopy (SIM), in particular, offers an advantageous balance of spatial and temporal resolution, allowing for visualizing cellular processes with minimal disruption to biological specimens. However, the broader adoption of SIM remains hampered by the complexity of instrumentation and alignment. Here, we introduce speckle-illumination super-resolution microscopy using hydrogel diffusers (hydroSIM). The study utilizes the high scattering and optical transmissive properties of hydrogel materials and realizes a remarkably simplified approach to plug-in super-resolution imaging via a common epi-fluorescence platform. We demonstrate the hydroSIM system using various phantom and biological samples, and the results exhibited effective 3D resolution doubling, optical sectioning, and high contrast. We foresee hydroSIM, a cost-effective, biocompatible, and user-accessible super-resolution methodology, to significantly advance a wide range of biomedical imaging and applications.


Conflict of interest statement

The authors declare that there are no conflicts of interest in this article.

Figures

Fig. 1.
Fig. 1.
Speckle illumination microscopy with a hydrogel diffuser (hydroSIM). (a) Optical setup of hydroSIM and speckle pattern generated by a hydrogel diffuser. The orange dashed lines indicate the light rays without the hydrogel diffuser. (b) Photograph of the hydrogel diffuser. (c) Fabrication process of the hydrogel diffuser. PAAm-alginate hydrogel is prepared by mixing two components. 5-µm TiO2 particles are added to increase the scattering effect. (d) Super-resolution image formation of hydroSIM. The reconstruction process includes raw image acquisition, averaging and deconvolving raw images, calculating covariance between speckles and raw images, and final deconvolution. The diffraction-limited image is obtained by averaging and deconvolving raw images. Scale bar: 10 µm (a).
Fig. 2.
Fig. 2.
Characterization of hydroSIM. (a) Wide-field (WF), deconvolved wide-field (dec-WF), intermediate (INT), and hydroSIM images of a Siemens star with 60 spokes, simulated for the 515-nm emission wavelength and 100×,1.45 NA objective lens. (b) Decorrelation analysis of the four images in (a), resulting in the cut-off frequency (Kcd) and spatial resolution (DeARes). (c) Fourier analysis of the four images of (a), illustrating the cut-off frequency (black dashed lines). (d,e) Wide-field (d) and hydroSIM (e) images of 100-nm fluorescent beads (emission wavelength = 515 nm). (f-h) Zoomed-in images of the boxed regions as in the wide-field, intermediate, and hydroSIM images in (d,e). (i) Intensity profiles (black, red, blue) along the red dashed lines in (f-h), respectively. (j) Intensity profiles (black, red, blue) along the yellow dash lines in (f-h), respectively. (k) Wide-field (top right) and hydroSIM (bottom left) images of 6-µm dual-color surface-stained fluorescent microspheres (emission wavelengths = 515/680 nm). (l,m) Zoomed-in images of the boxed regions in (k). (n,o) Intensity profiles along the yellow dashed lines in (l,m) in the green (n) and dark red (o) channels. Scale bars: 10 µm (d, k), 500 nm (f), 5 µm (l).
Fig. 3.
Fig. 3.
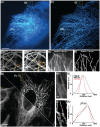
Imaging microtubules in HeLa cells using hydroSIM. (a,b) Wide-field (a) and hydroSIM (b) images of immunostained microtubules in HeLa cells taken by the 100×, 1.45 NA objective lens. (c-f) Zoomed-in images of the boxed regions as marked in (a,b). The curves in (c,d) show the intensity profiles resolving filaments as close as 134 nm along the corresponding yellow dashed lines. (g) Wide-field (bottom left)and hydroSIM (top right) images of immunostained microtubules in HeLa cells taken by the 40×, 1.3 NA objective lens. (h, i) Corresponding zoomed-in wide-field (h) and hydroSIM (i) images of the boxed region in (g). (j) Intensity profiles along the red dashed line in (h, black) and (i, red). (k) Intensity profiles along the yellow dash lines in (h, black) and (i, red). Scale bars: 10 µm (a, g), 1 µm (c, e, h).
Fig. 4.
Fig. 4.
Two-color imaging of actins and mitochondria in living HeLa cells using hydroSIM. (a,b) Wide-field (a) and hydroSIM (b) images of actins (green) and mitochondria (red) in live HeLa cells. (c,d) Zoomed-in images of the boxed regions as marked in (a, b). The curves in (c, d) show the intensity profiles of actins along the yellow dashed lines, showing the resolution of filaments separated by 181 nm. (e) Time-lapse images of mitochondrial movement over a period of 15 sec. The yellow arrows facilitate a better visualization of representative moving components. Scale bars: 10 µm (a), 1 µm (c), 2 µm (e).
Fig. 5.
Fig. 5.
Three-dimensional (3D) imaging of mitochondria (MT) and peroxisomes (PR) in HeLa cells using hydroSIM. (a,b) Maximum intensity projection of wide-field (a) and hydroSIM (b) images across a depth range of 4 µm. Depth information for the two organelles is coded as indicated in the color scale bar in (a). (c,f) Zoomed-in images of the boxed peroxisome in (a,b). (d,e,g,h) XZ (d,g) and YZ (e,h) views of the peroxisome in (c,f). (c-h) exhibit a nearly two-fold improvement of the FWHM values in the 3D hydroSIM images. (i,k) Zoomed-in images of the boxed regions containing mitochondria (red) and peroxisomes (green) as marked in (a,b). (j,l) XZ views of (i, k), respectively. (m,o) Zoomed-in images of the boxed regions containing mitochondria (red) and peroxisomes (green) as marked in (a, b). (n, p) YZ views of (m, o), respectively. Scale bars: 10 µm (a), 500 nm (c, f, i, m).

Similar articles

Cited by

References

    1. Sigal Y. M., Zhou R., Zhuang X., “Visualizing and discovering cellular structures with super-resolution microscopy,” Science 361(6405), 880–887 (2018).10.1126/science.aau1044 - DOI - PMC - PubMed
    1. Schermelleh L., Ferrand A., Huser T., et al. , “Super-resolution microscopy demystified,” Nat. Cell Biol. 21(1), 72–84 (2019).10.1038/s41556-018-0251-8 - DOI - PubMed
    1. Sahl S. J., Hell S. W., Jakobs S., “Fluorescence nanoscopy in cell biology,” Nat. Rev. Mol. Cell Biol. 18(11), 685–701 (2017).10.1038/nrm.2017.71 - DOI - PubMed
    1. Blom H., Widengren J., “Stimulated emission depletion microscopy,” Chem. Rev. 117(11), 7377–7427 (2017).10.1021/acs.chemrev.6b00653 - DOI - PubMed
    1. Hell S. W., Wichmann J., “Breaking the diffraction resolution limit by stimulated emission: stimulated-emission-depletion fluorescence microscopy,” Opt. Lett. 19(11), 780–782 (1994).10.1364/OL.19.000780 - DOI - PubMed

LinkOut - more resources