

In vitro investigation of the mechanics of fixed red blood cells based on optical trap micromanipulation and image analysis
- PMID: 38867786
- PMCID: PMC11166448
- DOI: 10.1364/BOE.523702
In vitro investigation of the mechanics of fixed red blood cells based on optical trap micromanipulation and image analysis
Abstract
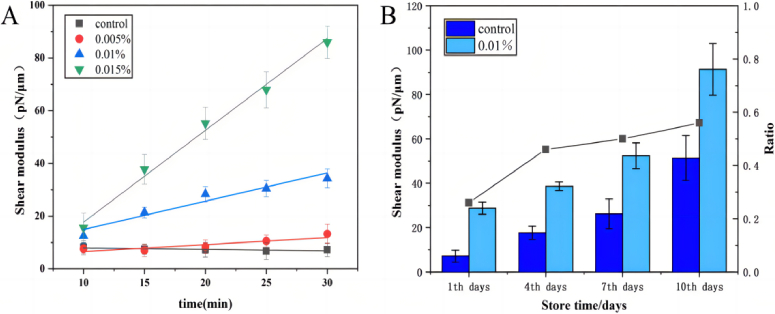
Erythrocyte deformability correlates with various diseases. Single-cell measurements via optical tweezers (OTs) enable quantitative exploration but may encounter inaccuracies due to erythrocyte life cycle mixing. We present a three-step methodology to address these challenges. Firstly, density gradient centrifugation minimizes erythrocyte variations. Secondly, OTs measure membrane shear force across layers. Thirdly, MATLAB analyzes dynamic cell areas. Results combined with membrane shear force data reveal erythrocyte deformational capacity. To further characterize the deformability of diseased erythrocytes, the experiments used glutaraldehyde-fixed erythrocytes to simulate diseased cells. OTs detect increased shear modulus, while image recognition indicates decreased deformation. The integration of OTs and image recognition presents a comprehensive approach to deformation analysis, introducing novel ideas and methodologies for investigating erythrocytic lesions.
© 2024 Optica Publishing Group.
Conflict of interest statement
The authors declare no potential conflict of interests.
Figures


Similar articles
-
Deformation behaviour of stomatocyte, discocyte and echinocyte red blood cell morphologies during optical tweezers stretching.Biomech Model Mechanobiol. 2020 Oct;19(5):1827-1843. doi: 10.1007/s10237-020-01311-w. Epub 2020 Feb 25. Biomech Model Mechanobiol. 2020. PMID: 32100179
-
Analysis of the variation in the determination of the shear modulus of the erythrocyte membrane: Effects of the constitutive law and membrane modeling.Phys Rev E Stat Nonlin Soft Matter Phys. 2012 Apr;85(4 Pt 1):041917. doi: 10.1103/PhysRevE.85.041917. Epub 2012 Apr 23. Phys Rev E Stat Nonlin Soft Matter Phys. 2012. PMID: 22680508 Free PMC article.
-
Dynamic fatigue measurement of human erythrocytes using dielectrophoresis.Acta Biomater. 2017 Jul 15;57:352-362. doi: 10.1016/j.actbio.2017.05.037. Epub 2017 May 17. Acta Biomater. 2017. PMID: 28526627
-
Structure and deformation properties of red blood cells: concepts and quantitative methods.Methods Enzymol. 1989;173:3-35. doi: 10.1016/s0076-6879(89)73003-2. Methods Enzymol. 1989. PMID: 2674613 Review.
-
Nonlinear elastic and viscoelastic deformation of the human red blood cell with optical tweezers.Mech Chem Biosyst. 2004 Sep;1(3):169-80. Mech Chem Biosyst. 2004. PMID: 16783930 Review.
References
-
- Bose S., Banerjee M., “Effect of non-Newtonian characteristics of blood on magnetic particle capture in occluded blood vessel,” J. Magn. Magn. Mater. 374, 611–623 (2015).10.1016/j.jmmm.2014.09.012 - DOI
LinkOut - more resources
Full Text Sources